 ( click to enlarge )
Shares of Amazon.com, Inc. (NASDAQ:AMZN) are struggling to clear the resistance from a falling 20-day SMA. The MACD is also in negative zone and the RSI is below the 50% level, so I expect the correction to continue. Only a break above the 265 area, right where both the 20-day SMA and the 50-day SMA reside, would confirm a change in the short-term trend.
 ( click to enlarge )
Netflix, Inc. (NASDAQ:NFLX) was great short. I covered my short position at a price of 165 (as mentioned on Twitter). I'll use rallies to short as the stock appears to be breaking down.
 ( click to enlarge )
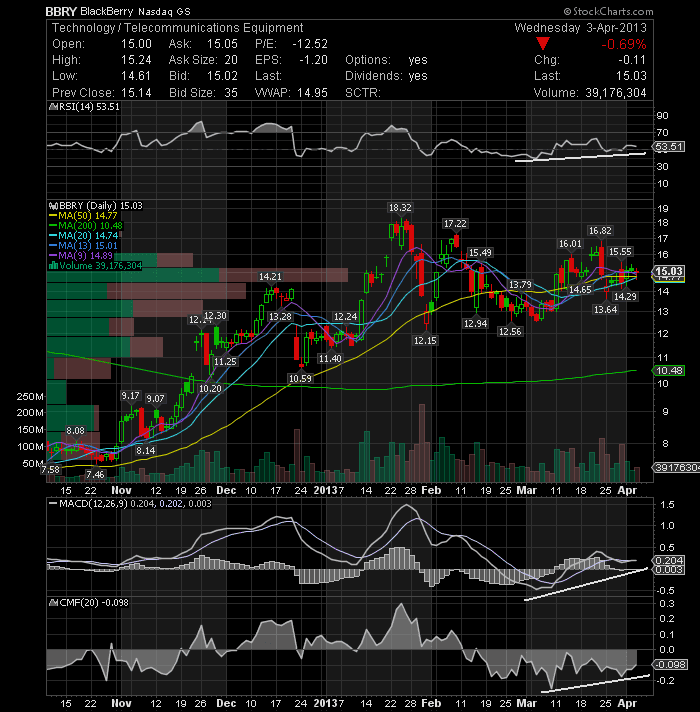
Research In Motion Ltd (NASDAQ:BBRY) The stock is still trading within the 14.7-15.05 support area, which contains the 13-day SMA and the 50-day SMA. I expect to see a bullish resumption towards the 15.55, with a daily close above to confirm the uptrend ahead of the 16.82 resistance. From a technical pertspective the RSI has edged above the 50% level and the MACD is moving up smartly towards the positive zone. Additionally, the Chain Money Flow indicator in the chart is starting to move back up, maybe money headed back in. I keep my bullish bias on BBRY and accumulating shares on the pullbacks.
 ( click to enlarge )
Vringo, Inc. (NYSEAMEX:VRNG) Strong day in down market. Volume is trending up. Looks to run higher.
 ( click to enlarge )
VirnetX Holding Corporation (NYSEAMEX:VHC) Put a nice reversal candle on the daily. If we can break today's high tomorrow, I believe the stock will rally back to the $20 level. Stop 16
During the day I tweet many times to my readers. I encourage everybody to subscribe AC Investor Blog twitter and newsletter, so you can receive my trade ideas and stock news in real time.
Disclaimer : This is not an investment advisory, and should not be used to make investment decisions. Information in AC Investor Blog is often opinionated and should be considered for information purposes only. No stock exchange anywhere has approved or disapproved of the information contained herein. There is no express or implied solicitation to buy or sell securities. The charts provided here are not meant for investment purposes and only serve as technical examples. Don't consider buying or selling any stock without conducting your own due diligence.
Thanks for visiting AC Investor Blog.
AC
