 ( click to enlarge )
I hope everyone is enjoying their long weekend.
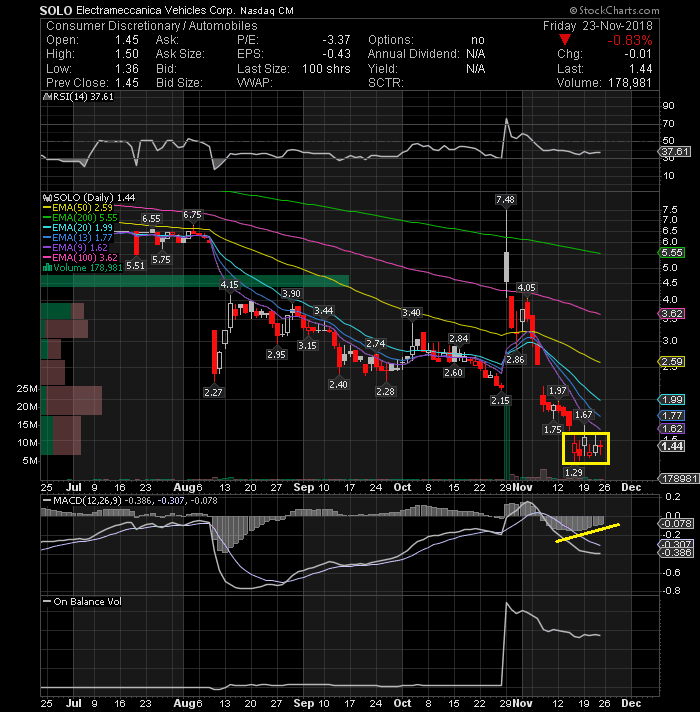
Get ready for a potential money-maker. SOLO is the first symbol I want you to look at because it could be very explosive.
The iPhone of cars? This statement seems to be exaggerated but only the time will tell, however i took a long position on Friday after read the chart and this interesting article from Benzinga. SOLO is trading at a base on low volume, which is a nice setup for a fast move back to where is was only a few trading sessions ago. Hence, if buying presure enters the stock as I suspect, share prices could rise siginificantly. Looking at the chart, we can see that this stock is a former runner with a history of making big moves, and indicators are now starting to turn up again showing upward momentum. A convincing move above $1.5 can lead to a breach of the blue line (EMA20) around 1.99
 ( click to enlarge )
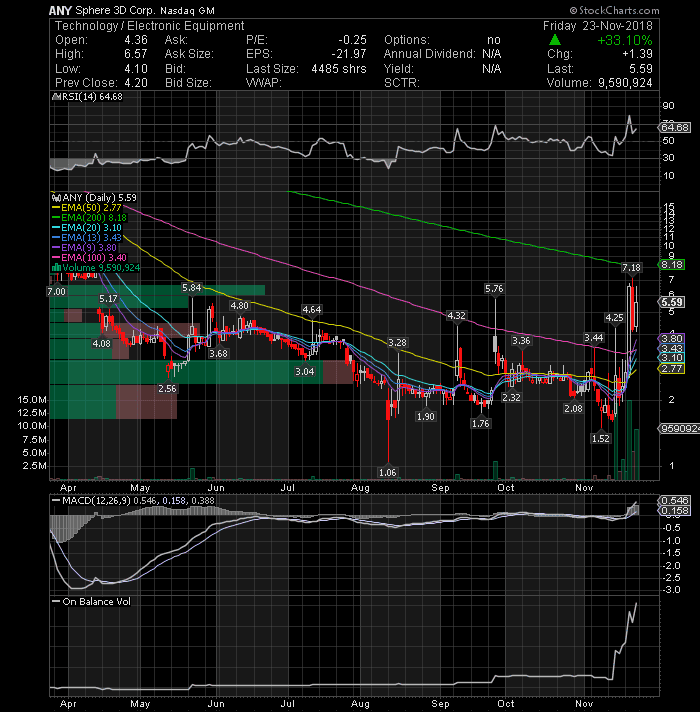
Sphere 3D Corp (NASDAQ: ANY) Technicals look suprisingly optimistic. The stock traded nicely last week with limited resistance allowing an increase to higher levels, and that is a good sign if you are looking for an opportunity to play the trend of an upward moving stock. The trading volume also remains high, which is always positive to see. Daily technical indicators are looking bullish. MACD is rising above its signal line, while RSI still in positive territory. Levels to watch next week. Resistance lies at 7.18 and support at 4.25
 ( click to enlarge )
DavidsTea Inc (NASDAQ: DTEA) is time to consider loading up now. Watch for the break of is descending trend line, and go long when it breaks on volume.
 ( click to enlarge )
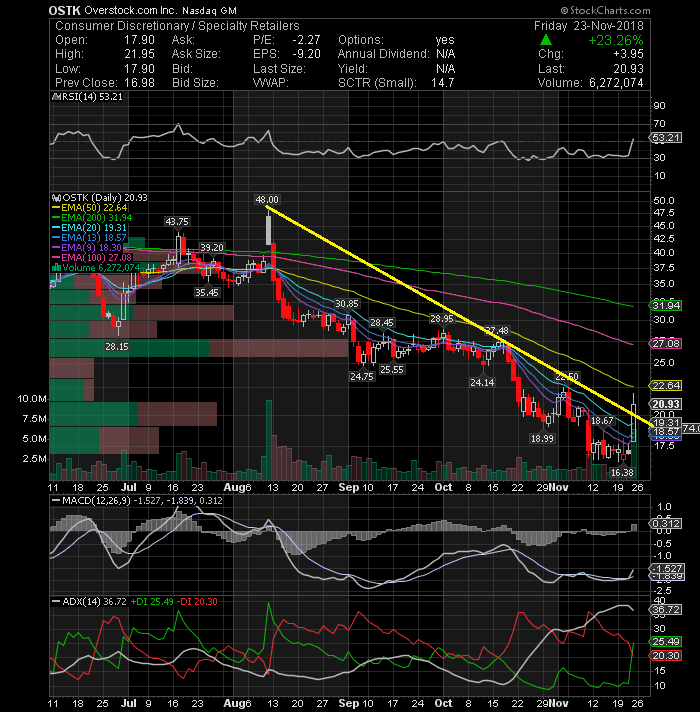
Overstock (NASDAQ: OSTK) gapped up Friday on positive news from the company and finished the session up nearly 24% on the heaviest volume since August. Watch next week for a break above the declining EMA50 located at 22.64, but don't be surprised if you see a break above the $24 level and a move towards the highs of October due to the heavy short interest.
 ( click to enlarge )
CorMedix Inc. (NYSEAMERICAN: CRMD) jumped 15 cents, or 12.6 Friday on solid volume. The strength of current momentum could extend next week and push the stock above the previous high set earlier this month at $1.54. If this breakout occurs we could see CRMD in the $1.60-$1.80 area in the next couple of trading days.
 ( click to enlarge )
Sesen Bio Inc (NASDAQ: SESN) had a nice surge a few weeks ago and has been in a correction mode. The stock is displaying upside momentum and is poised to move higher from these levels. Nearest resistance for the stock is at $1.9. If this level is crossed and the stock is able to sustain above this level, then it might go to $1.90. Short-term technical indicators are improving and MACD is about to trigger a buy signal while RSI is rising. Keep an eye on SESN next week.
 ( click to enlarge )
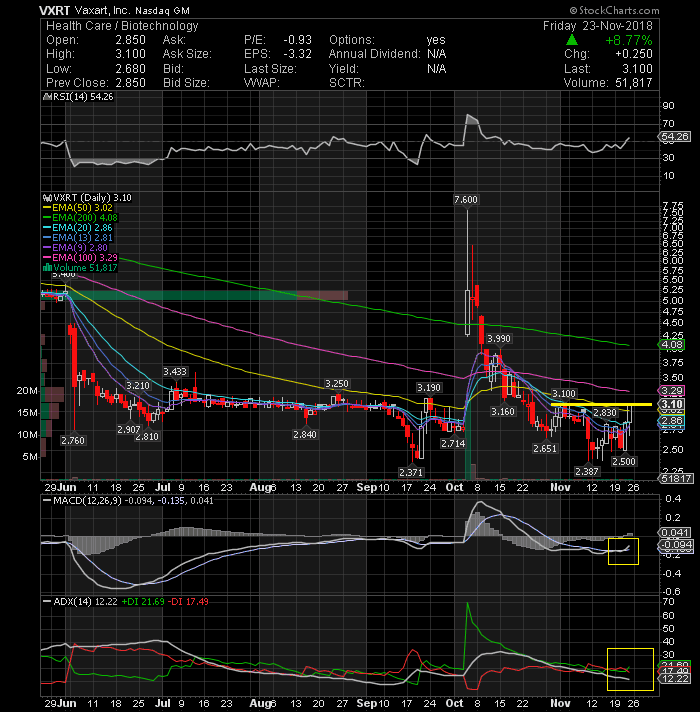
Vaxart Inc (NASDAQ: VXRT) is recovering quickly from its recent bottom with MACD moving upwards. It looks like it wants to breakout of this small range, but has not been able to gain the needed momentum. You should keep this stock on your screen radar.
 ( click to enlarge )
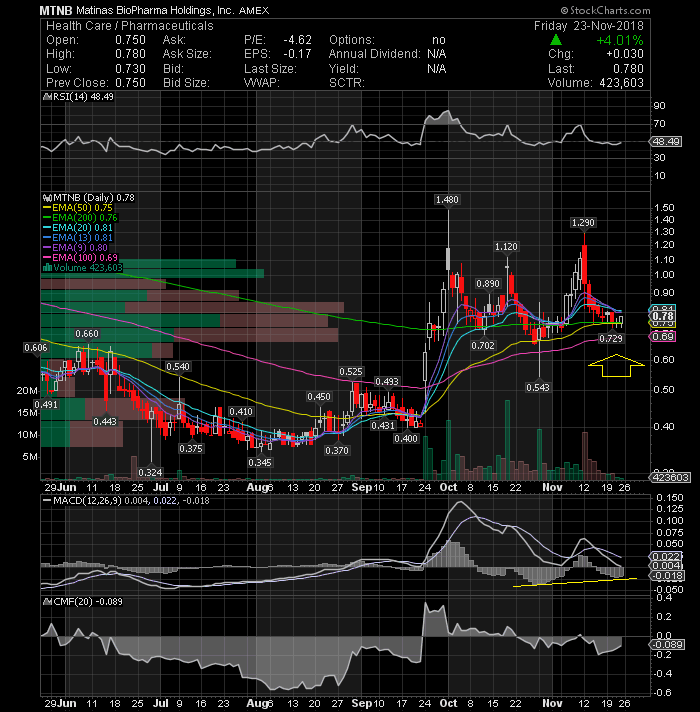
Matinas BioPharma Holdings Inc (NYSEAMERICAN: MTNB) has a very interesting daily chart and could have a bigger move soon. The break of the next key resistance line with heavy volume should be the next buy point . If it clears resistance at 80c, the move may be powerful. Despite recent decline, the daily RSI remains in the neutral zone and the golden cross has also appeared in the daily chart and may support the bullish argument here. Still on watch.
 ( click to enlarge )
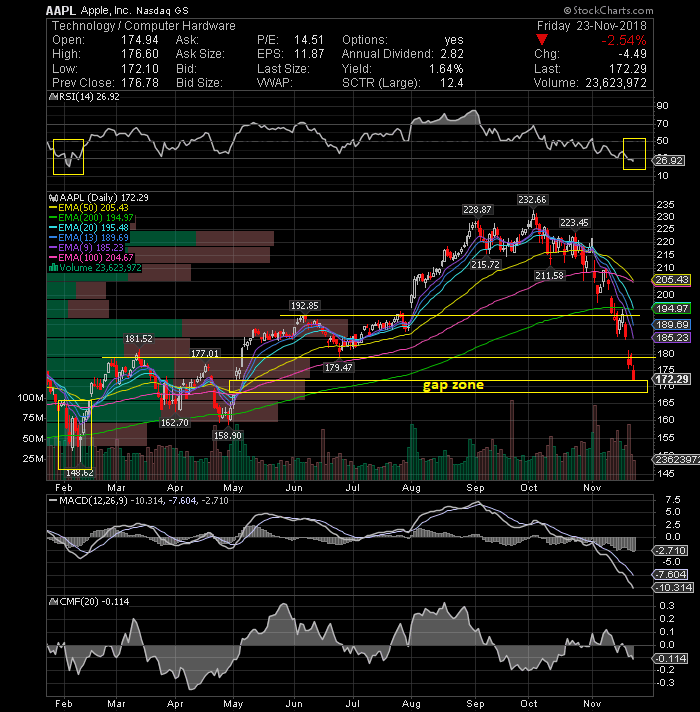
Apple Inc. (NASDAQ: AAPL) has corrected 11% in just 4 trading sessions last week breaking all major supports and now 170 and 168 are next major supports. There is also in this area a gap to fill, however and based on the history of the stock, every time it reaches very oversold levels the bounce is strong and fast and could happen very soon.
 ( click to enlarge )
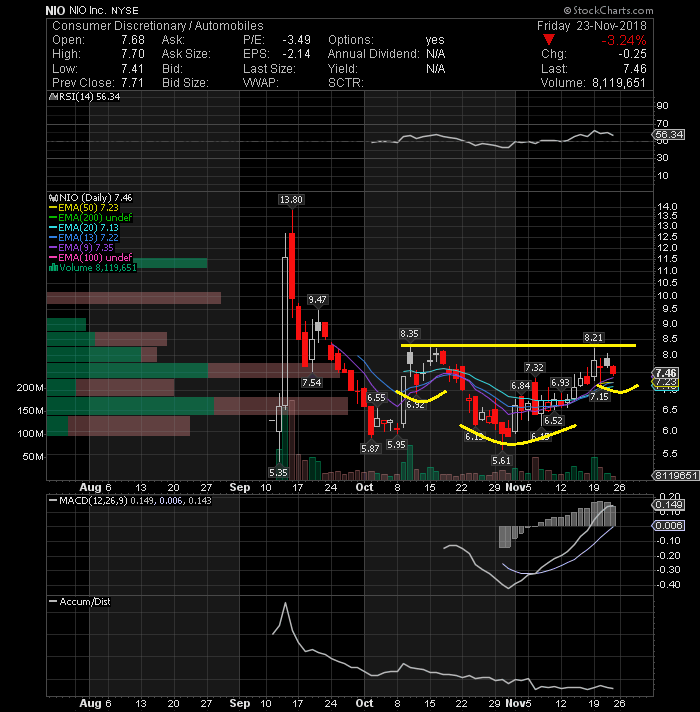
Nio Inc (NYSE: NIO) is displaying an inverted Head and Shoulders formation, which many traders consider a bullish reversal pattern. We need to breakthrough the neckline located at 8.3, before this pattern is complete. This could be a big clue as to where direction heads next. I would not be surprised to see the neckline to be broken soon. There are several technical indications suggesting that the stock could make a move to higher levels. Still on watch.
 ( click to enlarge )
Watch this downtrend line and play accordingly. Momentum indicators suggest continuation of positive bias for the stock. Lets keep an eye on it.
 ( click to enlarge )
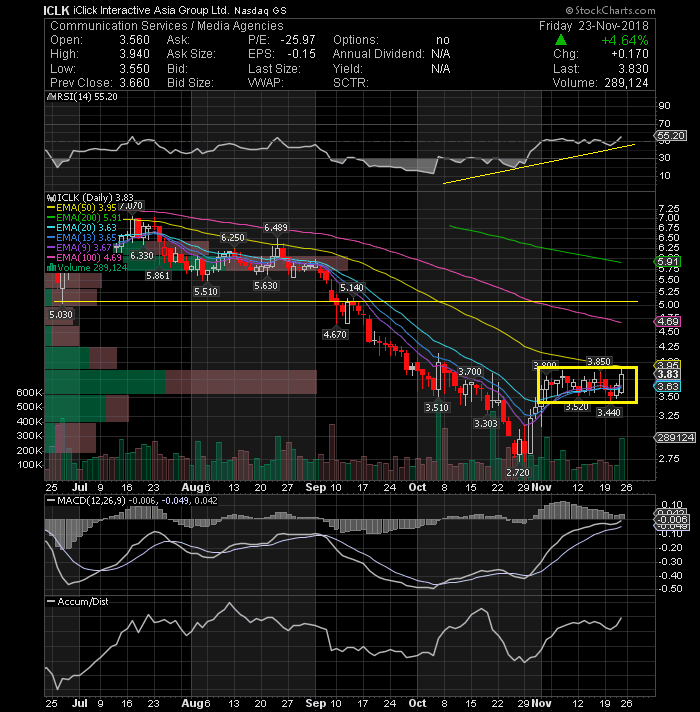
Iclick Interactive Asia Group Ltd (NASDAQ: ICLK) may be ready to break out of this potential bullish flag consolidation. Only a close above 3.95 would suggest further upside. Accumulation line is pointing up, which means it is under accumulation. The MACD is also moving higher. ICLK will move quickly, so keep it on your screen.
 ( click to enlarge )
Real Goods Solar, Inc. (NASDAQ: RGSE) nice breakout last week. Congrats to those who jumped into the game early around the 44c level when i alerted (unfortunately i sold too early at 55c) At this point, watch for trend continuation toward 70c zone short-term. The breakout of the small bullish pennant formation that the stock has been was a very positive sign, and I expect continuation of the trend in the coming days.
During the day I tweet many times to my readers. I encourage everybody to subscribe AC Investor Blog twitter and newsletter, so you can receive my trade ideas and stock news in real time.
Disclaimer : This is not an investment advisory, and should not be used to make investment decisions. Information in AC Investor Blog is often opinionated and should be considered for information purposes only. No stock exchange anywhere has approved or disapproved of the information contained herein. There is no express or implied solicitation to buy or sell securities. The charts provided here are not meant for investment purposes and only serve as technical examples. Don't consider buying or selling any stock without conducting your own due diligence.
Thanks for visiting AC Investor Blog.
AC
