We maintain several market timing models, each with differing time horizons. The "Ultimate Market Timing Model" is a long-term market timing model based on the research outlined in our post, Building the ultimate market timing model. This model tends to generate only a handful of signals each decade.
The Trend Asset Allocation Model is an asset allocation model which applies trend following principles based on the inputs of global stock and commodity price. This model has a shorter time horizon and tends to turn over about 4-6 times a year. In essence, it seeks to answer the question, "Is the trend in the global economy expansion (bullish) or contraction (bearish)?"
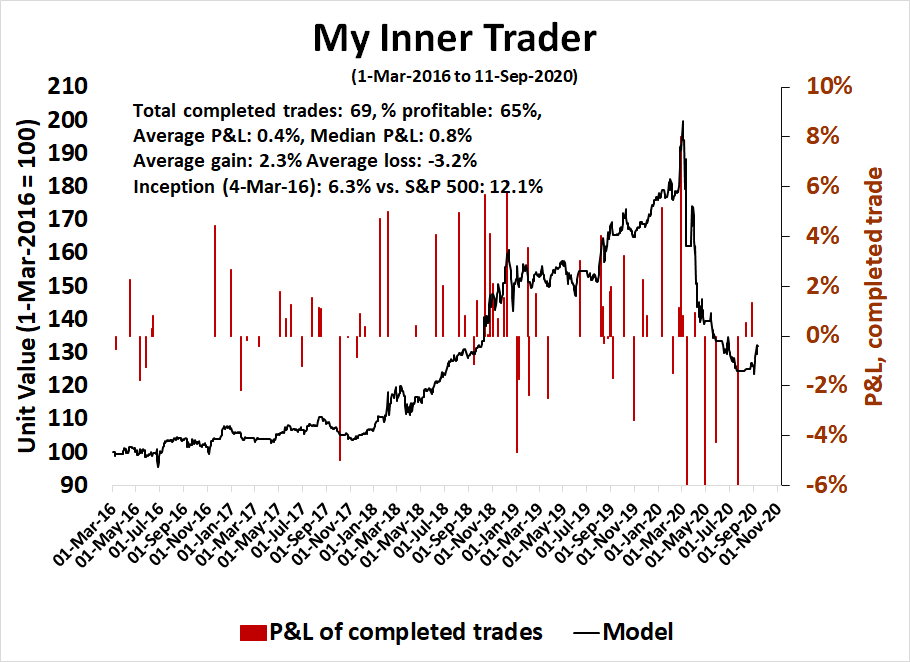
My inner trader uses a trading model, which is a blend of price momentum (is the Trend Model becoming more bullish, or bearish?) and overbought/oversold extremes (don't buy if the trend is overbought, and vice versa). Subscribers receive real-time alerts of model changes, and a hypothetical trading record of the those email alerts are updated weekly here. The hypothetical trading record of the trading model of the real-time alerts that began in March 2016 is shown below.
The latest signals of each model are as follows:
- Ultimate market timing model: Sell equities*
- Trend Model signal: Neutral*
- Trading model: Bearish*
Update schedule: I generally update model readings on my site on weekends and tweet mid-week observations at @humblestudent. Subscribers receive real-time alerts of trading model changes, and a hypothetical trading record of the those email alerts is shown here.
Subscribers can access the latest signal in real-time here.
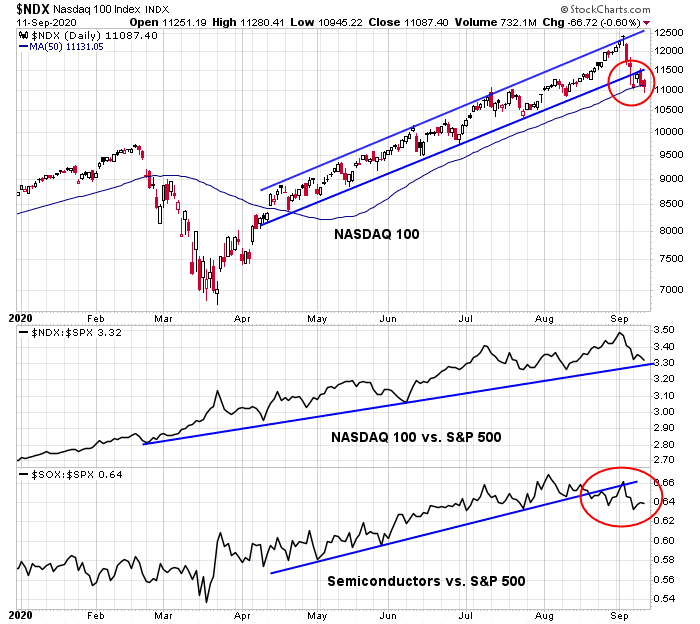
A sentiment buy signal?As last week's market action demonstrated, the bulls just can't seem to catch a break. Even though the market was short-term oversold, rally attempts have been rather anemic. More worrisome is the behavior of the NASDAQ 100 (NDX), which had been the market leadership. The NDX convincingly breached a rising channel, and it is now testing its 50 day moving average (dma). While its relative uptrend against the S&P 500 remains intact, the relative performance of semiconductor stocks, which had also been a source of technology related market strength, also violated a rising trend line.
 One bullish ray of hope came from Mark Hulbert, who pointed out that newsletter writer sentiment had plunged precipitously, which is contrarian bullish. Consider the average recommended equity exposure level among a subset of short-term stock-market timers that I monitor on a daily basis. (This is what’s measured by my Hulbert Stock Newsletter Sentiment Index, or HSNSI.) This average currently stands at 30.1%, which means that the average timer now has 70% of his equity trading portfolio out of the market.
 Just three weeks, ago, in contrast, the HSNSI stood at 65.9%. As you can see from the chart below, the HSNSI’s recent plunge rivals what happened during the February-March waterfall decline. That’s amazing, since the market’s early September sell-off — scary as it was — is child’s play by comparison. In contrast to a 34% plunge in the earlier downturn, the S&P 500 SPX, +0.05% from Sep. 2 to Sep. 8 lost less than 7%.
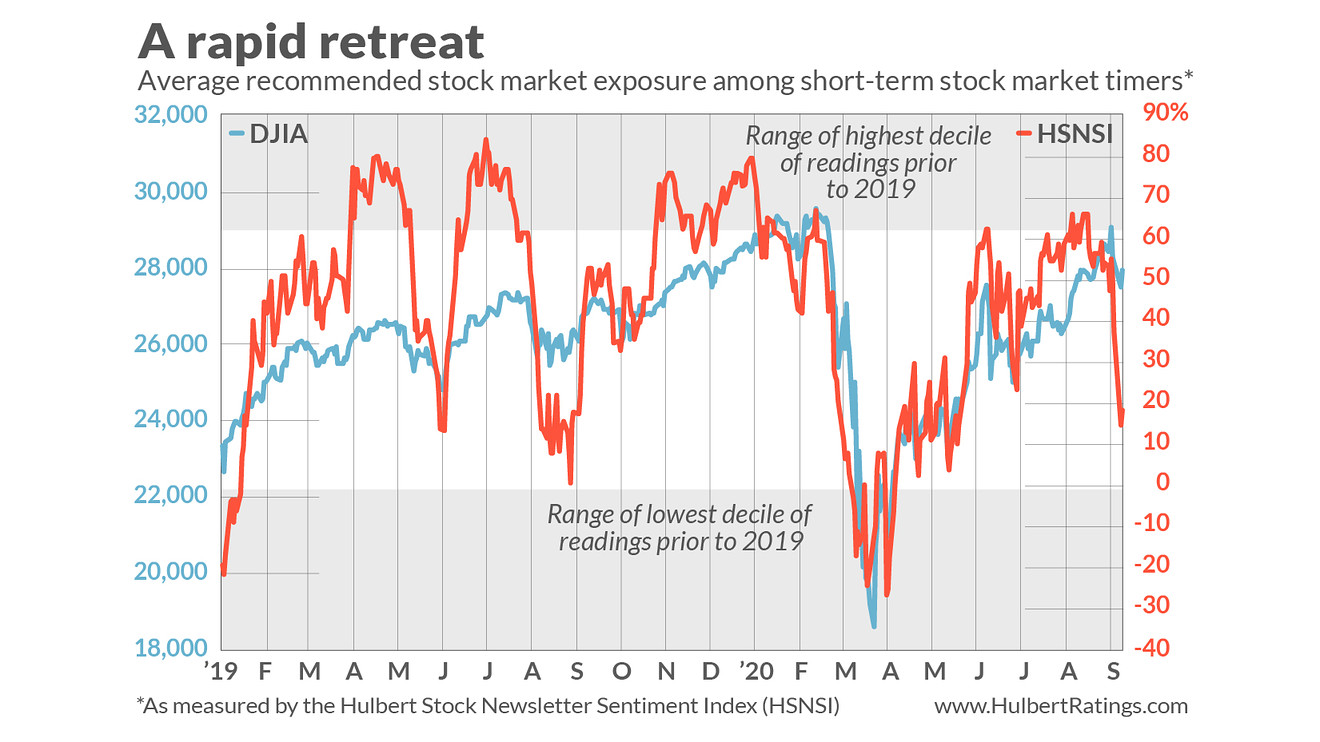
Hulbert concluded, "So long as the market timers on balance remain lukewarm about the stock market, sentiment for the next few weeks favors higher prices."
Could this be the reprieve that the bullish traders need?
The full post can be found here.
