 ( click to enlarge )
China Finance Online Co. (NASDAQ:JRJC) The daily technical chart shows a stock that is right on the cusp of a big breakout. If JRJC can break through the $11 price level (primary downtrend line) on volume, then I think the March highs at 16.70 could be well within reach. Yesterday, the volume was much higher than it has been the last few weeks. Interest in the stock is starting to grow and the China low float mania could send it again to $20's. Technical daily indicators are also pointing up. The ingredients are here for a nice move. Plus, let's not forget about the low float this stock has and the recent report of Morgan Stanely 5% stake. Keep her on your watch list the next few days. As always, I am not compensated for this post on my blog.
 ( click to enlarge )
U.S. Energy Corp (NASDAQ:USEG) has been trading in a bull flag formation above its all major EMAs. With the strong oil prices I think this stock has a good chance at trading higher going forward. I'm still liking and holding a long position.
 ( click to enlarge )
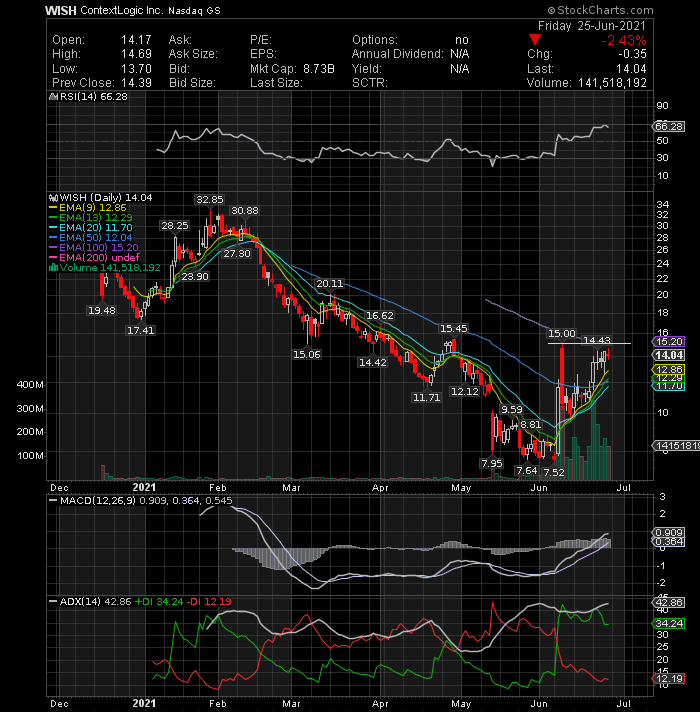
Wish (NASDAQ:WISH) A very bullish technical chart formation could mean shares are ready for another big breakout to the upside. Breakout watch $15
 ( click to enlarge )
Livexlive Media Inc (NASDAQ:LIVX) Friday's high volume could be the start of a new leg higher for this stock. I do think this $4.5 stock will bounce back over $5.70
 ( click to enlarge )
I really like Gaucho Group Holdings Inc (NASDAQ:VINO) for a sharp rebound over the next few trading days. This was a $9 stock less than 2 weeks ago and once it starts to squeeze higher there is really no telling exactly where it will go. I still feel a push to $9 - $10 is entirely possible.
 ( click to enlarge )
Sierra Oncology Inc (NASDAQ:SRRA) continued its bullish trend on Friday. The stock price is inching closer and closer to another breakout move. 20.43 is the level to watch for a breakout.
 ( click to enlarge )
Xeris Pharmaceuticals Inc (NASDAQ:XERS) It was mentioned last week as a potential breakout play and it did not disappoint us. The stock finally broke above the key resistance line of this sideways pattern yesterday on a move up 49 cents to $4.81. The volume was what we want to see when a stock breaks resistance. Let the 200-day EMA (yellow line) be your guide.
 ( click to enlarge )
Wunong Net Technology Co Ltd (NASDAQ:WNW) is gaining momentum. We have all seen how quickly this stock can head higher, when the buyers come. I believe it is ready to post a nice bounce and I do not see any resistance on the technical chart until $13.35
During the day I tweet many times to my readers. I encourage everybody to subscribe AC Investor Blog twitter and newsletter, so you can receive my trade ideas and stock news in real time.
Disclaimer : This is not an investment advisory, and should not be used to make investment decisions. Information in AC Investor Blog is often opinionated and should be considered for information purposes only. No stock exchange anywhere has approved or disapproved of the information contained herein. There is no express or implied solicitation to buy or sell securities. The charts provided here are not meant for investment purposes and only serve as technical examples. Don't consider buying or selling any stock without conducting your own due diligence.
Thanks for visiting AC Investor Blog.
AC
