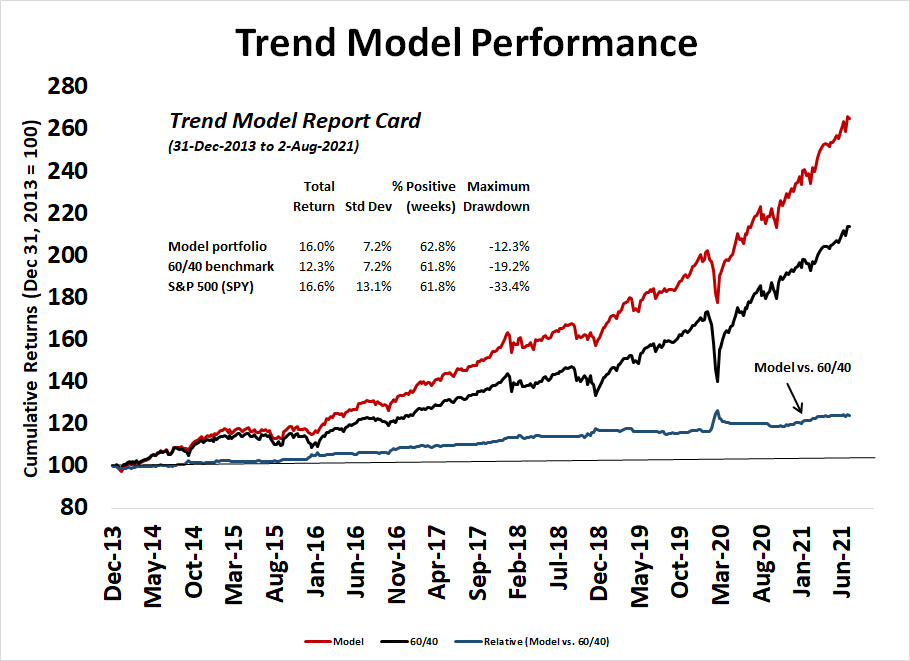
The Trend Asset Allocation Model is an asset allocation model that applies trend following principles based on the inputs of global stock and commodity price. This model has a shorter time horizon and tends to turn over about 4-6 times a year. The performance and full details of a model portfolio based on the out-of-sample signals of the Trend Model can be found here.
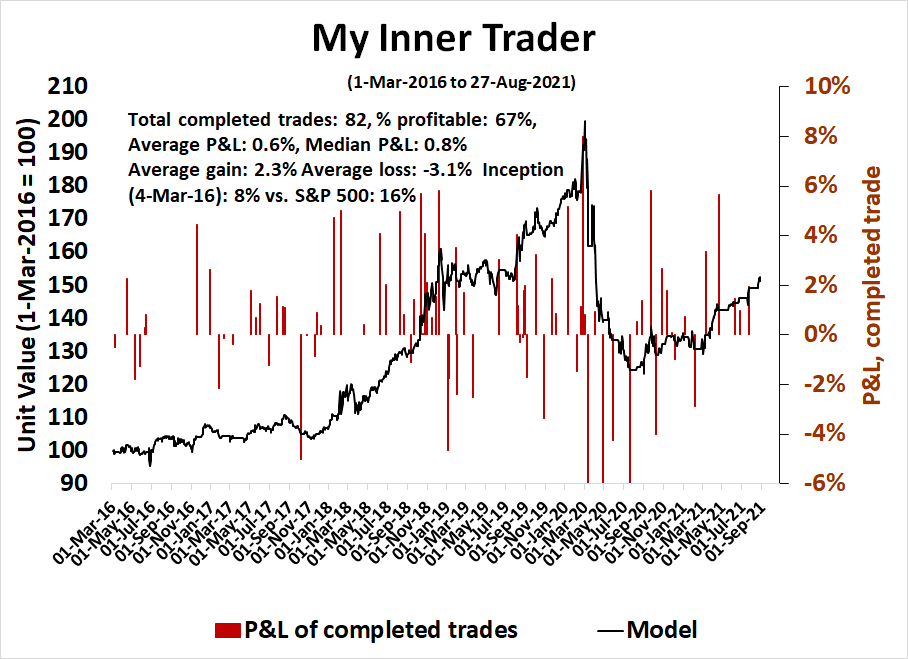
My inner trader uses a trading model, which is a blend of price momentum (is the Trend Model becoming more bullish, or bearish?) and overbought/oversold extremes (don't buy if the trend is overbought, and vice versa). Subscribers receive real-time alerts of model changes, and a hypothetical trading record of the email alerts is updated weekly here. The hypothetical trading record of the trading model of the real-time alerts that began in March 2016 is shown below.
The latest signals of each model are as follows:
- Ultimate market timing model: Buy equities*
- Trend Model signal: Bullish*
- Trading model: Bullish*
Update schedule: I generally update model readings on my site on weekends and tweet mid-week observations at @humblestudent. Subscribers receive real-time alerts of trading model changes, and a hypothetical trading record of those email alerts is shown here.
Subscribers can access the latest signal in real-time here.
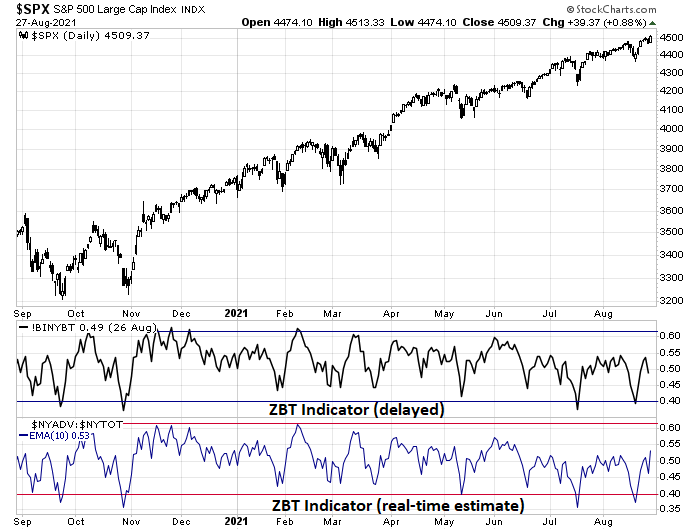
A possible ZBT buy signalThe Zweig Breadth Thrust buy signal is a rare momentum buy signal that only occurs once every few years. Steven Achelis at Metastock explains the indicator this way (emphasis added):A "Breadth Thrust" occurs when, during a 10-day period, the Breadth Thrust indicator rises from below 40% to above 61.5%. A "Thrust" indicates that the stock market has rapidly changed from an oversold condition to one of strength, but has not yet become overbought.
According to Dr. Zweig, there have only been [sixteen] Breadth Thrusts since 1945. The average gain following these fourteen Thrusts was 24.6% in an average time-frame of eleven months. Dr. Zweig also points out that most bull markets begin with a Breadth Thrust.The ZBT window began on Friday August 20, 2021. It has 10 trading days, or until September 2, 2021 to flash a ZBT buy signal.
Besides a possible ZBT buy signal as an indicator of powerful price momentum, here is what else I am watching.
The full post can be found here.
