

Newmont Mining Corporation (NYSE: NEM) (Newmont or the Company) reported gold reserves of 68.5 million ounces for 2016 compared to 71.1 million ounces for 2015.
This Smart News Release features multimedia. View the full release here: http://www.businesswire.com/news/home/20170221006620/en/

(Graphic: Business Wire)
The Company added 4.1 million ounces of gold reserves through exploration. Notable additions for the year include 1.4 million ounces at Tanami, 0.6 million ounces at Merian, 0.4 million ounces at Carlin underground and 0.4 million ounces at KCGM (Newmont’s 50 percent share). Overall gold reserve grades rose from the prior year to 1.20 grams per tonne.
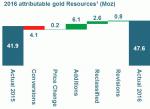
The Company added 6.1 million ounces of gold resource1 through exploration, including 2.0 million ounces of gold at Yanacocha and significant additions at higher grade underground mines including at Ahafo, Carlin and Tanami. Resource grades rose from the prior year to 0.86 grams per tonne.
Unless otherwise noted, all figures exclude PTNNT. The sale of Newmont’s 48.5 percent stake in PTNNT, which operates the Batu Hijau mine in Indonesia, closed on November 2, 2016.
Newmont reported 4.9 million ounces of attributable mine production in 2016, resulting in 6.0 million ounces of reserve depletion. Other changes to gold reserves include a reduction of 0.6 million ounces due to price change, primarily related to the impact of lower assumed copper reserve pricing at Phoenix. Reserve revisions were modest and mostly offsetting.
Newmont reported 33.6 million ounces of attributable Measured and Indicated gold resources and 14.0 million ounces attributable Inferred gold resources in 2016. Total attributable gold resources increased by 5.7 million ounces or nearly 14 percent from the prior year. The Company added 6.1 million ounces through exploration, partially offset by conversions of 4.1 million ounces.
Exploration Outlook
Newmont’s total exploration expenditure is expected to increase to more than $200 million2 in 2017, with about 80 percent allocated to near-mine and brownfields and the balance allocated to greenfields programs. Geographically, the Company expects to spend about 38 percent of this amount in North America, 35 percent in South America and the remainder in Australia, Africa and other locations.
_________________
| 1 | Resources include measured, indicated and inferred resources; totals may not add up due to rounding. See cautionary statement at end of release regarding reserves and resources. | |
| 2 | Includes capitalized and expensed exploration | |
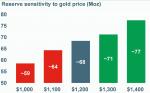
Gold Reserve Sensitivity
A $100 increase in gold price would result in an approximate 4 percent increase in gold reserves while a $100 decrease in gold price would result in an approximate 6 percent decrease in gold reserves. These sensitivities assume an oil price of $55 per barrel (WTI) and an Australian dollar exchange rate of $0.75.
For additional details on Newmont’s reported Gold, Copper and Silver Mineral Reserves and Resources, please refer to the tables at the end of this release.
Key Assumptions: | ||||||||||||
| Years Ended December 31, | ||||||||||||
2016 | 2015 | |||||||||||
| Gold Reserves (US$/oz) | $1,200 | $1,200 | ||||||||||
| Gold Resources (US$/oz) | $1,400 | $1,400 | ||||||||||
| Copper Reserves (US$/lb) | $2.50 | $2.75 | ||||||||||
| Copper Resources (US$/lb) | $3.00 | $3.50 | ||||||||||
| Australian Dollar (A$:US$) | $0.75 | $0.80 | ||||||||||
| West Texas Intermediate (US$/bbl) | $55 | $75 | ||||||||||
Reserve and Resource Tables
Proven and Probable reserves are based on extensive drilling, sampling, mine modeling and metallurgical testing from which we determine economic feasibility. Metal price assumptions follow SEC guidance not to exceed a three year trailing average. The price sensitivity of reserves depends upon several factors including grade, metallurgical recovery, operating cost, waste-to-ore ratio and ore type. Metallurgical recovery rates vary depending on the metallurgical properties of each deposit and the production process used. The reserve tables included in this release list the average metallurgical recovery rate for each deposit, which takes into account the assumed processing methods. The cut-off grade, or lowest grade of material considered economic to process, varies with material type, price, metallurgical recoveries, operating costs and co- or by-product credits. The Proven and Probable reserve figures presented herein are estimates based on information available at the time of calculation. No assurance can be given that the indicated levels of recovery of gold and copper will be realized. Ounces of gold and silver or pounds of copper included in the Proven and Probable reserves are those contained prior to losses during metallurgical treatment. Reserve estimates may require revision based on actual production. Market fluctuations in the price of gold or copper, as well as increased production costs or reduced metallurgical recovery rates, could render certain Proven and Probable reserves containing relatively lower grades of mineralization uneconomic to exploit and might result in a reduction of reserves.
The Measured, Indicated, and Inferred resource figures presented herein are estimates based on information available at the time of calculation and are exclusive of reserves. A “Mineral Resource” is a concentration or occurrence of solid material of economic interest in or on the Earth’s crust in such form, grade, or quality and quantity that there are reasonable prospects for eventual economic extraction. The location, quantity, grade or quality, continuity and other geological characteristics of a Mineral Resource are known, estimated or interpreted from specific geological evidence and knowledge, including sampling. Mineral Resources are sub-divided, in order of increasing geological confidence, into Inferred, Indicated and Measured categories. Ounces of gold and silver or pounds of copper included in the Measured, Indicated and Inferred resources are those contained prior to losses during metallurgical treatment. Market fluctuations in the price of gold and copper, as well as increased production costs or reduced metallurgical recovery rates, could change future estimates of resources. Please refer to the reserves and resources cautionary statement at the end of the release.
We publish reserves and resources annually, and will recalculate reserves and resources at year-end 2017, taking into account metal prices, changes, if any, in future production and capital costs, mine designs, model changes, divestments and depletion as well as any acquisitions and additions during 2017.
| Attributable Proven, Probable, and Combined Gold Reserves(1), U.S. Units | ||||||||||||||||||||||||||||||
| December 31, 2016 | December 31, 2015 | |||||||||||||||||||||||||||||
| Proven Reserves | Probable Reserves | Proven and Probable Reserves |
Metallurgical | Proven + Probable Reserves | ||||||||||||||||||||||||||
| Deposits/Districts by Reporting Unit | Newmont | Tonnage(2) | Grade | Gold(3) | Tonnage(2) | Grade | Gold(3) | Tonnage(2) | Grade | Gold(3) | Tonnage(2) | Grade | Gold(3) | |||||||||||||||||
Share(23) | (x1000 tons) | (oz/ton) | (x1000 ozs) | (x1000 tons) | (oz/ton) | (x1000 ozs) | (x1000 tons) | (oz/ton) | (x1000 ozs) | (x1000 tons) | (oz/ton) | (x1000 ozs) | ||||||||||||||||||
| North America | ||||||||||||||||||||||||||||||
| Carlin Open Pits (4) | 100 | % | 67,900 | 0.058 | 3,960 | 187,400 | 0.024 | 4,540 | 255,300 | 0.033 | 8,500 | 63 | % | 258,300 | 0.036 | 9,350 | ||||||||||||||
| Carlin Stockpiles (5) | 100 | % | 21,200 | 0.063 | 1,330 | - | - | - | 21,200 | 0.063 | 1,330 | 81 | % | 22,800 | 0.059 | 1,330 | ||||||||||||||
| Carlin Underground (6) | 100 | % | 12,000 | 0.299 | 3,580 | 6,600 | 0.240 | 1,590 | 18,600 | 0.278 | 5,170 | 85 | % | 23,000 | 0.266 | 6,100 | ||||||||||||||
| Total Carlin, Nevada | 101,100 | 0.088 | 8,870 | 194,000 | 0.032 | 6,130 | 295,100 | 0.051 | 15,000 | 72 | % | 304,100 | 0.055 | 16,780 | ||||||||||||||||
| Phoenix (7) | 100 | % | 4,800 | 0.025 | 120 | 251,800 | 0.017 | 4,220 | 256,600 | 0.017 | 4,340 | 76 | % | 291,500 | 0.017 | 5,100 | ||||||||||||||
| Lone Tree (8) | 100 | % | 2,600 | 0.007 | 20 | 1,200 | 0.020 | 20 | 3,800 | 0.011 | 40 | 57 | % | 3,700 | 0.007 | 30 | ||||||||||||||
| Total Phoenix, Nevada | 7,400 | 0.019 | 140 | 253,000 | 0.017 | 4,240 | 260,400 | 0.017 | 4,380 | 76 | % | 295,200 | 0.017 | 5,130 | ||||||||||||||||
| Turquoise Ridge (9) | 25 | % | 1,500 | 0.453 | 710 | 1,400 | 0.458 | 630 | 2,900 | 0.455 | 1,340 | 92 | % | 3,100 | 0.446 | 1,400 | ||||||||||||||
| Twin Creeks (10) | 100 | % | 3,700 | 0.046 | 180 | 26,200 | 0.054 | 1,410 | 29,900 | 0.053 | 1,590 | 77 | % | 32,100 | 0.054 | 1,740 | ||||||||||||||
| Twin Creeks Stockpiles (5) | 100 | % | 32,000 | 0.063 | 2,000 | - | - | - | 32,000 | 0.063 | 2,000 | 74 | % | 35,600 | 0.064 | 2,280 | ||||||||||||||
| Total Twin Creeks, Nevada | 37,200 | 0.078 | 2,890 | 27,600 | 0.074 | 2,040 | 64,800 | 0.076 | 4,930 | 80 | % | 70,800 | 0.077 | 5,420 | ||||||||||||||||
| Long Canyon, Nevada (11) | 100 | % | - | - | - | 19,200 | 0.061 | 1,170 | 19,200 | 0.061 | 1,170 | 76 | % | 18,000 | 0.067 | 1,200 | ||||||||||||||
| CC&V (12) | 100 | % | 72,500 | 0.022 | 1,560 | 17,900 | 0.017 | 310 | 90,400 | 0.021 | 1,870 | 62 | % | 100,800 | 0.024 | 2,440 | ||||||||||||||
| CC&V Leach Pad (13) | 100 | % | - | - | - | 48,500 | 0.025 | 1,210 | 48,500 | 0.025 | 1,210 | 57 | % | 46,000 | 0.025 | 1,160 | ||||||||||||||
| CC&V Stockpiles (5) | 100 | % | 2,800 | 0.112 | 310 | - | - | - | 2,800 | 0.112 | 310 | 70 | % | 2,700 | 0.084 | 230 | ||||||||||||||
| Total CC&V, Colorado | 75,300 | 0.025 | 1,870 | 66,400 | 0.023 | 1,520 | 141,700 | 0.024 | 3,390 | 61 | % | 149,500 | 0.026 | 3,830 | ||||||||||||||||
| TOTAL NORTH AMERICA | 221,000 | 0.062 | 13,770 | 560,200 | 0.027 | 15,100 | 781,200 | 0.037 | 28,870 | 73 | % | 837,600 | 0.039 | 32,360 | ||||||||||||||||
| South America | ||||||||||||||||||||||||||||||
Yanacocha Open Pits (14) | 51.35 | % | 17,900 | 0.018 | 310 | 81,400 | 0.018 | 1,500 | 99,300 | 0.018 | 1,810 | 69 | % | 113,200 | 0.017 | 1,940 | ||||||||||||||
Yanacocha Leach Pad (13) | 51.35 | % | 8,600 | 0.020 | 170 | - | - | - | 8,600 | 0.020 | 170 | 67 | % | 12,600 | 0.019 | 240 | ||||||||||||||
Yanacocha Stockpiles(5) | 51.35 | % | 5,800 | 0.044 | 260 | - | - | - | 5,800 | 0.044 | 260 | 63 | % | 7,800 | 0.052 | 410 | ||||||||||||||
Total Yanacocha, Peru | 32,300 | 0.023 | 740 | 81,400 | 0.018 | 1,500 | 113,700 | 0.020 | 2,240 | 69 | % | 133,600 | 0.019 | 2,590 | ||||||||||||||||
Merian, Suriname (15) | 75 | % | - | - | - | 116,800 | 0.037 | 4,290 | 116,800 | 0.037 | 4,290 | 93 | % | 110,600 | 0.035 | 3,840 | ||||||||||||||
| TOTAL SOUTH AMERICA | 32,300 | 0.023 | 740 | 198,200 | 0.029 | 5,790 | 230,500 | 0.028 | 6,530 | 85 | % | 244,200 | 0.026 | 6,430 | ||||||||||||||||
| Asia Pacific | ||||||||||||||||||||||||||||||
| Boddington Open Pit (16) | 100 | % | 226,400 | 0.022 | 5,020 | 241,200 | 0.022 | 5,280 | 467,600 | 0.022 | 10,300 | 84 | % | 511,700 | 0.020 | 10,450 | ||||||||||||||
| Boddington Stockpiles (5) | 100 | % | 15,800 | 0.016 | 250 | 83,800 | 0.013 | 1,090 | 99,600 | 0.013 | 1,340 | 77 | % | 93,400 | 0.014 | 1,280 | ||||||||||||||
| Total Boddington, Western Australia | 242,200 | 0.022 | 5,270 | 325,000 | 0.020 | 6,370 | 567,200 | 0.021 | 11,640 | 83 | % | 605,100 | 0.019 | 11,730 | ||||||||||||||||
| Tanami, Northern Territory (17) | 100 | % | 6,300 | 0.153 | 960 | 19,300 | 0.182 | 3,520 | 25,600 | 0.175 | 4,480 | 96 | % | 20,500 | 0.168 | 3,460 | ||||||||||||||
| Kalgoorlie Open Pit and Underground (18) | 50 | % | 9,800 | 0.060 | 580 | 30,400 | 0.064 | 1,950 | 40,200 | 0.063 | 2,530 | 84 | % | 45,200 | 0.059 | 2,650 | ||||||||||||||
| Kalgoorlie Stockpiles (5) | 50 | % | 70,100 | 0.023 | 1,610 | - | - | - | 70,100 | 0.023 | 1,610 | 76 | % | 66,000 | 0.023 | 1,500 | ||||||||||||||
| Total Kalgoorlie, Western Australia | 79,900 | 0.027 | 2,190 | 30,400 | 0.064 | 1,950 | 110,300 | 0.038 | 4,140 | 81 | % | 111,200 | 0.037 | 4,150 | ||||||||||||||||
| TOTAL ASIA PACIFIC | 328,400 | 0.026 | 8,420 | 374,700 | 0.032 | 11,840 | 703,100 | 0.029 | 20,260 | 86 | % | 736,800 | 0.026 | 19,340 | ||||||||||||||||
| Africa | ||||||||||||||||||||||||||||||
| Ahafo South Open Pits (19) | 100 | % | 13,900 | 0.066 | 920 | 50,600 | 0.051 | 2,580 | 64,500 | 0.054 | 3,500 | 90 | % | 72,800 | 0.054 | 3,950 | ||||||||||||||
| Ahafo Underground (20) | 100 | % | - | - | - | 11,700 | 0.131 | 1,530 | 11,700 | 0.131 | 1,530 | 94 | % | 9,300 | 0.143 | 1,330 | ||||||||||||||
| Ahafo Stockpiles (5) | 100 | % | 42,000 | 0.028 | 1,190 | - | - | - | 42,000 | 0.028 | 1,190 | 87 | % | 44,800 | 0.030 | 1,360 | ||||||||||||||
| Total Ahafo South, Ghana | 55,900 | 0.038 | 2,110 | 62,300 | 0.066 | 4,110 | 118,200 | 0.053 | 6,220 | 90 | % | 126,900 | 0.052 | 6,640 | ||||||||||||||||
| Ahafo North, Ghana (21) | 100 | % | - | - | - | 47,900 | 0.069 | 3,330 | 47,900 | 0.069 | 3,330 | 91 | % | 36,900 | 0.071 | 2,620 | ||||||||||||||
| Akyem Open Pit (22) | 100 | % | 17,200 | 0.049 | 840 | 43,500 | 0.047 | 2,040 | 60,700 | 0.047 | 2,880 | 89 | % | 67,100 | 0.049 | 3,260 | ||||||||||||||
| Akyem Stockpiles (5) | 100 | % | 10,800 | 0.035 | 370 | - | - | - | 10,800 | 0.035 | 370 | 89 | % | 10,000 | 0.040 | 400 | ||||||||||||||
| Total, Akyem, Ghana | 28,000 | 0.043 | 1,210 | 43,500 | 0.047 | 2,040 | 71,500 | 0.045 | 3,250 | 89 | % | 77,100 | 0.048 | 3,660 | ||||||||||||||||
| TOTAL AFRICA | 83,900 | 0.040 | 3,320 | 153,700 | 0.062 | 9,480 | 237,600 | 0.054 | 12,800 | 90 | % | 240,900 | 0.054 | 12,920 | ||||||||||||||||
| TOTAL NEWMONT CONTINUING OPERATIONS | 665,600 | 0.039 | 26,250 | 1,286,800 | 0.033 | 42,210 | 1,952,400 | 0.035 | 68,460 | 81 | % | 2,059,500 | 0.035 | 71,050 | ||||||||||||||||
| Batu Hijau Open Pit (23) | 48.5 | % | - | - | - | - | - | - | - | - | - | 0 | % | 134,500 | 0.015 | 2,030 | ||||||||||||||
| Batu Hijau Stockpiles (5)(23) | 48.5 | % | - | - | - | - | - | - | - | - | - | 0 | % | 184,800 | 0.003 | 640 | ||||||||||||||
| TOTAL NEWMONT WORLDWIDE | 665,600 | 0.039 | 26,250 | 1,286,800 | 0.033 | 42,210 | 1,952,400 | 0.035 | 68,460 | 81 | % | 2,378,800 | 0.031 | 73,720 | ||||||||||||||||
| (1) | See cautionary statement regarding reserves and resources at end of release hereof. 2016 reserves were calculated at a gold price of $1,200 or A$1,600 per ounce unless otherwise noted. 2015 reserves were calculated at a gold price of $1,200 or A$1,500 per ounce unless otherwise noted. | |
| (2) | Tonnages include allowances for losses resulting from mining methods. Tonnages are rounded to the nearest 100,000. | |
| (3) | Ounces are estimates of metal contained in ore tonnages and do not include allowances for processing losses. Metallurgical recovery rates represent the estimated amount of metal to be recovered through metallurgical extraction processes. Ounces are rounded to the nearest 10,000. | |
| (4) | Cut-off grades utilized in 2016 reserves were as follows: oxide leach material not less than 0.006 ounce per ton; oxide mill material not less than 0.015 ounce per ton; flotation material not less than 0.016 ounce per ton; and refractory mill material not less than 0.080 ounce per ton. | |
| (5) | Stockpiles are comprised primarily of material that has been set aside to allow processing of higher grade material in the mills. Stockpiles increase or decrease depending on current mine plans. Stockpile reserves are reported separately where ounces exceed 100,000 and are greater than 5% of the total site-reported reserves. | |
| (6) | Cut-off grade utilized in 2016 reserves not less than 0.044 ounce per ton. | |
| (7) | Gold cut-off grade varies with level of copper and silver credits. | |
| (8) | Cut-off grade utilized in 2016 reserves not less than 0.006 ounce per ton. | |
| (9) | Reserve estimates provided by Barrick, the operator of the Turquoise Ridge joint venture. | |
| (10) | Cut-off grades utilized in 2016 reserves were as follows: oxide leach material not less than 0.006 ounce per ton; oxide mill material not less than 0.015 ounce per ton; and refractory mill material not less than 0.034 ounce per ton. | |
| (11) | Cut-off grade utilized in 2016 reserves not less than 0.007 ounce per ton. | |
| (12) | Cut-off grades utilized in 2016 reserves were as follows: oxide mill material not less than 0.050 ounce per ton and leach material not less than 0.005 ounce per ton. | |
| (13) | Leach pad material is the material on leach pads at the end of the year from which gold remains to be recovered. In-process reserves are reported separately where ounces exceed 100,000 and are greater than 5% of the total site-reported reserves. | |
| (14) | Cut-off grades utilized in 2016 reserves were as follows: oxide leach material not less than 0.003 ounce per ton; and oxide mill material not less than 0.013 ounce per ton. | |
| (15) | Gold cut-off grades utilized in 2016 reserves not less than 0.011 ounce per ton. | |
| (16) | Gold cut-off grade varies with level of copper credits. | |
| (17) | Cut-off grade utilized in 2016 reserves not less than 0.070 ounce per ton. | |
| (18) | Cut-off grade utilized in 2016 insitu reserves not less than 0.026 ounce per ton. | |
| (19) | Cut-off grade utilized in 2016 reserves not less than 0.018 ounce per ton. | |
| (20) | Project is partially developed with ongoing studies being completed prior to a full-development decision. Cut-off grade utilized in 2016 reserves not less than 0.090 ounce per ton. | |
| (21) | Includes undeveloped reserves at six pits in the Ahafo trend totaling 3.3 million ounces. Cut-off grade utilized in 2016 reserves not less than 0.014 ounce per ton. | |
| (22) | Cut-off grade utilized in 2016 reserves not less than 0.017 ounce per ton. | |
| (23) | Newmont divested its interest in the Batu Hijau mine on November 2, 2016. As such, Newmont share percentage was zero as of December 31, 2016. The percentage figure above for Batu Hijau represent Newmont interest as of December 31, 2015 of 48.5%. | |
| (24) | Newmont share percentage reflects Newmont’s economic interest as of December 31, 2016 (other than Batu Hijau; see note 23 above). | |
| Attributable Proven, Probable, and Combined Gold Reserves(1), Metric Units | ||||||||||||||||||||||||||||||
| December 31, 2016 | December 31, 2015 | |||||||||||||||||||||||||||||
| Proven Reserves | Probable Reserves | Proven and Probable Reserves |
Metallurgical | Proven + Probable Reserves | ||||||||||||||||||||||||||
| Deposits/Districts by Reporting Unit | Newmont | Tonnage(2) | Grade | Gold(3) | Tonnage(2) | Grade | Gold(3) | Tonnage(2) | Grade | Gold(3) | Tonnage(2) | Grade | Gold(3) | |||||||||||||||||
Share(23) | (x1000 tonnes) | (g/tonne) | (x1000 ozs) | (x1000 tonnes) | (g/tonne) | (x1000 ozs) | (x1000 tonnes) | (g/tonne) | (x1000 ozs) | (x1000 tonnes) | (g/tonne) | (x1000 ozs) | ||||||||||||||||||
| North America | ||||||||||||||||||||||||||||||
| Carlin Open Pits | 100 | % | 61,600 | 2.00 | 3,960 | 170,000 | 0.83 | 4,540 | 231,600 | 1.14 | 8,500 | 63 | % | 234,300 | 1.24 | 9,350 | ||||||||||||||
| Carlin Stockpiles (5) | 100 | % | 19,200 | 2.14 | 1,330 | - | - | - | 19,200 | 2.14 | 1,330 | 81 | % | 20,700 | 2.01 | 1,330 | ||||||||||||||
| Carlin Underground | 100 | % | 10,900 | 10.25 | 3,580 | 6,000 | 8.24 | 1,590 | 16,900 | 9.53 | 5,170 | 85 | % | 20,800 | 9.10 | 6,100 | ||||||||||||||
| Total Carlin, Nevada | 91,700 | 3.01 | 8,870 | 176,000 | 1.08 | 6,130 | 267,700 | 1.74 | 15,000 | 72 | % | 275,800 | 1.89 | 16,780 | ||||||||||||||||
| Phoenix | 100 | % | 4,400 | 0.86 | 120 | 228,400 | 0.57 | 4,220 | 232,800 | 0.58 | 4,340 | 76 | % | 262,600 | 0.60 | 5,060 | ||||||||||||||
| Lone Tree | 100 | % | 2,300 | 0.25 | 20 | 1,100 | 0.68 | 20 | 3,400 | 0.39 | 40 | 57 | % | 5,100 | 0.38 | 70 | ||||||||||||||
| Total Phoenix, Nevada | 6,700 | 0.65 | 140 | 229,500 | 0.57 | 4,240 | 236,200 | 0.58 | 4,380 | 76 | % | 267,700 | 0.60 | 5,130 | ||||||||||||||||
| Turquoise Ridge (9) | 25 | % | 1,500 | 15.55 | 710 | 1,200 | 15.70 | 630 | 2,700 | 15.62 | 1,340 | 92 | % | 2,900 | 15.31 | 1,400 | ||||||||||||||
| Twin Creeks | 100 | % | 3,300 | 1.57 | 180 | 23,800 | 1.85 | 1,410 | 27,100 | 1.82 | 1,590 | 77 | % | 29,000 | 1.86 | 1,740 | ||||||||||||||
| Twin Creeks Stockpiles (5) | 100 | % | 29,000 | 2.15 | 2,000 | - | - | - | 29,000 | 2.15 | 2,000 | 74 | % | 32,300 | 2.19 | 2,280 | ||||||||||||||
| Total Twin Creeks, Nevada | 33,800 | 2.66 | 2,890 | 25,000 | 2.54 | 2,040 | 58,800 | 2.61 | 4,930 | 80 | % | 64,200 | 2.62 | 5,420 | ||||||||||||||||
| Long Canyon, Nevada | 100 | % | - | - | - | 17,500 | 2.09 | 1,170 | 17,500 | 2.09 | 1,170 | 76 | % | 16,300 | 2.28 | 1,200 | ||||||||||||||
| CC&V | 100 | % | 65,700 | 0.74 | 1,560 | 16,300 | 0.58 | 310 | 82,000 | 0.71 | 1,870 | 62 | % | 91,500 | 0.83 | 2,440 | ||||||||||||||
| CC&V Stockpiles (5) | 100 | % | 2,500 | 3.83 | 310 | - | - | - | 2,500 | 3.83 | 310 | 70 | % | 2,500 | 2.88 | 230 | ||||||||||||||
| CC&V Leach Pad (13) | 100 | % | - | - | - | 44,000 | 0.86 | 1,210 | 44,000 | 0.86 | 1,210 | 57 | % | 41,700 | 0.86 | 1,160 | ||||||||||||||
| Total CC&V, Colorado | 68,200 | 0.85 | 1,870 | 60,300 | 0.78 | 1,520 | 128,500 | 0.82 | 3,390 | 61 | % | 135,700 | 0.88 | 3,830 | ||||||||||||||||
| TOTAL NORTH AMERICA | 200,400 | 2.14 | 13,770 | 508,300 | 0.92 | 15,100 | 708,700 | 1.27 | 28,870 | 73 | % | 759,700 | 1.32 | 32,360 | ||||||||||||||||
| South America | ||||||||||||||||||||||||||||||
| Yanacocha Open Pits | 51.35 | % | 16,200 | 0.60 | 310 | 73,800 | 0.63 | 1,500 | 90,000 | 0.63 | 1,810 | 69 | % | 102,700 | 0.59 | 1,940 | ||||||||||||||
| Yanacocha Stockpiles (5) | 51.35 | % | 5,300 | 1.52 | 260 | - | - | - | 5,300 | 1.52 | 260 | 63 | % | 7,100 | 1.79 | 410 | ||||||||||||||
| Yanacocha Leach Pad (13) | 51.35 | % | 7,800 | 0.68 | 170 | - | - | - | 7,800 | 0.68 | 170 | 67 | % | 11,400 | 0.66 | 240 | ||||||||||||||
| Total Yanacocha, Peru | 29,300 | 0.79 | 740 | 73,800 | 0.63 | 1,500 | 103,100 | 0.68 | 2,240 | 69 | % | 121,200 | 0.67 | 2,590 | ||||||||||||||||
| Merian, Suriname | 75 | % | - | - | - | 106,000 | 1.26 | 4,290 | 106,000 | 1.26 | 4,290 | 93 | % | 100,300 | 1.19 | 3,840 | ||||||||||||||
| TOTAL SOUTH AMERICA | 29,300 | 0.79 | 740 | 179,800 | 1.00 | 5,790 | 209,100 | 0.97 | 6,530 | 85 | % | 221,500 | 0.90 | 6,430 | ||||||||||||||||
| Asia Pacific | ||||||||||||||||||||||||||||||
| Boddington Open Pit | 100 | % | 205,400 | 0.76 | 5,020 | 218,800 | 0.75 | 5,280 | 424,200 | 0.76 | 10,300 | 84 | % | 464,300 | 0.70 | 10,450 | ||||||||||||||
| Boddington Stockpiles (5) | 100 | % | 14,400 | 0.55 | 250 | 76,000 | 0.44 | 1,090 | 90,400 | 0.46 | 1,340 | 77 | % | 84,800 | 0.47 | 1,280 | ||||||||||||||
| Total Boddington, Western Australia | 219,800 | 0.75 | 5,270 | 294,800 | 0.67 | 6,370 | 514,600 | 0.70 | 11,640 | 83 | % | 549,100 | 0.66 | 11,730 | ||||||||||||||||
| Tanami, Northern Territory | 100 | % | 5,700 | 5.26 | 960 | 17,500 | 6.23 | 3,520 | 23,200 | 6.00 | 4,480 | 96 | % | 18,700 | 5.76 | 3,460 | ||||||||||||||
| Kalgoorlie Open Pit and Underground | 50 | % | 8,900 | 2.04 | 580 | 27,600 | 2.19 | 1,950 | 36,500 | 2.16 | 2,530 | 84 | % | 41,000 | 2.01 | 2,650 | ||||||||||||||
| Kalgoorlie Stockpiles (5) | 50 | % | 63,600 | 0.79 | 1,610 | - | - | - | 63,600 | 0.79 | 1,610 | 76 | % | 59,900 | 0.78 | 1,500 | ||||||||||||||
| Total Kalgoorlie, Western Australia | 72,500 | 0.94 | 2,190 | 27,600 | 2.19 | 1,950 | 100,100 | 1.29 | 4,140 | 81 | % | 100,900 | 1.28 | 4,150 | ||||||||||||||||
| TOTAL ASIA PACIFIC | 298,000 | 0.88 | 8,420 | 339,900 | 1.08 | 11,840 | 637,900 | 0.99 | 20,260 | 86 | % | 668,700 | 0.90 | 19,340 | ||||||||||||||||
| Africa | ||||||||||||||||||||||||||||||
| Ahafo South Open Pits | 100 | % | 12,600 | 2.25 | 920 | 45,900 | 1.75 | 2,580 | 58,500 | 1.86 | 3,500 | 90 | % | 66,100 | 1.86 | 3,950 | ||||||||||||||
| Ahafo Underground | 100 | % | - | - | - | 10,600 | 4.50 | 1,530 | 10,600 | 4.50 | 1,530 | 94 | % | 8,500 | 4.89 | 1,330 | ||||||||||||||
| Ahafo Stockpiles (5) | 100 | % | 38,100 | 0.97 | 1,190 | - | - | - | 38,100 | 0.97 | 1,190 | 87 | % | 40,600 | 1.04 | 1,360 | ||||||||||||||
| Total Ahafo South, Ghana | 50,700 | 1.29 | 2,110 | 56,500 | 2.27 | 4,110 | 107,200 | 1.80 | 6,220 | 90 | % | 115,200 | 1.79 | 6,640 | ||||||||||||||||
| Ahafo North, Ghana | 100 | % | - | - | - | 43,500 | 2.38 | 3,330 | 43,500 | 2.38 | 3,330 | 91 | % | 33,500 | 2.44 | 2,620 | ||||||||||||||
| Akyem Open Pit | 100 | % | 15,600 | 1.68 | 840 | 39,400 | 1.61 | 2,040 | 55,000 | 1.63 | 2,880 | 89 | % | 60,800 | 1.67 | 3,260 | ||||||||||||||
| Akyem Stockpiles (5) | 100 | % | 9,800 | 1.19 | 370 | - | - | - | 9,800 | 1.19 | 370 | 89 | % | 9,100 | 1.39 | 400 | ||||||||||||||
| Total, Akyem, Ghana | 25,400 | 1.49 | 1,210 | 39,400 | 1.61 | 2,040 | 64,800 | 1.56 | 3,250 | 89 | % | 69,900 | 1.63 | 3,660 | ||||||||||||||||
| TOTAL AFRICA | 76,100 | 1.36 | 3,320 | 139,400 | 2.12 | 9,480 | 215,500 | 1.85 | 12,800 | 90 | % | 218,600 | 1.84 | 12,920 | ||||||||||||||||
| TOTAL NEWMONT CONTINUING OPERATIONS | 603,800 | 1.35 | 26,250 | 1,167,400 | 1.12 | 42,210 | 1,771,200 | 1.20 | 68,460 | 81 | % | 1,868,500 | 1.18 | 71,050 | ||||||||||||||||
| Batu Hijau Open Pit (23) | 48.5 | % | - | - | - | - | - | - | - | - | - | 0 | % | 122,100 | 0.52 | 2,030 | ||||||||||||||
| Batu Hijau Stockpiles (5)(23) | 48.5 | % | - | - | - | - | - | - | - | - | - | 0 | % | 167,700 | 0.12 | 640 | ||||||||||||||
| TOTAL NEWMONT WORLDWIDE | 603,800 | 1.35 | 26,250 | 1,167,400 | 1.12 | 42,210 | 1,771,200 | 1.20 | 68,460 | 81 | % | 2,158,300 | 1.06 | 73,720 | ||||||||||||||||
See Footnotes under Gold Reserves U.S. units table. Note that cut off grades in such footnotes are represented in U.S. units
| Attributable Gold Mineral Resources(1)(2) - December 31, 2016, U.S. Units | |||||||||||||||||||||||||||
| Gold Measured Resource | Gold Indicated Resource | Gold Measured + Indicated Resource(3) | Gold Inferred Resource | ||||||||||||||||||||||||
| Deposits/Districts | Newmont Share | Tonnage | Grade | Au | Tonnage | Grade | Au | Tonnage | Grade | Au | Tonnage | Grade | Au | ||||||||||||||
| (x1000 tons) | (oz/ton) | (x1000 ozs) | (x1000 tons) | (oz/ton) | (x1000 ozs) | (x1000 tons) | (oz/ton) | (x1000 ozs) | (x1000 tons) | (oz/ton) | (x1000 ozs) | ||||||||||||||||
| North America | |||||||||||||||||||||||||||
| Carlin Trend Open Pit | 100 | % | 33,800 | 0.049 | 1,670 | 66,500 | 0.029 | 1,950 | 100,300 | 0.036 | 3,620 | 13,900 | 0.027 | 380 | |||||||||||||
| Carlin Trend Underground | 100 | % | 900 | 0.201 | 180 | 2,300 | 0.231 | 540 | 3,200 | 0.223 | 720 | 3,300 | 0.235 | 780 | |||||||||||||
| Total Carlin, Nevada | 34,700 | 0.053 | 1,850 | 68,800 | 0.036 | 2,490 | 103,500 | 0.042 | 4,340 | 17,200 | 0.067 | 1,160 | |||||||||||||||
| Phoenix | 100 | % | 700 | 0.015 | 10 | 177,400 | 0.014 | 2,410 | 178,100 | 0.014 | 2,420 | 58,500 | 0.012 | 680 | |||||||||||||
| Phoenix Stockpiles (4) | 100 | % | - | - | - | - | - | - | - | - | - | 2,300 | 0.043 | 100 | |||||||||||||
| Lone Tree Complex | 100 | % | - | - | - | - | - | - | - | - | - | - | - | - | |||||||||||||
| Buffalo Valley | 70 | % | - | - | - | 15,500 | 0.019 | 290 | 15,500 | 0.019 | 290 | 400 | 0.011 | - | |||||||||||||
| Total Phoenix, Nevada | 700 | 0.015 | 10 | 192,900 | 0.014 | 2,700 | 193,600 | 0.014 | 2,710 | 61,200 | 0.013 | 780 | |||||||||||||||
| Twin Creeks | 100 | % | 1,100 | 0.072 | 80 | 30,500 | 0.062 | 1,890 | 31,600 | 0.062 | 1,970 | 16,700 | 0.043 | 720 | |||||||||||||
| Twin Creeks Stockpiles (4) | 100 | % | 7,700 | 0.059 | 460 | - | - | - | 7,700 | 0.059 | 460 | - | - | - | |||||||||||||
| Sandman | 100 | % | - | - | - | 1,300 | 0.036 | 50 | 1,300 | 0.036 | 50 | 1,100 | 0.054 | 60 | |||||||||||||
| Turquoise Ridge (5) | 25 | % | 900 | 0.479 | 420 | 500 | 0.435 | 220 | 1,400 | 0.463 | 640 | 500 | 0.487 | 230 | |||||||||||||
| Total Twin Creeks, Nevada | 9,700 | 0.098 | 960 | 32,300 | 0.067 | 2,160 | 42,000 | 0.074 | 3,120 | 18,300 | 0.056 | 1,010 | |||||||||||||||
| Long Canyon, Nevada | 100 | % | 600 | 0.112 | 60 | 15,400 | 0.102 | 1,580 | 16,000 | 0.103 | 1,640 | 7,100 | 0.054 | 380 | |||||||||||||
| CC&V, Colorado | 100 | % | 84,000 | 0.018 | 1,470 | 43,200 | 0.016 | 710 | 127,200 | 0.017 | 2,180 | 23,700 | 0.015 | 350 | |||||||||||||
| TOTAL NORTH AMERICA | 129,700 | 0.034 | 4,350 | 352,600 | 0.027 | 9,640 | 482,300 | 0.029 | 13,990 | 127,500 | 0.029 | 3,680 | |||||||||||||||
| South America | |||||||||||||||||||||||||||
| Conga, Peru | 51.35 | % | - | - | - | 392,700 | 0.019 | 7,490 | 392,700 | 0.019 | 7,490 | 130,500 | 0.011 | 1,480 | |||||||||||||
| Yanacocha, Peru | 51.35 | % | 6,300 | 0.013 | 80 | 64,800 | 0.025 | 1,620 | 71,100 | 0.024 | 1,700 | 99,000 | 0.030 | 3,000 | |||||||||||||
| Merian, Suriname | 75 | % | 1,500 | 0.039 | 60 | 19,800 | 0.032 | 630 | 21,300 | 0.032 | 690 | 40,400 | 0.032 | 1,300 | |||||||||||||
| TOTAL SOUTH AMERICA | 7,800 | 0.018 | 140 | 477,300 | 0.020 | 9,740 | 485,100 | 0.020 | 9,880 | 269,900 | 0.021 | 5,780 | |||||||||||||||
| Asia Pacific | |||||||||||||||||||||||||||
| Boddington, Western Australia | 100 | % | 119,700 | 0.014 | 1,690 | 270,700 | 0.015 | 4,140 | 390,400 | 0.015 | 5,830 | 8,300 | 0.017 | 140 | |||||||||||||
| Tanami, Northern Territory | 100 | % | - | 0.039 | - | 2,800 | 0.161 | 460 | 2,800 | 0.161 | 460 | 3,500 | 0.171 | 610 | |||||||||||||
| Kalgoorlie, Western Australia | 50 | % | 3,500 | 0.020 | 70 | 12,100 | 0.028 | 330 | 15,600 | 0.026 | 400 | 600 | 0.072 | 40 | |||||||||||||
| TOTAL ASIA PACIFIC | 123,200 | 0.014 | 1,760 | 285,600 | 0.017 | 4,930 | 408,800 | 0.016 | 6,690 | 12,400 | 0.064 | 790 | |||||||||||||||
| Africa | |||||||||||||||||||||||||||
| Ahafo | 100 | % | 1,200 | 0.017 | 20 | 32,200 | 0.035 | 1,140 | 33,400 | 0.035 | 1,160 | 16,900 | 0.047 | 790 | |||||||||||||
| Ahafo Underground | 100 | % | - | - | - | 8,600 | 0.124 | 1,070 | 8,600 | 0.124 | 1,070 | 13,900 | 0.114 | 1,580 | |||||||||||||
| Total Ahafo, Ghana | 1,200 | 0.017 | 20 | 40,800 | 0.054 | 2,210 | 42,000 | 0.053 | 2,230 | 30,800 | 0.077 | 2,370 | |||||||||||||||
| Ahafo North, Ghana | 100 | % | 2,600 | 0.034 | 90 | 7,800 | 0.050 | 390 | 10,400 | 0.046 | 480 | 11,100 | 0.052 | 570 | |||||||||||||
| Akyem, Ghana | 100 | % | 1,100 | 0.047 | 50 | 9,200 | 0.033 | 300 | 10,300 | 0.034 | 350 | 18,100 | 0.044 | 810 | |||||||||||||
| TOTAL AFRICA | 4,900 | 0.032 | 160 | 57,800 | 0.050 | 2,900 | 62,700 | 0.049 | 3,060 | 60,000 | 0.062 | 3,750 | |||||||||||||||
| TOTAL NEWMONT WORLDWIDE | 265,600 | 0.024 | 6,410 | 1,173,300 | 0.023 | 27,210 | 1,438,900 | 0.023 | 33,620 | 469,800 | 0.030 | 14,000 | |||||||||||||||
| (1) | Resources are reported exclusive of reserves. | |
| (2) | Resources are calculated at a gold price of $1,400 or A$1,750 per ounce for 2016 and $1,400 or A$1,650 per ounce for 2015. Tonnage amounts have been rounded to the nearest 100,000, and ounces have been rounded to the nearest 10,000. | |
| (3) | Measured and Indicated Resources (combined) are equivalent to Mineralized Material disclosed in Newmont’s 10-K filing. | |
| (4) | Stockpiles are comprised primarily of mineralized material that has been set aside during mining activities. Stockpiles can increase or decrease depending on changes in metal prices and other mining and processing cost and recovery factors. Stockpile reserves are reported separately where tonnage exceeds 100,000 and is greater than 5% of the total site-reported resources. | |
| (5) | Resource estimates provided by Barrick, the operator of the Turquoise Ridge Joint Venture. | |
| Attributable Gold Mineral Resources(1)(2) - December 31, 2016, Metric units | |||||||||||||||||||||||||||
| Gold Measured Resource | Gold Indicated Resource | Gold Measured + Indicated Resource(3) | Gold Inferred Resource | ||||||||||||||||||||||||
| Deposits/Districts | Newmont Share | Tonnage | Grade | Au | Tonnage | Grade | Au | Tonnage | Grade | Au | Tonnage | Grade | Au | ||||||||||||||
| (x1000 tonnes) | (g/tonne) | (x1000 ozs) | (x1000 tonnes) | (g/tonne) | (x1000 ozs) | (x1000 tonnes) | (g/tonne) | (x1000 ozs) | (x1000 tonnes) | (g/tonne) | (x1000 ozs) | ||||||||||||||||
| North America | |||||||||||||||||||||||||||
| Carlin Trend Open Pit | 100 | % | 30,700 | 1.69 | 1,670 | 60,300 | 1.01 | 1,950 | 91,000 | 1.24 | 3,620 | 12,600 | 0.93 | 380 | |||||||||||||
| Carlin Trend Underground | 100 | % | 800 | 6.90 | 180 | 2,100 | 7.93 | 540 | 2,900 | 7.64 | 720 | 3,000 | 8.05 | 780 | |||||||||||||
| Total Carlin, Nevada | 31,500 | 1.82 | 1,850 | 62,400 | 1.24 | 2,490 | 93,900 | 1.44 | 4,340 | 15,600 | 2.29 | 1,160 | |||||||||||||||
| Phoenix | 100 | % | 700 | 0.52 | 10 | 160,900 | 0.47 | 2,410 | 161,600 | 0.47 | 2,420 | 53,000 | 0.39 | 680 | |||||||||||||
| Phoenix Stockpiles (4) | 100 | % | - | - | - | - | - | - | - | - | - | 2,100 | 1.48 | 100 | |||||||||||||
| Lone Tree Complex | 100 | % | - | - | - | - | - | - | - | - | - | - | - | - | |||||||||||||
| Buffalo Valley | 70 | % | - | - | - | 14,100 | 0.65 | 290 | 14,100 | 0.65 | 290 | 400 | 0.38 | - | |||||||||||||
| Total Phoenix, Nevada | 700 | 0.52 | 10 | 175,000 | 0.48 | 2,700 | 175,700 | 0.48 | 2,710 | 55,500 | 0.44 | 780 | |||||||||||||||
| Twin Creeks | 100 | % | 1,000 | 2.48 | 80 | 27,600 | 2.12 | 1,890 | 28,600 | 2.14 | 1,970 | 15,100 | 1.49 | 720 | |||||||||||||
| Twin Creeks Stockpiles (4) | 100 | % | 7,000 | 2.02 | 460 | - | - | - | 7,000 | 2.02 | 460 | - | - | - | |||||||||||||
| Sandman | 100 | % | - | - | - | 1,200 | 1.23 | 50 | 1,200 | 1.23 | 50 | 1,000 | 1.85 | 60 | |||||||||||||
| Turquoise Ridge (5) | 25 | % | 800 | 16.43 | 420 | 500 | 14.90 | 220 | 1,300 | 15.86 | 640 | 400 | 16.68 | 230 | |||||||||||||
| Total Twin Creeks, Nevada | 8,800 | 3.37 | 960 | 29,300 | 2.29 | 2,160 | 38,100 | 2.54 | 3,120 | 16,500 | 1.91 | 1,010 | |||||||||||||||
| Long Canyon, Nevada | 100 | % | 500 | 3.84 | 60 | 14,000 | 3.50 | 1,580 | 14,500 | 3.52 | 1,640 | 6,400 | 1.86 | 380 | |||||||||||||
| CC&V,Colorado | 100 | % | 76,100 | 0.60 | 1,470 | 39,200 | 0.56 | 710 | 115,300 | 0.59 | 2,180 | 21,600 | 0.50 | 350 | |||||||||||||
| TOTAL NORTH AMERICA | 117,600 | 1.15 | 4,350 | 319,900 | 0.94 | 9,640 | 437,500 | 0.99 | 13,990 | 115,600 | 0.99 | 3,680 | |||||||||||||||
| South America | |||||||||||||||||||||||||||
| Conga, Peru | 51.35 | % | - | - | - | 356,300 | 0.65 | 7,490 | 356,300 | 0.65 | 7,490 | 118,400 | 0.39 | 1,480 | |||||||||||||
| Yanacocha, Peru | 51.35 | % | 5,700 | 0.45 | 80 | 58,800 | 0.86 | 1,620 | 64,500 | 0.82 | 1,700 | 89,800 | 1.04 | 3,000 | |||||||||||||
| Merian, Suriname | 75 | % | 1,400 | 1.34 | 60 | 17,900 | 1.09 | 630 | 19,300 | 1.11 | 690 | 36,700 | 1.10 | 1,300 | |||||||||||||
| TOTAL SOUTH AMERICA | 7,100 | 0.62 | 140 | 433,000 | 0.70 | 9,740 | 440,100 | 0.70 | 9,880 | 244,900 | 0.73 | 5,780 | |||||||||||||||
| Asia Pacific | |||||||||||||||||||||||||||
| Boddington, Western Australia | 100 | % | 108,700 | 0.48 | 1,690 | 245,500 | 0.53 | 4,140 | 354,200 | 0.51 | 5,830 | 7,500 | 0.58 | 140 | |||||||||||||
| Tanami, Northern Territory | 100 | % | - | 1.32 | - | 2,600 | 5.53 | 460 | 2,600 | 5.53 | 460 | 3,200 | 5.85 | 610 | |||||||||||||
| Kalgoorlie, Western Australia | 50 | % | 3,100 | 0.67 | 70 | 11,000 | 0.95 | 330 | 14,100 | 0.89 | 400 | 600 | 2.47 | 40 | |||||||||||||
| TOTAL ASIA PACIFIC | 111,800 | 0.49 | 1,760 | 259,100 | 0.59 | 4,930 | 370,900 | 0.56 | 6,690 | 11,300 | 2.18 | 790 | |||||||||||||||
| Africa | |||||||||||||||||||||||||||
| Ahafo | 100 | % | 1,200 | 0.59 | 20 | 29,200 | 1.22 | 1,140 | 30,400 | 1.19 | 1,160 | 15,300 | 1.60 | 790 | |||||||||||||
| Ahafo Underground | 100 | % | - | - | - | 7,800 | 4.26 | 1,070 | 7,800 | 4.26 | 1,070 | 12,600 | 3.90 | 1,580 | |||||||||||||
| Total Ahafo, Ghana | 1,200 | 0.59 | 20 | 37,000 | 1.86 | 2,210 | 38,200 | 1.82 | 2,230 | 27,900 | 2.64 | 2,370 | |||||||||||||||
| Ahafo North, Ghana | 100 | % | 2,300 | 1.16 | 90 | 7,100 | 1.73 | 390 | 9,400 | 1.59 | 480 | 10,000 | 1.78 | 570 | |||||||||||||
| Akyem, Ghana | 100 | % | 1,000 | 1.61 | 50 | 8,300 | 1.12 | 300 | 9,300 | 1.17 | 350 | 16,500 | 1.52 | 810 | |||||||||||||
| TOTAL AFRICA | 4,500 | 1.11 | 160 | 52,400 | 1.72 | 2,900 | 56,900 | 1.68 | 3,060 | 54,400 | 2.14 | 3,750 | |||||||||||||||
| TOTAL NEWMONT WORLDWIDE | 241,000 | 0.83 | 6,410 | 1,064,400 | 0.80 | 27,210 | 1,305,400 | 0.80 | 33,620 | 426,200 | 1.02 | 14,000 | |||||||||||||||
See footnotes in Gold Resources U.S. units table.
| Attributable Copper Reserves(1) U.S. Units | ||||||||||||||||||||||||||||||||||
| December 31, 2016 | December 31, 2015 | |||||||||||||||||||||||||||||||||
| Proven Reserves | Probable Reserves | Proven + Probable Reserves | Proven + Probable Reserve | |||||||||||||||||||||||||||||||
| Deposits/Districts | Newmont Share | Tonnage(2) | Grade | Copper(3) | Tonnage(2) | Grade | Copper(3) | Tonnage(2) | Grade | Copper(3) | Metallurgical | Tonnage (2) | Grade | Copper (3) | ||||||||||||||||||||
| (x1000 tons) | (Cu%) | (million pounds) | (x1000 tons) | (Cu%) | (million pounds) | (x1000 tons) | (Cu%) | (million pounds) | Recovery(3) | (x1000 tons) | (Cu%) | (million pounds) | ||||||||||||||||||||||
| North America | ||||||||||||||||||||||||||||||||||
| Phoenix, Nevada (4) | 100 | % | 19,100 | 0.21 | % | 80 | 376,400 | 0.16 | % | 1,180 | 395,500 | 0.16 | % | 1,260 | 62 | % | 527,400 | 0.17 | % | 1,750 | ||||||||||||||
| TOTAL NORTH AMERICA | 19,100 | 0.21 | % | 80 | 376,400 | 0.16 | % | 1,180 | 395,500 | 0.16 | % | 1,260 | 62 | % | 527,400 | 0.17 | % | 1,750 | ||||||||||||||||
| Asia Pacific | ||||||||||||||||||||||||||||||||||
| Boddington Open Pit, Western Australia (5) | 100 | % | 226,400 | 0.11 | % | 480 | 241,200 | 0.12 | % | 580 | 467,600 | 0.11 | % | 1,060 | 79 | % | 511,700 | 0.11 | % | 1,160 | ||||||||||||||
| Boddington Stockpiles, Western Australia(6) | 100 | % | 15,800 | 0.09 | % | 30 | 83,800 | 0.08 | % | 140 | 99,600 | 0.09 | % | 170 | 72 | % | 93,400 | 0.08 | % | 150 | ||||||||||||||
| TOTAL ASIA PACIFIC | 242,200 | 0.10 | % | 510 | 325,000 | 0.11 | % | 720 | 567,200 | 0.11 | % | 1,230 | 78 | % | 605,100 | 0.11 | % | 1,310 | ||||||||||||||||
| TOTAL NEWMONT CONTINUING OPERATIONS | 261,300 | 0.11 | % | 590 | 701,400 | 0.14 | % | 1,900 | 962,700 | 0.13 | % | 2,490 | 70 | % | 1,132,500 | 0.14 | % | 3,060 | ||||||||||||||||
| Batu Hijau Open Pit, Indonesia(7) | 48.5 | % | - | 0.00 | % | - | - | 0.00 | % | - | - | 0.00 | % | - | 0 | % | 134,500 | 0.50 | % | 1,340 | ||||||||||||||
| Batu Hijau Stockpiles, Indonesia (6)(7) | 48.5 | % | - | 0.00 | % | - | - | 0.00 | % | - | - | 0.00 | % | - | 0 | % | 184,800 | 0.34 | % | 1,270 | ||||||||||||||
| TOTAL NEWMONT WORLDWIDE | 261,300 | 0.11 | % | 590 | 701,400 | 0.14 | % | 1,900 | 962,700 | 0.13 | % | 2,490 | 70 | % | 1,451,800 | 0.20 | % | 5,670 | ||||||||||||||||
(1) | See footnote (1) to the Gold Reserves table above. Copper reserves for 2016 were calculated at a copper price of $2.50 or A$3.35 per pound. Copper reserves for 2015 were calculated at a copper price of $2.75 or A$3.45 per pound unless otherwise noted. | |
(2) | See footnote (2) to the Gold Reserves table above. Tonnages are rounded to nearest 100,000. | |
(3) | See footnote (3) to the Gold Reserves table above. Pounds are rounded to the nearest 10 million. | |
(4) | Copper cut-off grade varies with level of gold and silver credits. | |
(5) | Copper cut-off grade varies with level of gold credits. | |
(6) | Stockpiles are comprised primarily of material that has been set aside to allow processing of higher grade material in the mills. Stockpiles increase or decrease depending on current mine plans. Stockpiles are reported separately where pounds exceed 100 million and are greater than 5% of the total site reported reserves. | |
(7) | Newmont divested its interest in the Batu Hijau mine on November 2, 2016. As such, Newmont share percentage was zero as of December 31, 2016. The percentage figure above for Batu Hijau represents Newmont interest as of December 31, 2015 of 48.5%. | |
| Attributable Copper Reserves(1) Metric Units | ||||||||||||||||||||||||||||||||||
| December 31, 2016 | December 31, 2015 | |||||||||||||||||||||||||||||||||
| Proven Reserves | Probable Reserves | Proven + Probable Reserves | Proven + Probable Reserve | |||||||||||||||||||||||||||||||
| Deposits/Districts | Newmont Share | Tonnage(2) | Grade | Copper(3) | Tonnage(2) | Grade | Copper(3) | Tonnage(2) | Grade | Copper(3) | Metallurgical | Tonnage(2) | Grade | Copper(3) | ||||||||||||||||||||
| (x1000 tonnes) | (Cu%) | (Tonnes) | (x1000 tonnes) | (Cu%) | (Tonnes) | (x1000 tonnes) | (Cu%) | (Tonnes) | Recovery | (x1000 tonnes) | (Cu%) | (Tonnes) | ||||||||||||||||||||||
| North America | ||||||||||||||||||||||||||||||||||
| Phoenix, Nevada | 100 | % | 17,200 | 0.21 | % | 36,980 | 341,500 | 0.16 | % | 535,480 | 358,700 | 0.16 | % | 572,460 | 62 | % | 478,400 | 0.17 | % | 796,480 | ||||||||||||||
| TOTAL NORTH AMERICA | 17,200 | 0.21 | % | 36,980 | 341,500 | 0.16 | % | 535,480 | 358,700 | 0.16 | % | 572,460 | 62 | % | 478,400 | 0.17 | % | 796,480 | ||||||||||||||||
| Asia Pacific | ||||||||||||||||||||||||||||||||||
| Boddington Open Pit, Western Australia | 100 | % | 205,400 | 0.11 | % | 216,720 | 218,800 | 0.12 | % | 263,710 | 424,200 | 0.11 | % | 480,430 | 79 | % | 464,300 | 0.11 | % | 523,670 | ||||||||||||||
| Boddington Stockpiles, Western Australia(6) | 100 | % | 14,400 | 0.09 | % | 12,650 | 76,000 | 0.08 | % | 64,530 | 90,400 | 0.09 | % | 77,180 | 72 | % | 84,800 | 0.08 | % | 71,380 | ||||||||||||||
| TOTAL ASIA PACIFIC | 219,800 | 0.10 | % | 229,370 | 294,800 | 0.11 | % | 328,240 | 514,600 | 0.11 | % | 557,610 | 78 | % | 549,100 | 0.11 | % | 595,050 | ||||||||||||||||
| TOTAL NEWMONT CONTINUING OPERATIONS | 237,000 | 0.11 | % | 266,350 | 636,300 | 0.14 | % | 863,720 | 873,300 | 0.13 | % | 1,130,070 | 70 | % | 1,027,500 | 0.14 | % | 1,391,530 | ||||||||||||||||
| Batu Hijau Open Pit, Indonesia (7) | 48.5 | % | - | 0.00 | % | - | - | 0.00 | % | - | - | 0.00 | % | - | 0 | % | 122,100 | 0.50 | % | 606,500 | ||||||||||||||
| Batu Hijau Stockpiles, Indonesia (6)(7) | 48.5 | % | - | 0.00 | % | - | - | 0.00 | % | - | - | 0.00 | % | - | 0 | % | 167,700 | 0.34 | % | 576,300 | ||||||||||||||
| TOTAL NEWMONT WORLDWIDE | 237,000 | 0.11 | % | 266,350 | 636,300 | 0.14 | % | 863,720 | 873,300 | 0.13 | % | 1,130,070 | 70 | % | 1,317,300 | 0.20 | % | 2,574,330 | ||||||||||||||||
See footnotes under Copper Reserves U.S. units table.
| Attributable Copper Mineral Resources(1)(2) U.S. Units | |||||||||||||||||||||||||||||||
| December 31, 2016 | |||||||||||||||||||||||||||||||
| Measured Resources | Indicated Resources | Measured + Indicated Resources | Inferred Resources | ||||||||||||||||||||||||||||
| Deposits/Districts | Newmont Share | Tonnage | Grade | Copper | Tonnage | Grade | Copper | Tonnage | Grade | Copper | Tonnage | Grade | Copper | ||||||||||||||||||
| (x1000 tons) | (Cu%) | (million Pounds) | (x1000 tons) | (Cu%) | (million Pounds) | (x1000 tons) | (Cu%) | (million Pounds) | (x1000 tons) | (Cu%) | (million Pounds) | ||||||||||||||||||||
| North America | |||||||||||||||||||||||||||||||
| Phoenix, Nevada | 100 | % | 700 | 0.10 | % | - | 256,300 | 0.13 | % | 670 | 257,000 | 0.13 | % | 670 | 87,100 | 0.14 | % | 250 | |||||||||||||
| TOTAL NORTH AMERICA | 700 | 0.10 | % | - | 256,300 | 0.13 | % | 670 | 257,000 | 0.13 | % | 670 | 87,100 | 0.14 | % | 250 | |||||||||||||||
| South America | |||||||||||||||||||||||||||||||
| Conga, Peru | 51.35 | % | - | 0.00 | % | - | 392,700 | 0.26 | % | 2,040 | 392,700 | 0.26 | % | 2,040 | 130,500 | 0.19 | % | 480 | |||||||||||||
| Yanacocha, Peru | 51.35 | % | - | 0.00 | % | - | 57,000 | 0.67 | % | 760 | 57,000 | 0.67 | % | 760 | 5,700 | 0.35 | % | 40 | |||||||||||||
| TOTAL SOUTH AMERICA | - | 0.00 | % | - | 449,700 | 0.31 | % | 2,800 | 449,700 | 0.31 | % | 2,800 | 136,200 | 0.19 | % | 520 | |||||||||||||||
| Asia Pacific | |||||||||||||||||||||||||||||||
| Boddington, Western Australia | 100 | % | 119,700 | 0.09 | % | 220 | 270,700 | 0.11 | % | 590 | 390,400 | 0.10 | % | 810 | 8,300 | 0.10 | % | 20 | |||||||||||||
| TOTAL ASIA PACIFIC | 119,700 | 0.09 | % | 220 | 270,700 | 0.11 | % | 590 | 390,400 | 0.10 | % | 810 | 8,300 | 0.10 | % | 20 | |||||||||||||||
| TOTAL NEWMONT WORLDWIDE | 120,400 | 0.09 | % | 220 | 976,700 | 0.21 | % | 4,060 | 1,097,100 | 0.19 | % | 4,280 | 231,600 | 0.17 | % | 790 | |||||||||||||||
(1) | Resources are reported exclusive of reserves. Measured and Indicated Resources (combined) are equivalent to Mineralized Material disclosed in Newmont’s Form 10-K filing. | |
(2) | Resources are calculated at a copper price of $3.00 or A$3.75 per pound for 2016 and at a copper price of $3.50 or A$4.15 per pound for 2015 unless otherwise noted. Tonnage amounts have been rounded to the nearest 100,000, and pounds have been rounded to the nearest 10 million. | |
| Attributable Copper Mineral Resources(1)(2) Metric Units | |||||||||||||||||||||||||||||||
| December 31, 2016 | |||||||||||||||||||||||||||||||
| Measured Resources | Indicated Resources | Measured + Indicated Resources | Inferred Resources | ||||||||||||||||||||||||||||
| Deposits/Districts | Newmont Share | Tonnage | Grade | Copper | Tonnage | Grade | Copper | Tonnage | Grade | Copper | Tonnage | Grade | Copper | ||||||||||||||||||
| (x1000 tonnes) | (Cu%) | (tonnes) | (x1000 tonnes) | (Cu%) | (tonnes) | (x1000 tonnes) | (Cu%) | (tonnes) | (x1000 tonnes) | (Cu%) | (tonnes) | ||||||||||||||||||||
| North America | |||||||||||||||||||||||||||||||
| Phoenix, Nevada | 100 | % | 600 | 0.10 | % | 680 | 232,500 | 0.13 | % | 301,880 | 233,100 | 0.13 | % | 302,560 | 79,000 | 0.14 | % | 112,560 | |||||||||||||
| TOTAL NORTH AMERICA | 600 | 0.10 | % | 680 | 232,500 | 0.13 | % | 301,880 | 233,100 | 0.13 | % | 302,560 | 79,000 | 0.14 | % | 112,560 | |||||||||||||||
| South America | |||||||||||||||||||||||||||||||
| Conga, Peru | 51.35 | % | - | 0.00 | % | - | 356,300 | 0.26 | % | 924,370 | 356,300 | 0.26 | % | 924,370 | 118,400 | 0.19 | % | 221,040 | |||||||||||||
| Yanacocha, Peru | 51.35 | % | - | 0.00 | % | - | 51,700 | 0.67 | % | 344,000 | 51,700 | 0.67 | % | 344,000 | 5,200 | 0.35 | % | 18,130 | |||||||||||||
| TOTAL SOUTH AMERICA | - | 0.00 | % | - | 408,000 | 0.31 | % | 1,268,370 | 408,000 | 0.31 | % | 1,268,370 | 123,600 | 0.19 | % | 239,170 | |||||||||||||||
| Asia Pacific | |||||||||||||||||||||||||||||||
| Boddington, Western Australia | 100 | % | 108,700 | 0.09 | % | 100,180 | 245,500 | 0.11 | % | 268,600 | 354,200 | 0.10 | % | 368,780 | 7,500 | 0.10 | % | 7,690 | |||||||||||||
| TOTAL ASIA PACIFIC | 108,700 | 0.09 | % | 100,180 | 245,500 | 0.11 | % | 268,600 | 354,200 | 0.10 | % | 368,780 | 7,500 | 0.10 | % | 7,690 | |||||||||||||||
| TOTAL NEWMONT WORLDWIDE | 109,300 | 0.09 | % | 100,860 | 886,000 | 0.21 | % | 1,838,850 | 995,300 | 0.19 | % | 1,939,710 | 210,100 | 0.17 | % | 359,420 | |||||||||||||||
See footnotes under Copper Resources U.S. units table.
| Attributable Proven, Probable, and Combined Silver Reserves(1) U.S. Units | ||||||||||||||||||||||||||||||
| December 31, 2016 | December 31, 2015 | |||||||||||||||||||||||||||||
| Proven Reserves | Probable Reserves |
Proven and Probable |
Metallurgical |
Proven and Probable | ||||||||||||||||||||||||||
| Deposits/Districts by Reporting Unit | Newmont Share | Tonnage(2) | Grade | Silver(3) | Tonnage(2) | Grade | Silver(3) | Tonnage(2) | Grade | Silver(3) | Tonnage(2) | Grade | Silver(3) | |||||||||||||||||
| (x1000 tons) | (oz/ton) | (x1000 ozs) | (x1000 tons) | (oz/ton) | (x1000 ozs) | (x1000 tons) | (oz/ton) | (x1000 ozs) | (x1000 tons) | (oz/ton) | (x1000 ozs) | |||||||||||||||||||
| North America | ||||||||||||||||||||||||||||||
| Phoenix, Nevada | 100 | % | 4,800 | 0.29 | 1,390 | 251,800 | 0.24 | 59,520 | 256,600 | 0.24 | 60,910 | 38 | % | 289,500 | 0.25 | 73,510 | ||||||||||||||
| TOTAL NORTH AMERICA | 4,800 | 0.29 | 1,390 | 251,800 | 0.24 | 59,520 | 256,600 | 0.24 | 60,910 | 38 | % | 289,500 | 0.25 | 73,510 | ||||||||||||||||
| South America | ||||||||||||||||||||||||||||||
| Yanacocha Open Pits | 51.35 | % | 17,900 | 0.21 | 3,680 | 29,000 | 0.22 | 6,350 | 46,900 | 0.21 | 10,030 | 16 | % | 63,800 | 0.20 | 12,480 | ||||||||||||||
| Yanacocha Leach Pad (4) | 51.35 | % | - | - | - | 50,500 | 0.25 | 12,390 | 50,500 | 0.25 | 12,390 | 6 | % | 45,000 | 0.24 | 10,600 | ||||||||||||||
| Yanacocha Stockpiles (5) | 51.35 | % | 5,500 | 1.10 | 5,990 | - | - | - | 5,500 | 1.10 | 5,990 | 20 | % | 7,800 | 0.99 | 7,720 | ||||||||||||||
| TOTAL SOUTH AMERICA | 23,400 | 0.41 | 9,670 | 79,500 | 0.24 | 18,740 | 102,900 | 0.28 | 28,410 | 12 | % | 116,600 | 0.26 | 30,800 | ||||||||||||||||
| TOTAL NEWMONT CONTINUING OPERATIONS | 28,200 | 0.39 | 11,060 | 331,300 | 0.24 | 78,260 | 359,500 | 0.25 | 89,320 | 30 | % | 406,100 | 0.26 | 104,310 | ||||||||||||||||
| Batu Hijau Open Pit (6) | 48.5 | % | - | - | - | - | - | - | - | - | - | 0 | % | 134,500 | 0.04 | 5,800 | ||||||||||||||
| Batu Hijau Stockpiles (5)(6) | 48.5 | % | - | - | - | - | - | - | - | - | - | 0 | % | 184,800 | 0.02 | 3,160 | ||||||||||||||
| TOTAL NEWMONT WORLDWIDE | 28,200 | 0.39 | 11,060 | 331,300 | 0.24 | 78,260 | 359,500 | 0.25 | 89,320 | 30 | % | 725,400 | 0.16 | 113,270 | ||||||||||||||||
(1) | See footnote (1) to the Gold Reserves table above. Silver reserves for 2016 were calculated at a silver price of $17. Silver reserves for 2015 were calculated at a silver price of $19. | |
(2) | See footnote (2) to the Gold Reserves table above. Tonnages are rounded to nearest 100,000. | |
(3) | See footnote (3) to the Gold Reserves table above. | |
(4) | Leach Pad material is the material on leach pads at the end of the year from which silver remains to be recovered. In-process material reserves are reported separately where tonnage or ounces are greater than 5% of the total site-reported reserves and ounces are greater than 100,000. | |
(5) | Stockpiles are comprised primarily of material that has been set aside to allow processing of higher grade material in the mills. Stockpiles increase or decrease depending on current mine plans. Stockpile reserves are reported separately where ounces exceed 100,000 and are greater than 5% of the total site-reported reserves. | |
(6) | Newmont divested its interest in the Batu Hijau mine on November 2, 2016. As such, Newmont share percentage was zero as of December 31, 2016. The percentage figure above for Batu Hijau represent Newmont interest as of December 31, 2015 of 48.5%. | |
| Attributable Proven, Probable, and Combined Silver Reserves(1) Metric Units | ||||||||||||||||||||||||||||||
| December 31, 2016 | December 31, 2015 | |||||||||||||||||||||||||||||
| Proven Reserves | Probable Reserves |
Proven and Probable |
Metallurgical |
Proven and Probable | ||||||||||||||||||||||||||
| Deposits/Districts by Reporting Unit | Newmont Share | Tonnage(2) | Grade | Silver(3) | Tonnage(2) | Grade | Silver(3) | Tonnage(2) | Grade | Silver(3) | Tonnage(2) | Grade | Silver(3) | |||||||||||||||||
| (x1000 tonnes) | (g/tonne) | (x1000 ozs) | (x1000 tonnes) | (g/tonne) | (x1000 ozs) | (x1000 tonnes) | (g/tonne) | (x1000 ozs) | (x1000 tonnes) | (g/tonne) | (x1000 ozs) | |||||||||||||||||||
| North America | ||||||||||||||||||||||||||||||
| Phoenix, Nevada | 100 | % | 4,400 | 9.8 | 1,390 | 228,400 | 8.1 | 59,520 | 232,800 | 8.1 | 60,910 | 38 | % | 262,600 | 8.7 | 73,510 | ||||||||||||||
| TOTAL NORTH AMERICA | 4,400 | 9.8 | 1,390 | 228,400 | 8.1 | 59,520 | 232,800 | 8.1 | 60,910 | 38 | % | 262,600 | 8.7 | 73,510 | ||||||||||||||||
| South America | ||||||||||||||||||||||||||||||
| Yanacocha Open Pits, Peru | 51.35 | % | 16,200 | 7.0 | 3,680 | 26,300 | 7.5 | 6,350 | 42,500 | 7.3 | 10,030 | 16 | % | 57,900 | 6.7 | 12,480 | ||||||||||||||
| Yanacocha Leach Pad, Peru (4) | 51.35 | % | - | - | - | 45,800 | 8.4 | 12,390 | 45,800 | 8.4 | 12,390 | 6 | % | 40,800 | 8.1 | 10,600 | ||||||||||||||
| Yanacocha Stockpiles, Peru (5) | 51.35 | % | 5,000 | 37.6 | 5,990 | - | - | - | 5,000 | 37.6 | 5,990 | 20 | % | 7,100 | 33.8 | 7,720 | ||||||||||||||
| TOTAL SOUTH AMERICA | 21,200 | 14.2 | 9,670 | 72,100 | 8.1 | 18,740 | 93,300 | 9.5 | 28,410 | 12 | % | 105,800 | 9.1 | 30,800 | ||||||||||||||||
| TOTAL NEWMONT CONTINUING OPERATIONS | 25,600 | 13.4 | 11,060 | 300,500 | 8.1 | 78,260 | 326,100 | 8.5 | 89,320 | 30 | % | 368,400 | 8.8 | 104,310 | ||||||||||||||||
| Batu Hijau Open Pit, Indonesia (6) | 48.5 | % | - | - | - | - | - | - | - | - | - | 0 | % | 122,100 | 1.5 | 5,800 | ||||||||||||||
| Batu Hijau Stockpiles, Indonesia (5)(6) | 48.5 | % | - | - | - | - | - | - | - | - | - | 0 | % | 167,700 | 0.6 | 3,160 | ||||||||||||||
| TOTAL NEWMONT WORLDWIDE | 25,600 | 13.4 | 11,060 | 300,500 | 8.1 | 78,260 | 326,100 | 8.5 | 89,320 | 30 | % | 658,200 | 5.4 | 113,270 | ||||||||||||||||
See Footnotes under Silver Reserves U.S. units table.
| Attributable Silver Mineral Resources(1)(2) U.S. Units | |||||||||||||||||||||||||||
| December 31, 2016 | |||||||||||||||||||||||||||
| Measured Resources | Indicated Resources | Measured + Indicated Resources | Inferred Resources | ||||||||||||||||||||||||
| Deposits/Districts | Newmont Share | Tonnage | Grade | Ag | Tonnage | Grade | Ag | Tonnage | Grade | Ag | Tonnage | Grade | Ag | ||||||||||||||
| (x1000 tons) | (oz/ton) | (x1000 ozs) | (x1000 tons) | (oz/ton) | (x1000 ozs) | (x1000 tons) | (oz/ton) | (x1000 ozs) | (x1000 tons) | (oz/ton) | (x1000 ozs) | ||||||||||||||||
| North America | |||||||||||||||||||||||||||
| Sandman, Nevada | 100 | % | - | - | - | 1,300 | 0.20 | 260 | 1,300 | 0.20 | 260 | 1,100 | 0.12 | 140 | |||||||||||||
| Phoenix, Nevada | 100 | % | 700 | 0.20 | 150 | 177,400 | 0.21 | 37,310 | 178,100 | 0.21 | 37,460 | 60,800 | 0.23 | 13,710 | |||||||||||||
| TOTAL NORTH AMERICA | 700 | 0.20 | 150 | 178,700 | 0.21 | 37,570 | 179,400 | 0.21 | 37,720 | 61,900 | 0.22 | 13,850 | |||||||||||||||
| South America | |||||||||||||||||||||||||||
| Conga, Peru | 51.35 | % | - | - | - | 392,700 | 0.06 | 23,580 | 392,700 | 0.06 | 23,580 | 99,100 | 0.03 | 3,250 | |||||||||||||
| Yanacocha, Peru | 51.35 | % | 6,300 | 0.16 | 1,020 | 57,500 | 0.58 | 33,170 | 63,800 | 0.54 | 34,190 | 3,300 | 0.34 | 1,140 | |||||||||||||
| TOTAL SOUTH AMERICA | 6,300 | 0.16 | 1,020 | 450,200 | 0.13 | 56,750 | 456,500 | 0.13 | 57,770 | 102,400 | 0.04 | 4,390 | |||||||||||||||
| TOTAL NEWMONT WORLDWIDE | 7,000 | 0.17 | 1,170 | 628,900 | 0.15 | 94,320 | 635,900 | 0.15 | 95,490 | 164,300 | 0.11 | 18,240 | |||||||||||||||
| (1) | Resources are reported exclusive of reserves. Measured and Indicated Resources (combined) are equivalent to Mineralized Material disclosed in Newmont’s Form 10-K filing. | |
| (2) | Resource for 2016 was calculated at a silver price of $20 per ounce and at a silver price of $24 per ounce for 2015. Tonnage amounts have been rounded to the nearest 100,000. | |
| Attributable Silver Mineral Resources(1)(2) Metric Units | |||||||||||||||||||||||||||
| December 31, 2016 | |||||||||||||||||||||||||||
| Measured Resources | Indicated Resources | Measured + Indicated Resources | Inferred Resources | ||||||||||||||||||||||||
| Deposits/Districts | Newmont Share | Tonnage | Grade | Ag | Tonnage | Grade | Ag | Tonnage | Grade | Ag | Tonnage | Grade | Ag | ||||||||||||||
| (x1000 tonnes) | (g/tonne) | (x1000 ozs) | (x1000 tonnes) | (g/tonne) | (x1000 ozs) | (x1000 tonnes) | (g/tonne) | (x1000 ozs) | (x1000 tonnes) | (g/tonne) | (x1000 ozs) | ||||||||||||||||
| North America | |||||||||||||||||||||||||||
| Sandman, Nevada | 100 | % | - | - | - | 1,200 | 6.8 | 260 | 1,200 | 6.8 | 260 | 1,100 | 4.1 | 140 | |||||||||||||
| Phoenix, Nevada | 100 | % | 700 | 6.9 | 150 | 160,900 | 7.2 | 37,310 | 161,600 | 7.2 | 37,460 | 55,100 | 7.7 | 13,710 | |||||||||||||
| TOTAL NORTH AMERICA | 700 | 6.9 | 150 | 162,100 | 7.2 | 37,570 | 162,800 | 7.2 | 37,720 | 56,200 | 7.7 | 13,850 | |||||||||||||||
| South America | |||||||||||||||||||||||||||
| Conga, Peru | 51.35 | % | - | - | - | 356,300 | 2.1 | 23,580 | 356,300 | 2.1 | 23,580 | 89,900 | 1.1 | 3,250 | |||||||||||||
| Yanacocha, Peru | 51.35 | % | 5,600 | 5.6 | 1,020 | 52,100 | 19.8 | 33,170 | 57,700 | 18.4 | 34,190 | 3,000 | 11.7 | 1,140 | |||||||||||||
| TOTAL SOUTH AMERICA | 5,600 | 5.6 | 1,020 | 408,400 | 4.3 | 56,750 | 414,000 | 4.3 | 57,770 | 92,900 | 1.5 | 4,390 | |||||||||||||||
| TOTAL NEWMONT WORLDWIDE | 6,300 | 5.7 | 1,170 | 570,500 | 5.1 | 94,320 | 576,800 | 5.1 | 95,490 | 149,100 | 3.8 | 18,240 | |||||||||||||||
See Footnotes under Silver Resources U.S. units table.
Cautionary Statement regarding Reserves and Resources:
The “reserves” disclosed in this release have been prepared in compliance with Industry Guide 7 published by the SEC. As used in this news release, the term “reserve” means that part of a mineral deposit that can be economically and legally extracted or produced at the time of the reserve determination. The term “economically,” as used in this definition, means that profitable extraction or production has been established or analytically demonstrated in a feasibility study to be viable and justifiable under reasonable investment and market assumptions. The term “legally,” as used in this definition, does not imply that all permits needed for mining and processing have been obtained or that other legal issues have been completely resolved. However, for a reserve to exist, Newmont must have a justifiable expectation, based on applicable laws and regulations, that issuance of permits or resolution of legal issues necessary for mining and processing at a particular deposit will be accomplished in the ordinary course and in a timeframe consistent with Newmont’s current mine plans. Reserves in this news release are aggregated from the proven and probable classes.
The term “proven reserves” used in the tables of this news release means reserves for which (a) quantity is computed from dimensions revealed in outcrops, trenches, workings or drill holes; (b) grade and/or quality are computed from the results of detailed sampling; and (c) the sites for inspection, sampling and measurements are spaced so closely and the geologic character is sufficiently defined that size, shape, depth and mineral content of reserves are well established. The term “probable reserves” means reserves for which quantity and grade are computed from information similar to that used for proven reserves, but the sites for sampling are farther apart or are otherwise less closely spaced. The degree of assurance, although lower than that for proven reserves, is high enough to assume continuity between points of observation. Newmont classifies all reserves as Probable on its development projects until a year of production has confirmed all assumptions made in the reserve estimates. Proven and probable reserves include gold, copper or silver attributable to Newmont’s ownership or economic interest. Proven and probable reserves were calculated using cut-off grades. The term “cut-off grade” means the lowest grade of mineralized material considered economic to process. Cut-off grades vary between deposits depending upon prevailing economic conditions, mineability of the deposit, by-products, amenability of the ore to gold, copper or silver extraction and type of milling or leaching facilities available.
The terms “resources” and “Measured, Indicated and Inferred resources” are used in this news release. Investors are advised that the SEC does not recognize these terms. Newmont has determined that such “resources” would be substantively the same as those prepared using the Guidelines established by the Society of Mining, Metallurgy and Exploration (SME) and defined as “Mineral Resource”. Estimates of resources are subject to further exploration and development, are subject to additional risks, and no assurance can be given that they will eventually convert to future reserves. Inferred resources, in particular, have a great amount of uncertainty as to their existence and their economic and legal feasibility. Investors are cautioned not to assume that any part or all of the Inferred resource exists, or is economically or legally mineable. Also, disclosure of contained ounces is permitted under the SME Guideline and other regulatory guidelines, such as Canada’s NI 43-101 and Australia’s JORC. However, the SEC generally requires mineral resource information in SEC-filed documents to be reported only as in-place tonnage and grade. Investors are reminded that even if significant mineralization is discovered and converted to reserves, during the time necessary to ultimately move such mineralization to production the economic feasibility of production may change. See the Company’s Annual Report for the “Proven and Probable Reserve” and “Mineralized Material” tables prepared in compliance with the SEC’s Industry Guide 7, available at http://www.newmont.com/our-investors/financial-reporting/sec-filings and on www.sec.gov. Investors are reminded that the tables presented in the Annual Report are estimates as of December 31, 2016 and were presented on an attributable basis reflecting the Company’s ownership interest at such time.
Cautionary Statement Regarding Forward Looking Statements:
This release contains “forward-looking statements” within the meaning of Section 27A of the Securities Act of 1933, as amended, and Section 21E of the Securities Exchange Act of 1934, as amended, which are intended to be covered by the safe harbor created by such sections and other applicable laws. Such forward-looking statements may include, without limitation, estimates and expectations of future exploration expenditures and activities. Where the Company expresses or implies an expectation or belief as to future events or results, such expectation or belief is expressed in good faith and believed to have a reasonable basis. However, such statements are subject to risks, uncertainties and other factors, which could cause actual results to differ materially from future results expressed or implied by the “forward-looking statements”. For a discussion of such risks relating to our business and other factors, see the Company’s Form 10-K, filed on or about February 21, 2017, with the Securities and Exchange Commission under the headings “Risk Factors” and “Forward-Looking Statements.” The Company does not undertake any obligation to release publicly revisions to any “forward-looking statement,” including, without limitation, outlook, to reflect events or circumstances after the date of this news release, or to reflect the occurrence of unanticipated events, except as may be required under applicable securities laws. Investors should not assume that any lack of update to a previously issued “forward-looking statement” constitutes a reaffirmation of that statement. Continued reliance on “forward-looking statements” is at investors' own risk.
View source version on businesswire.com: http://www.businesswire.com/news/home/20170221006620/en/
Contacts:
Investor
Contacts
Meredith Bandy, 303-837-5143
meredith.bandy@newmont.com
or
Media
Contacts
Omar Jabara, 303-837-5114
omar.jabara@newmont.com
