Incyte Corp. (INCY) has been trending higher since hitting its 52-week low on March 23rd. Yet, now the rally has stalled and a key resistance level has formed.
INCY focuses on the discovery and development of small-molecule drugs. The company's lead drug, Jakafi, treats two types of rare blood cancer and graft versus host disease. The company last week announced positive results from a Phase 3 clinical trial, REACH3, that evaluated Jakafi in patients with moderate or severe steroid-refractory or steroid dependent chronic graft-versus-host disease (GvHD).
Take a look at the 1-year chart of INCY below with added notations:
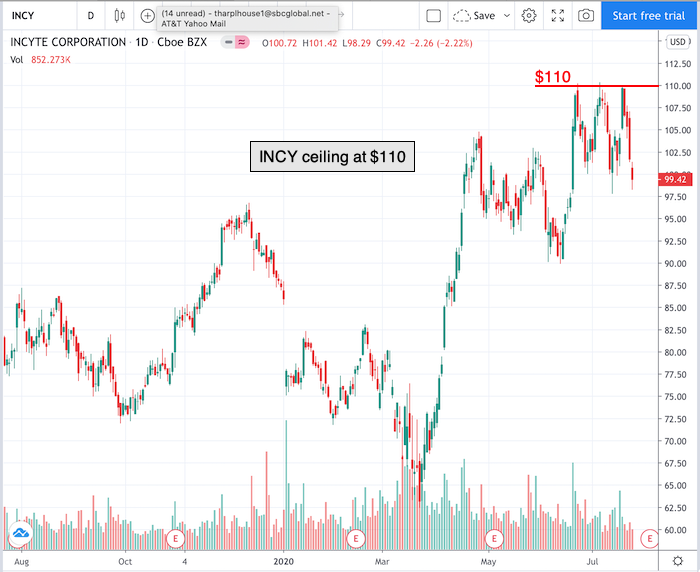
Chart of INCY provided by TradingView
As you can see in the chart above, there is a resistance level that has formed at $110 (red) and was tested on three separate occasions. $110 is also the 52 week high for INCY. A trader could buy the stock after a solid close above the resistance level with the expectation of a breakout.
Keep an eye out on August 4th for INCY’s latest earnings report.
Have a good trading day!
Good luck!
Christian Tharp, CMT
@cmtstockcoach
Want More Great Investing Ideas?
9 "BUY THE DIP" Growth Stocks for 2020
Newly REVISED 2020 Stock Market Outlook
7 "Safe-Haven" Dividend Stocks for Turbulent Times
INCY shares were trading at $101.95 per share on Monday morning, up $2.53 (+2.54%). Year-to-date, INCY has gained 16.75%, versus a 1.24% rise in the benchmark S&P 500 index during the same period.
About the Author: Christian Tharp

Christian is an expert stock market coach at the Adam Mesh Trading Group who has mentored more than 4,000 traders and investors. He is a professional technical analyst that is a certified Chartered Market Technician (CMT), which is a designation awarded by the CMT Association. Christian is also the author of the daily online newsletter Todays Big Stock.
The post Chart of the Day: Incyte (INCY) appeared first on StockNews.com