Popular home improvement retailer The Home Depot, Inc. (HD) posted its biggest revenue miss in over 20 years for the first quarter. The company posted a $37.26 billion revenue, down 4.2% year-over-year and lower than the $38.28 billion expected.
However, the remodeling industry tailwinds could favor this home improvement retailer. According to a Home Improvement Research Institute (HIRI) survey, homeowners are favoring cost-friendly home improvement projects, such as DIY, as homeowners’ intent to remodel remains strong.
As of May, 84% of homeowners surveyed completed home repair or maintenance projects, and 31% homeowners reported they will probably start a project in the next 30 days (the highest percentage so far in 2023).
On the other hand, the company expects sales and comparable sales for fiscal 2023 to decline between 2% and 5% compared to fiscal 2022, while its EPS is projected to decline between 7% and 13% compared to fiscal 2022. However, HD forecasted sales growth between 3% and 4% per year in its market stability outlook.
Given this backdrop, let’s look at the trends of HD’s key financial metrics to understand why it might be wise to wait for a better entry point in the stock.
Home Depot's Financial Performance: Analyzing Net Income, Gross Margin, and Key Metrics Growth
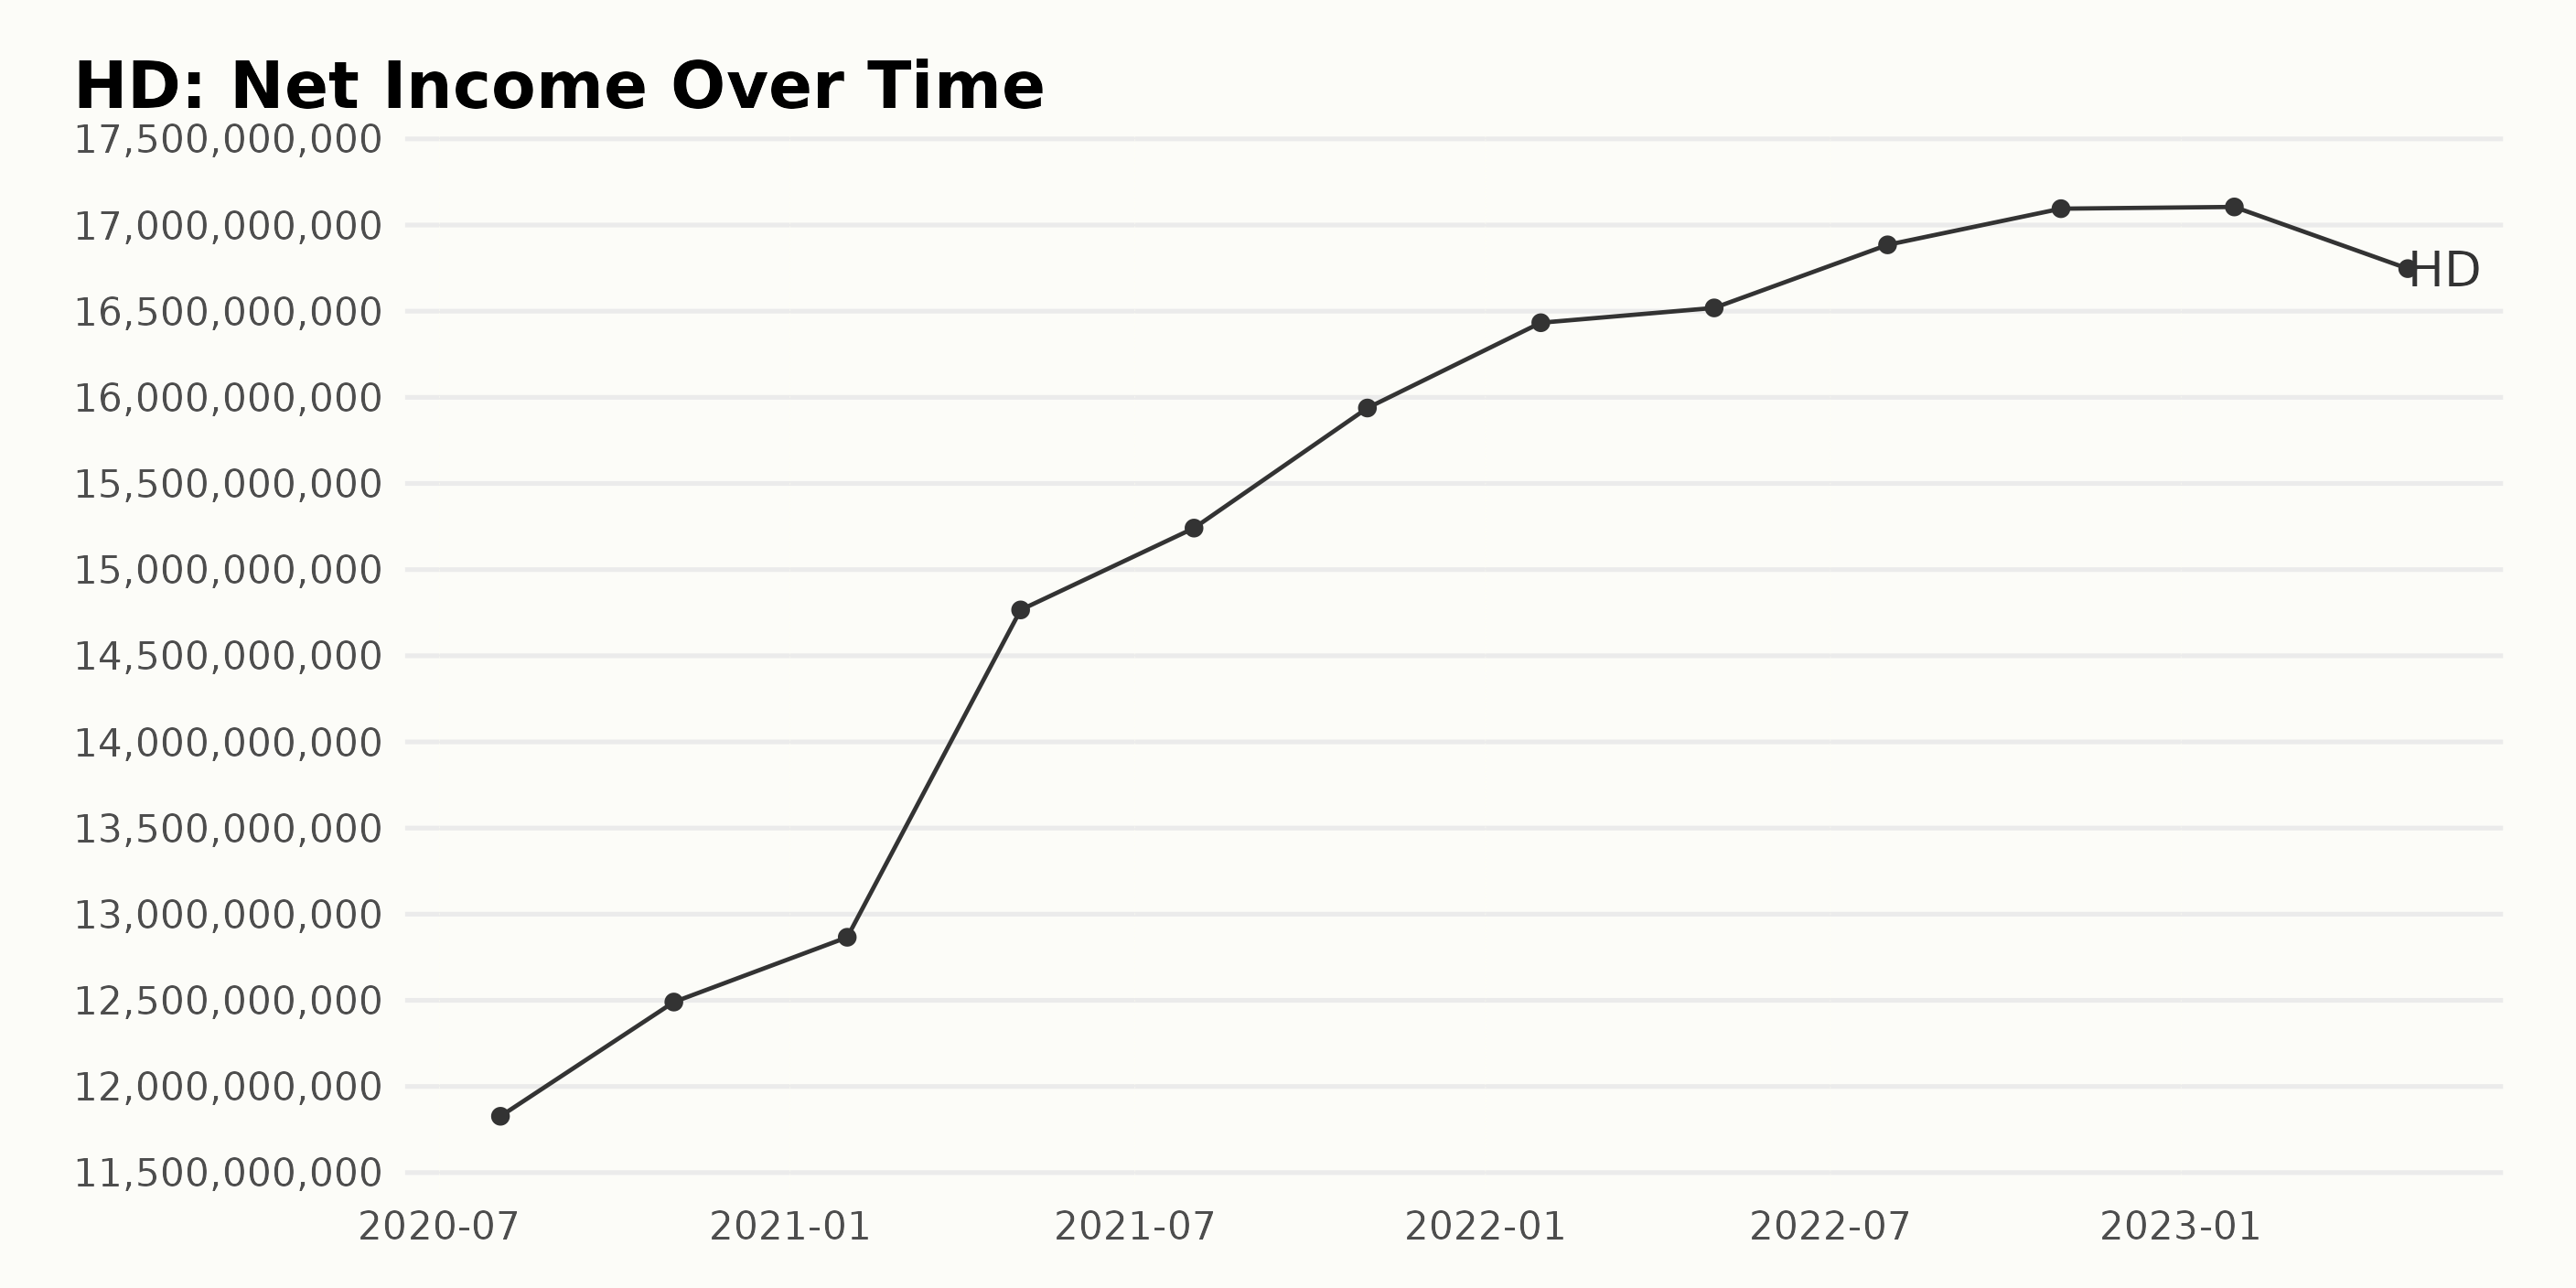
The trailing-12-month net income of HD has experienced an overall upward trend with some fluctuations over the observed period. Here is a summary of the key data points:
- August 2020: $11.83 billion
- November 2020: $12.49 billion
- January 2021: $12.87 billion
- May 2021: $14.77 billion
- August 2021: $15.24 billion
- October 2021: $15.94 billion
- January 2022: $16.43 billion
- May 2022: $16.52 billion
- July 2022: $16.89 billion
- October 2022: $17.10 billion
- January 2023: $17.11 billion
- April 2023: $16.75 billion
The most recent data from April 2023 shows that the net income is at $16.75 billion, which represents a decline from the highest recorded value in January 2023 ($17.11 billion). Overall, HD's net income has grown by approximately 41% from August 2020 to April 2023. The fluctuations observed indicate some variability, but the general trend remains positive.
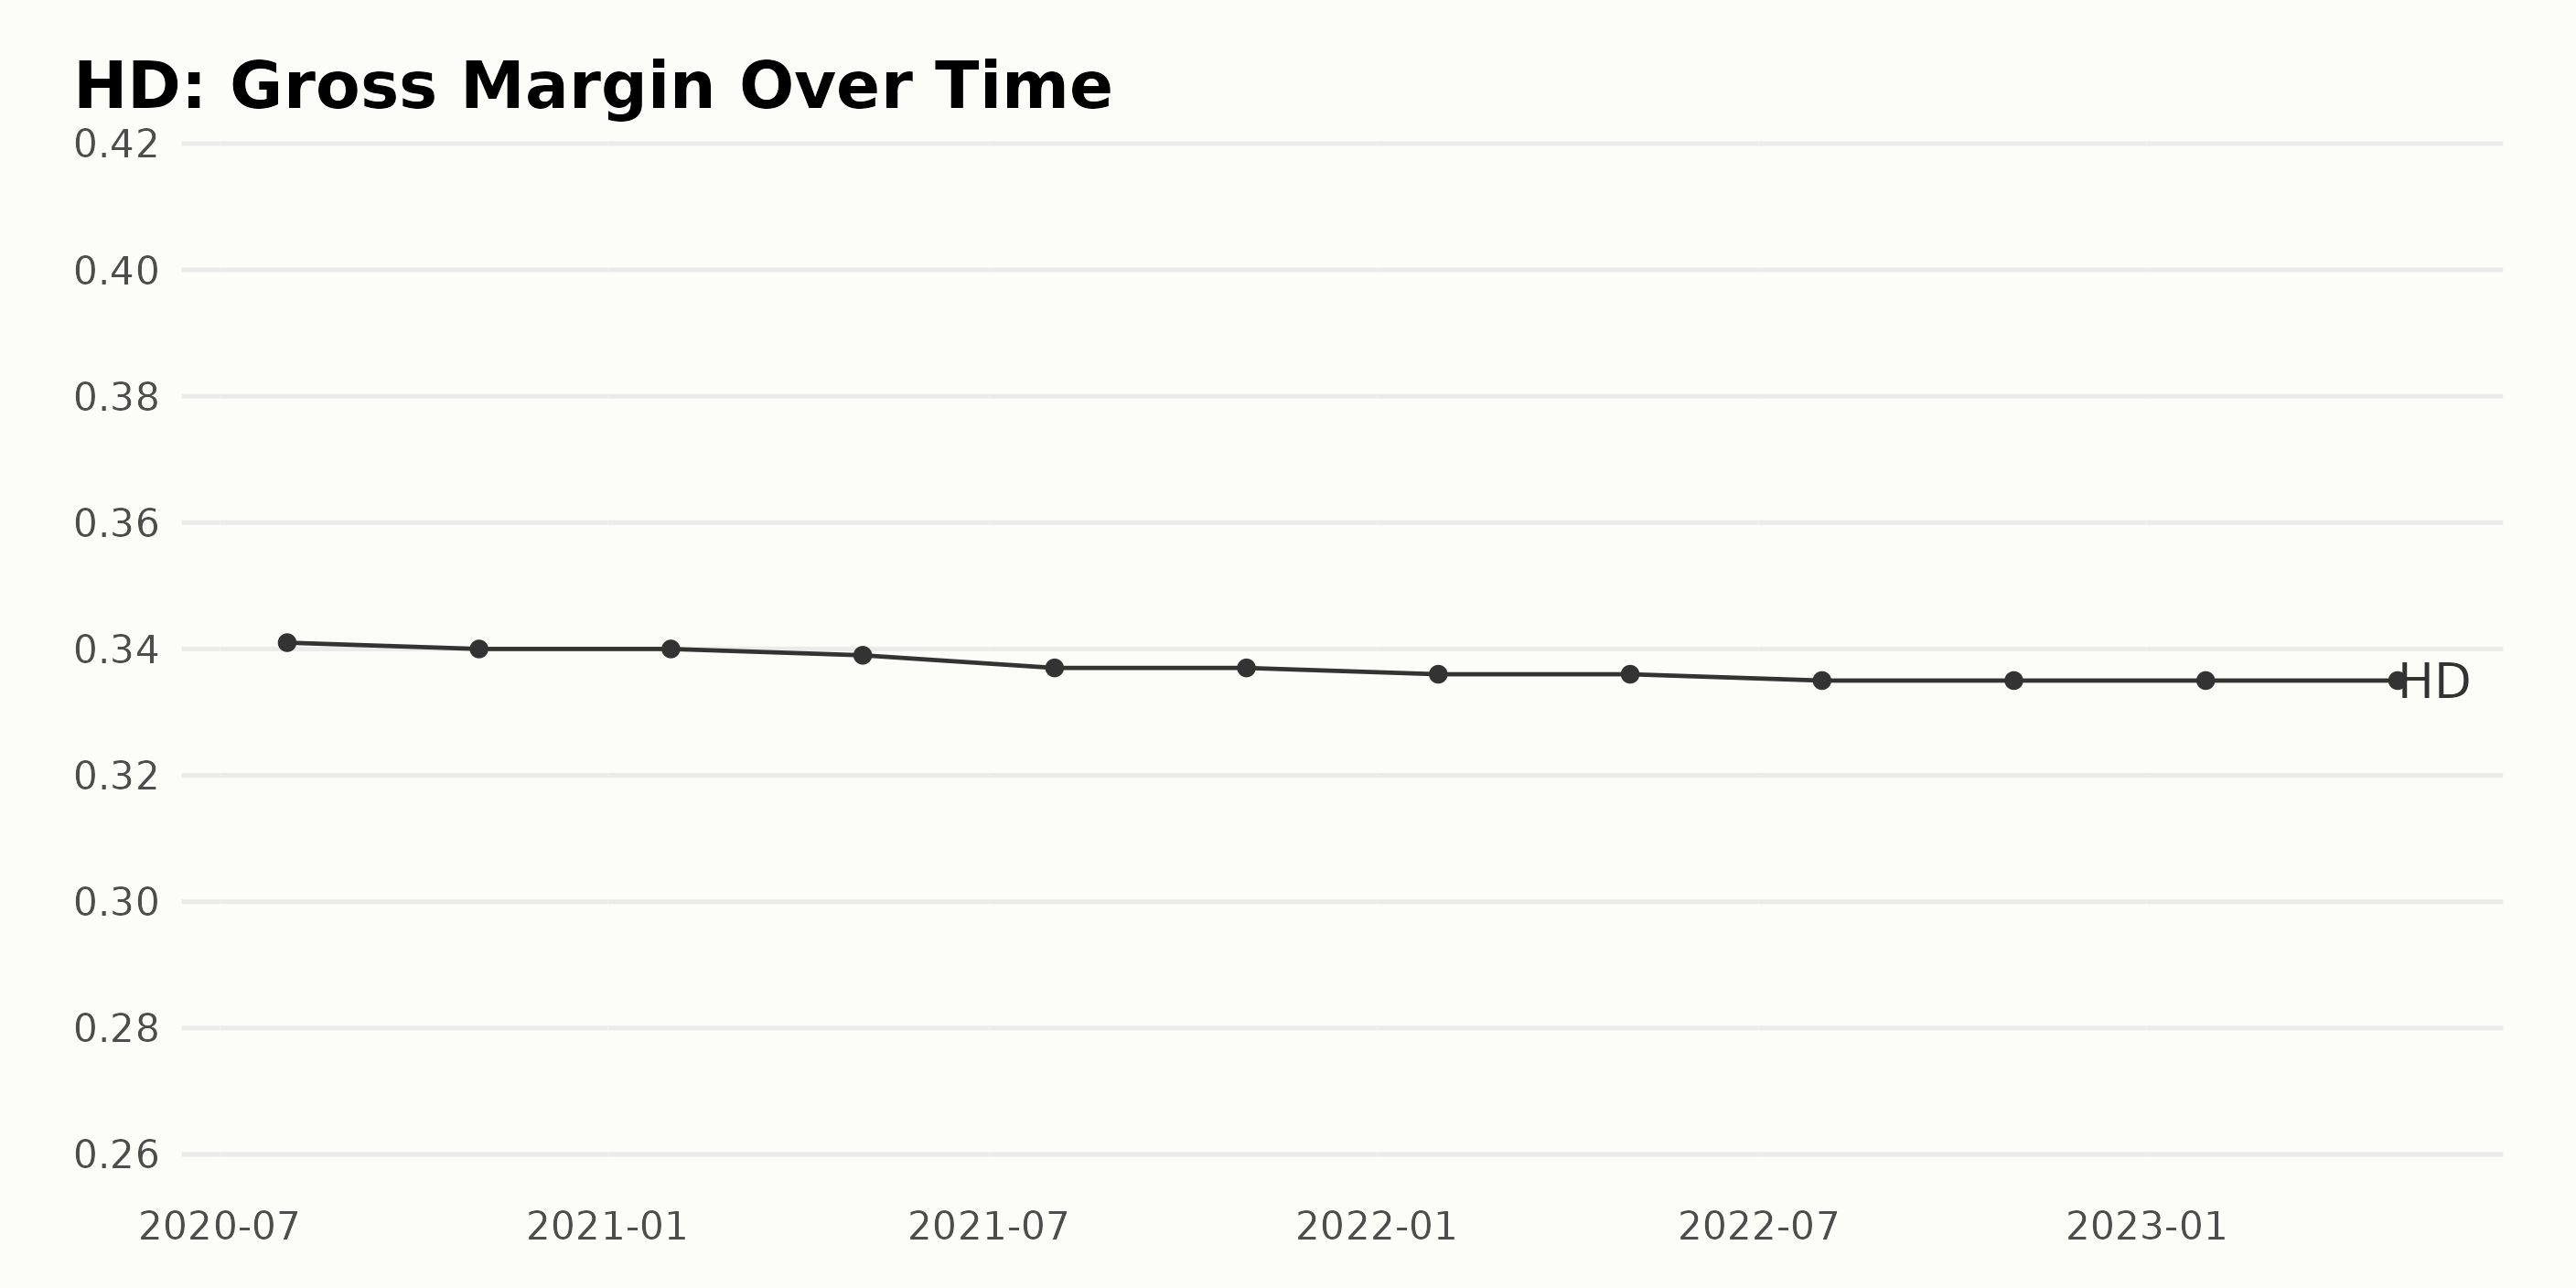
Below is a summary of the gross margin trend and fluctuations for HD:
- August 2, 2020: 34.1%
- November 1, 2020: 34.0%
- January 31, 2021: 34.0%
- May 2, 2021: 33.9%
- August 1, 2021: 33.7%
- October 31, 2021: 33.7%
- January 30, 2022: 33.6%
- May 1, 2022: 33.6%
- July 31, 2022: 33.5%
- October 30, 2022: 33.5%
- January 29, 2023: 33.5%
- April 30, 2023: 33.5%
The data shows a slightly decreasing trend in the gross margin over time. There's a decline in the gross margin, from 34.1% on August 2, 2020, to 33.5% on April 30, 2023. This represents a decrease of 0.6 percentage points. The most recent data from April 2023 shows no significant changes, with the gross margin remaining stable at 33.5%.
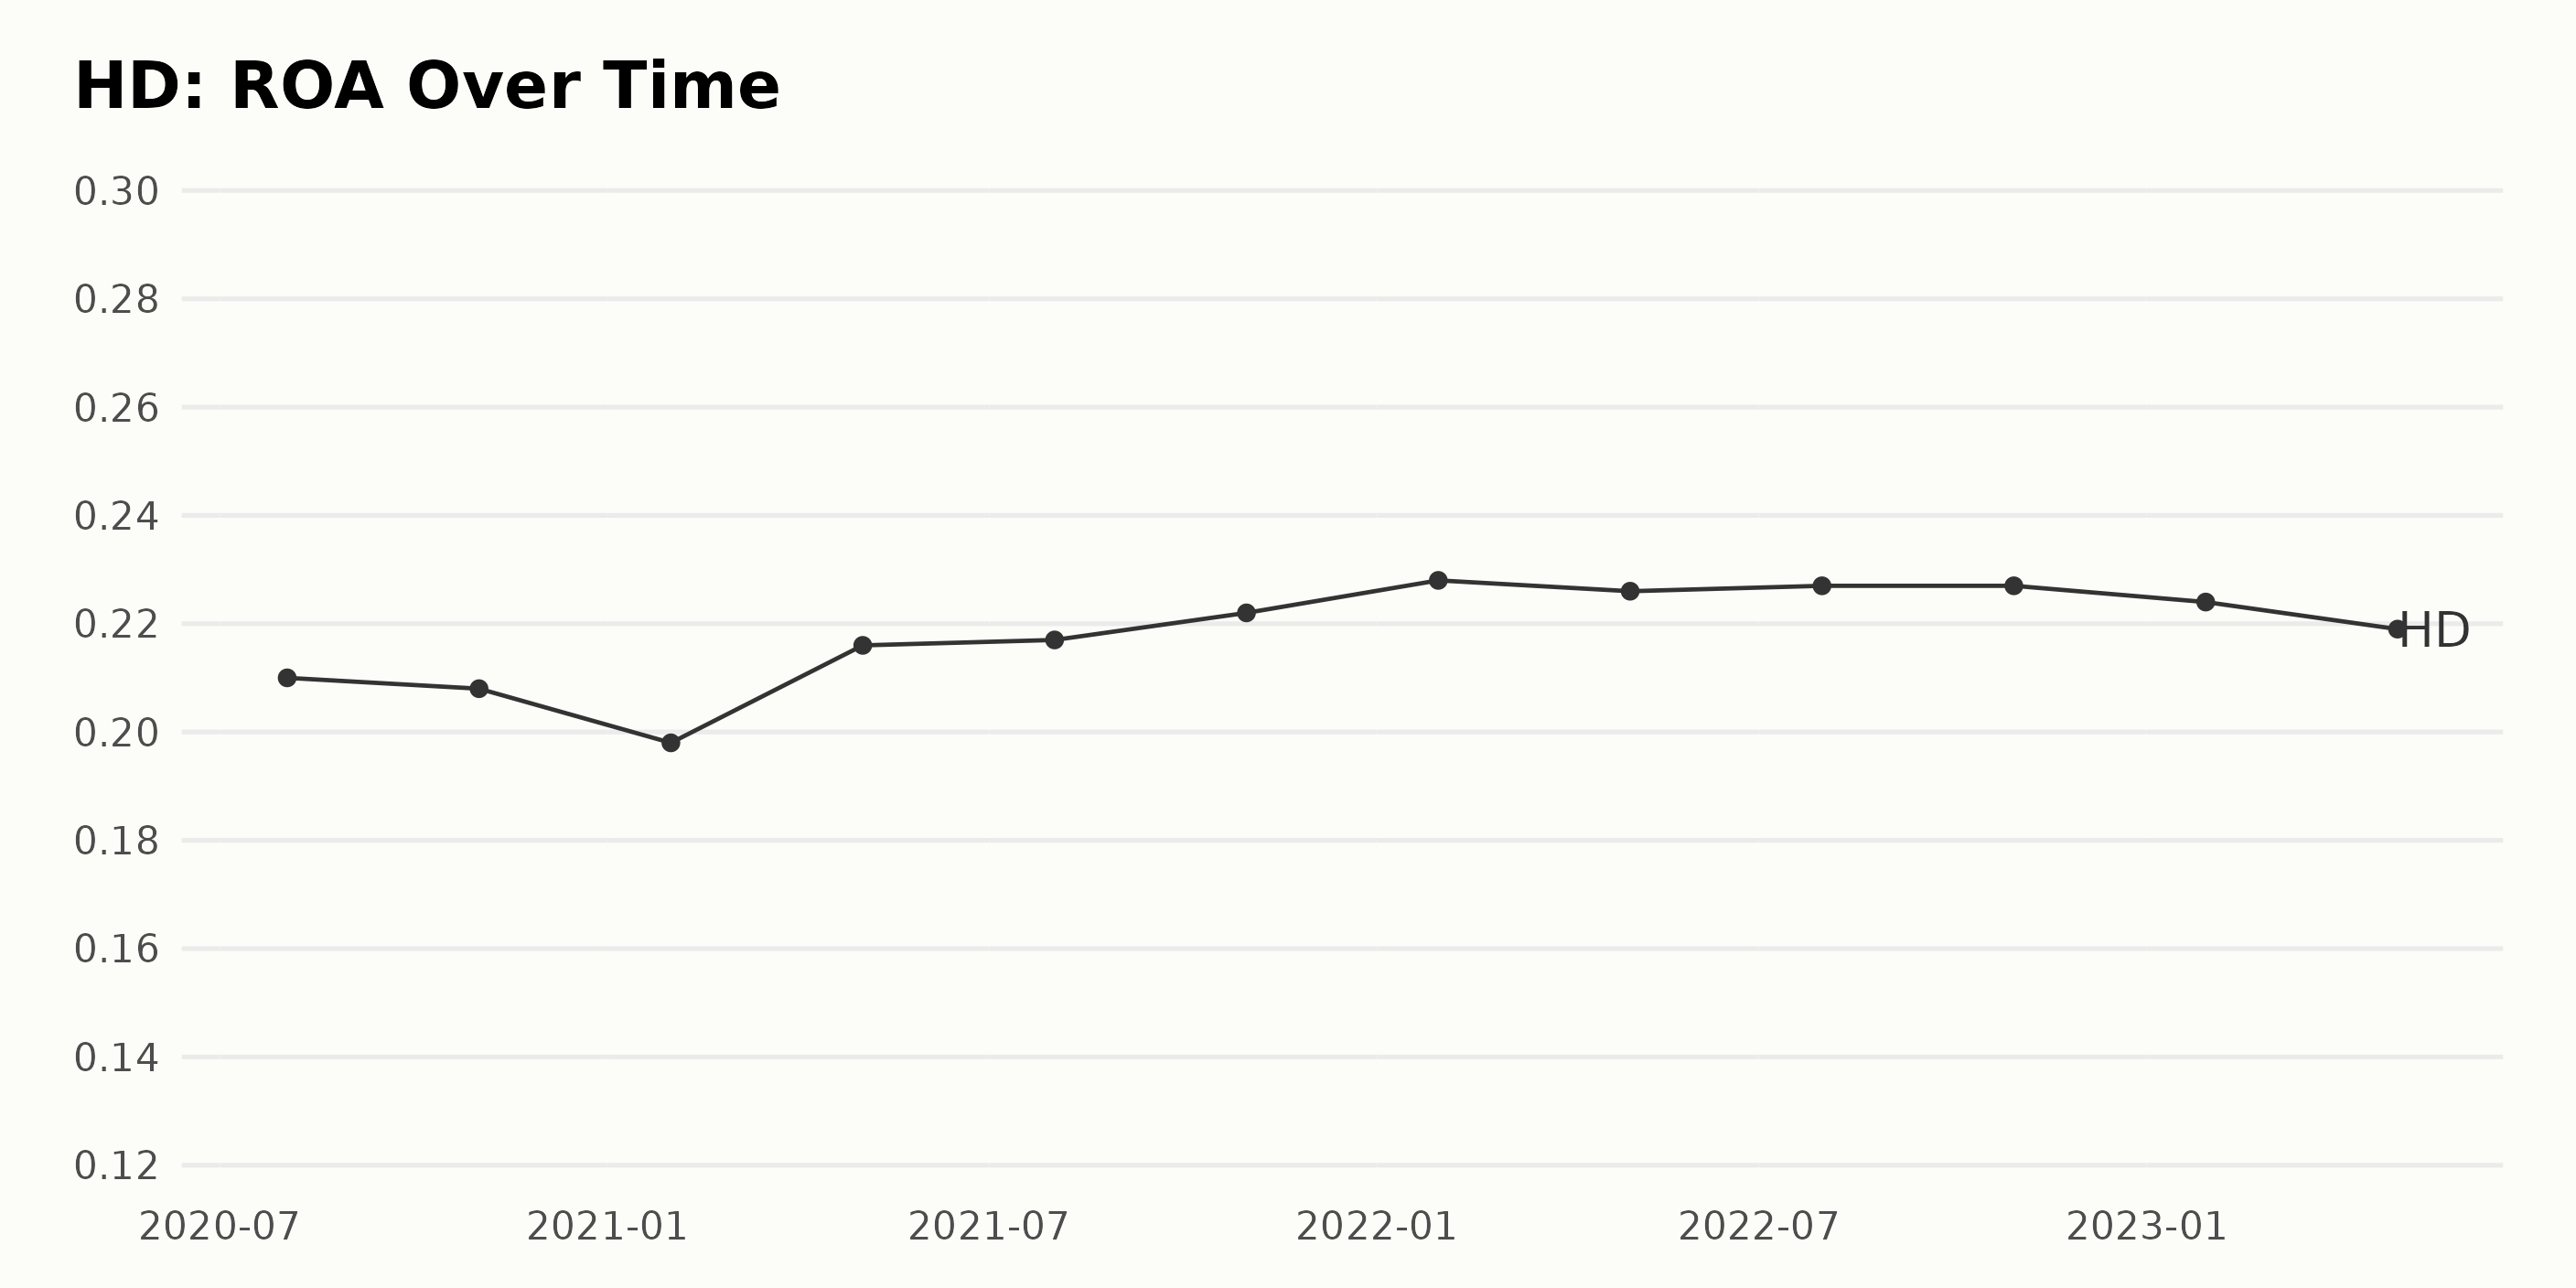
The Return of Assets (ROA) of HD has displayed fluctuations, with a general increasing trend over the given series of data. Notable points include:
- Starting with an ROA of 0.21 in August 2020
- Hitting its lowest point at 0.198 in January 2021
- Reaching its highest value of 0.228 in January 2022
- Subsequently declining to 0.219 by April 2023
Overall, HD experienced a growth rate of approximately 4.3% in its ROA when comparing the first value in August 2020 to the last value in April 2023. Despite some fluctuations, the more recent data indicates a slight decline.
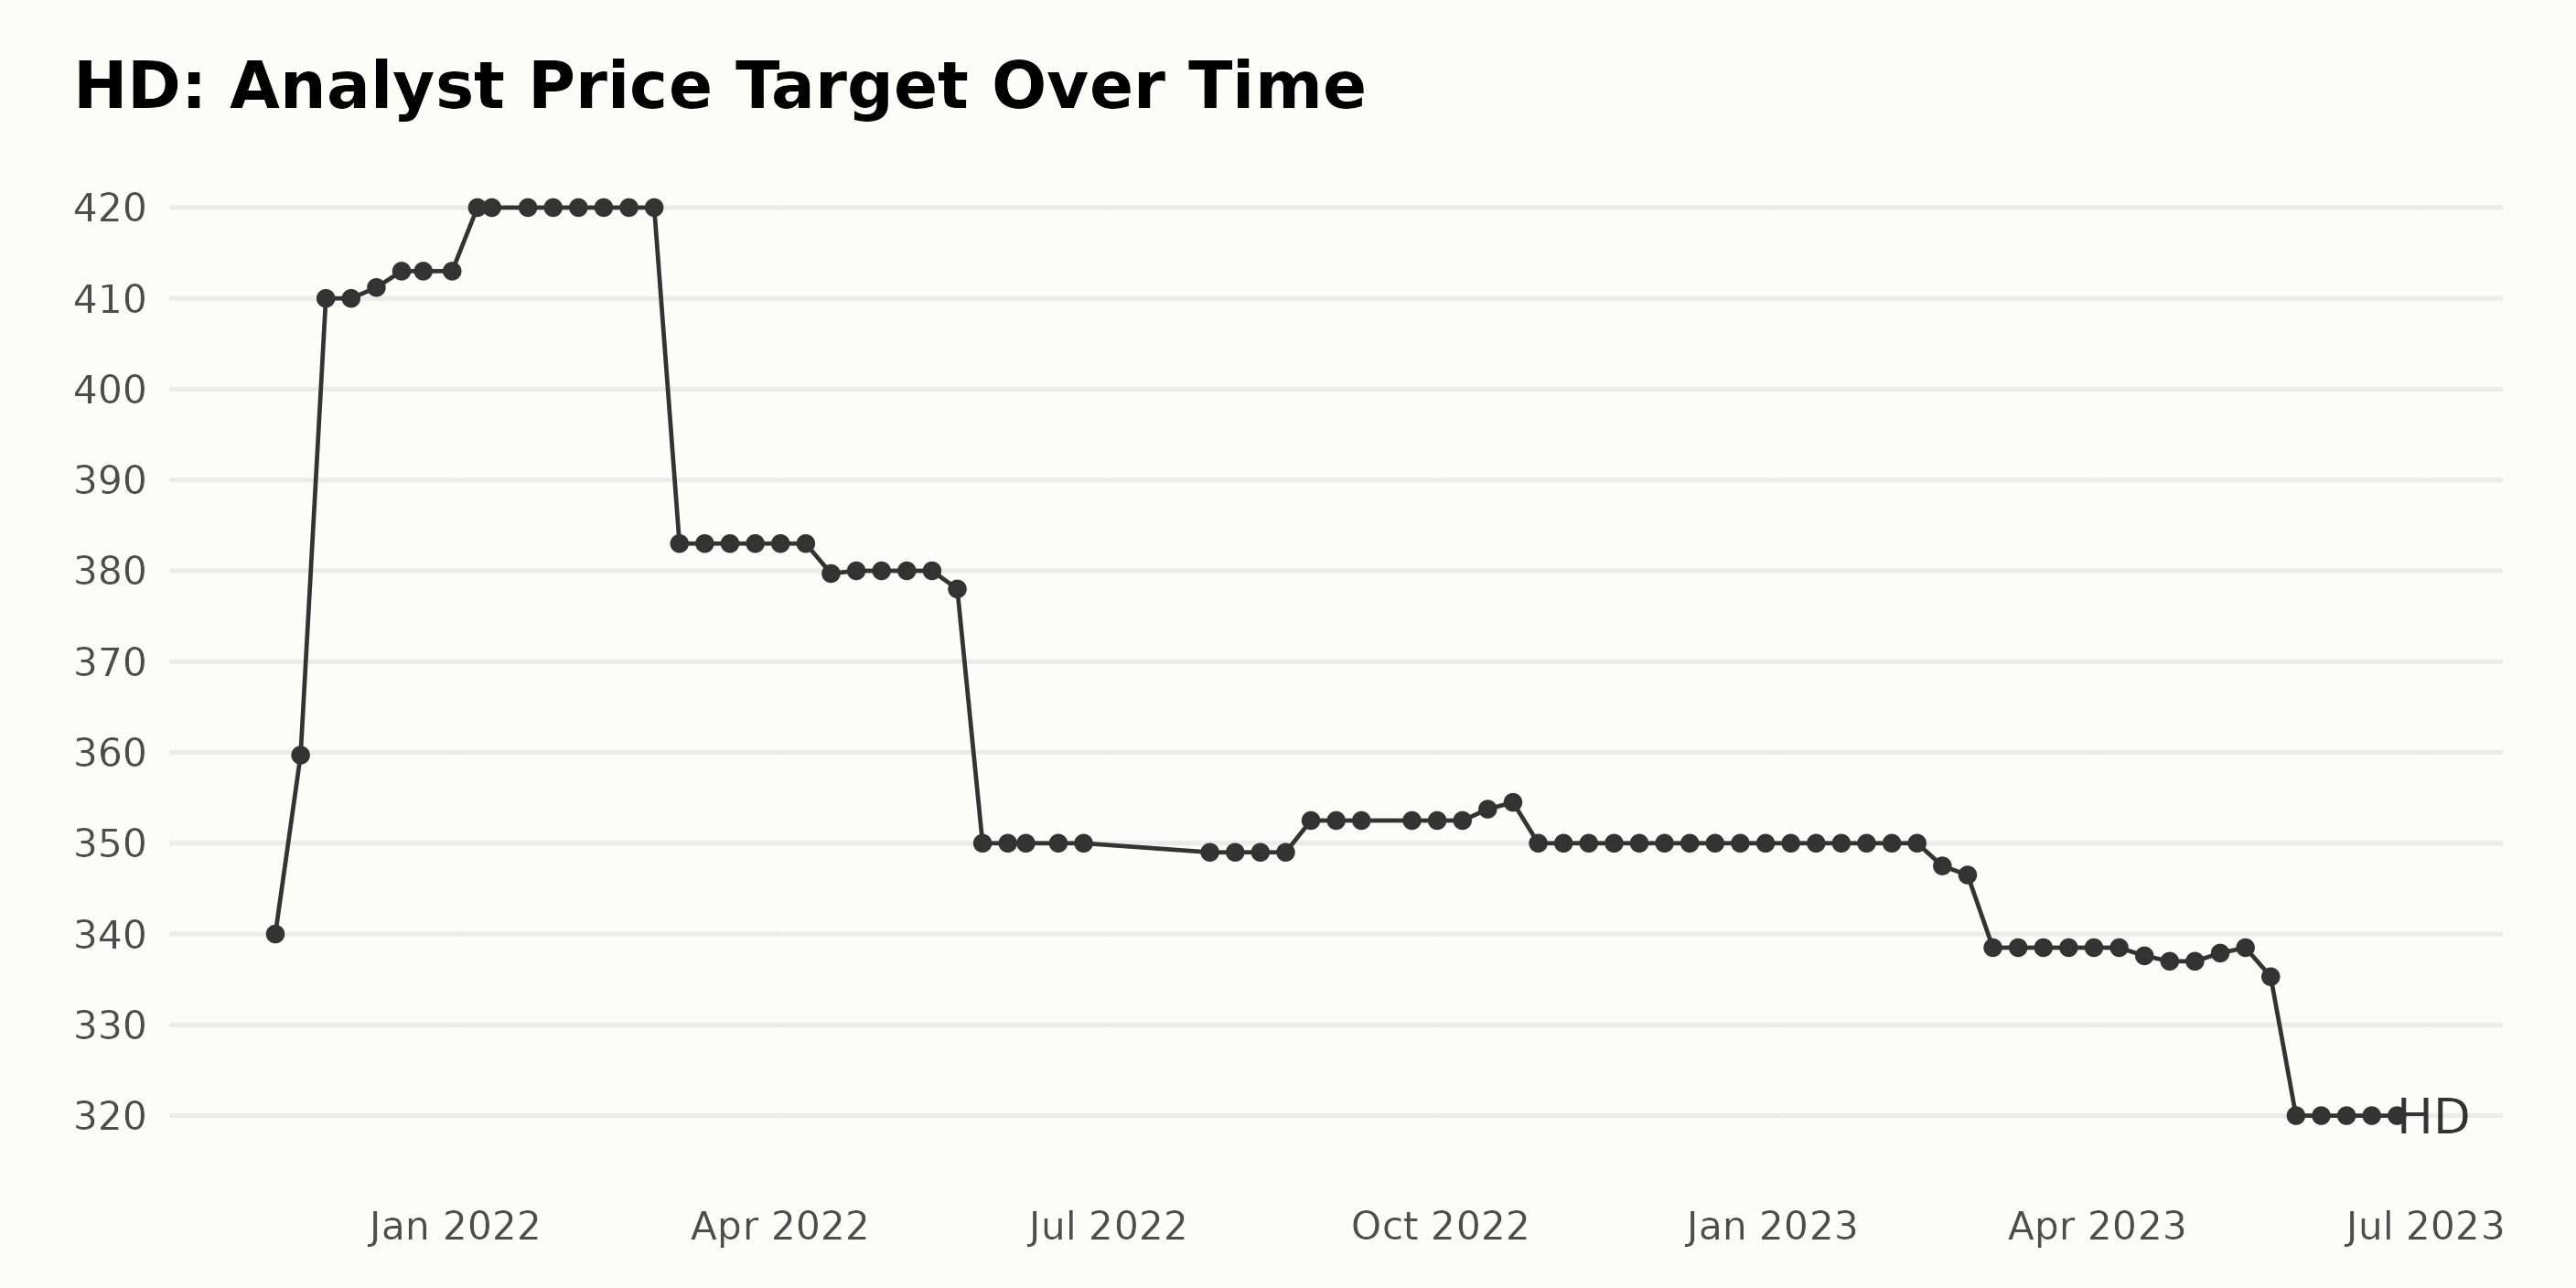
HD has experienced variations in its Analyst Price Target (APR) over the given period. Here are the significant events and trends in the data series:
- The price target increased from $340 on November 12, 2021, to $420 in early January 2022, representing a growth rate of 23.53%.
- The APR hovered around $420 through February 2022 before dropping to $383 in early March 2022.
- It remained stable at $383 until mid-April 2022, after which it experienced a slight dip, reaching $350 by May 27, 2022.
- Throughout the rest of 2022 and into early 2023, the price target fluctuated slightly around $350.
- In February 2023, another decline occurred, with the APR dropping from $350 to $338.50 by March 2023.
- As of June 23, 2023, the latest available data point, the APR is set at $320.
In summary, HD’s price target underwent a significant rise in late 2021 and early 2022 but has been on a moderate downward trend since then, with the most recent value being $320 as of June 23, 2023.
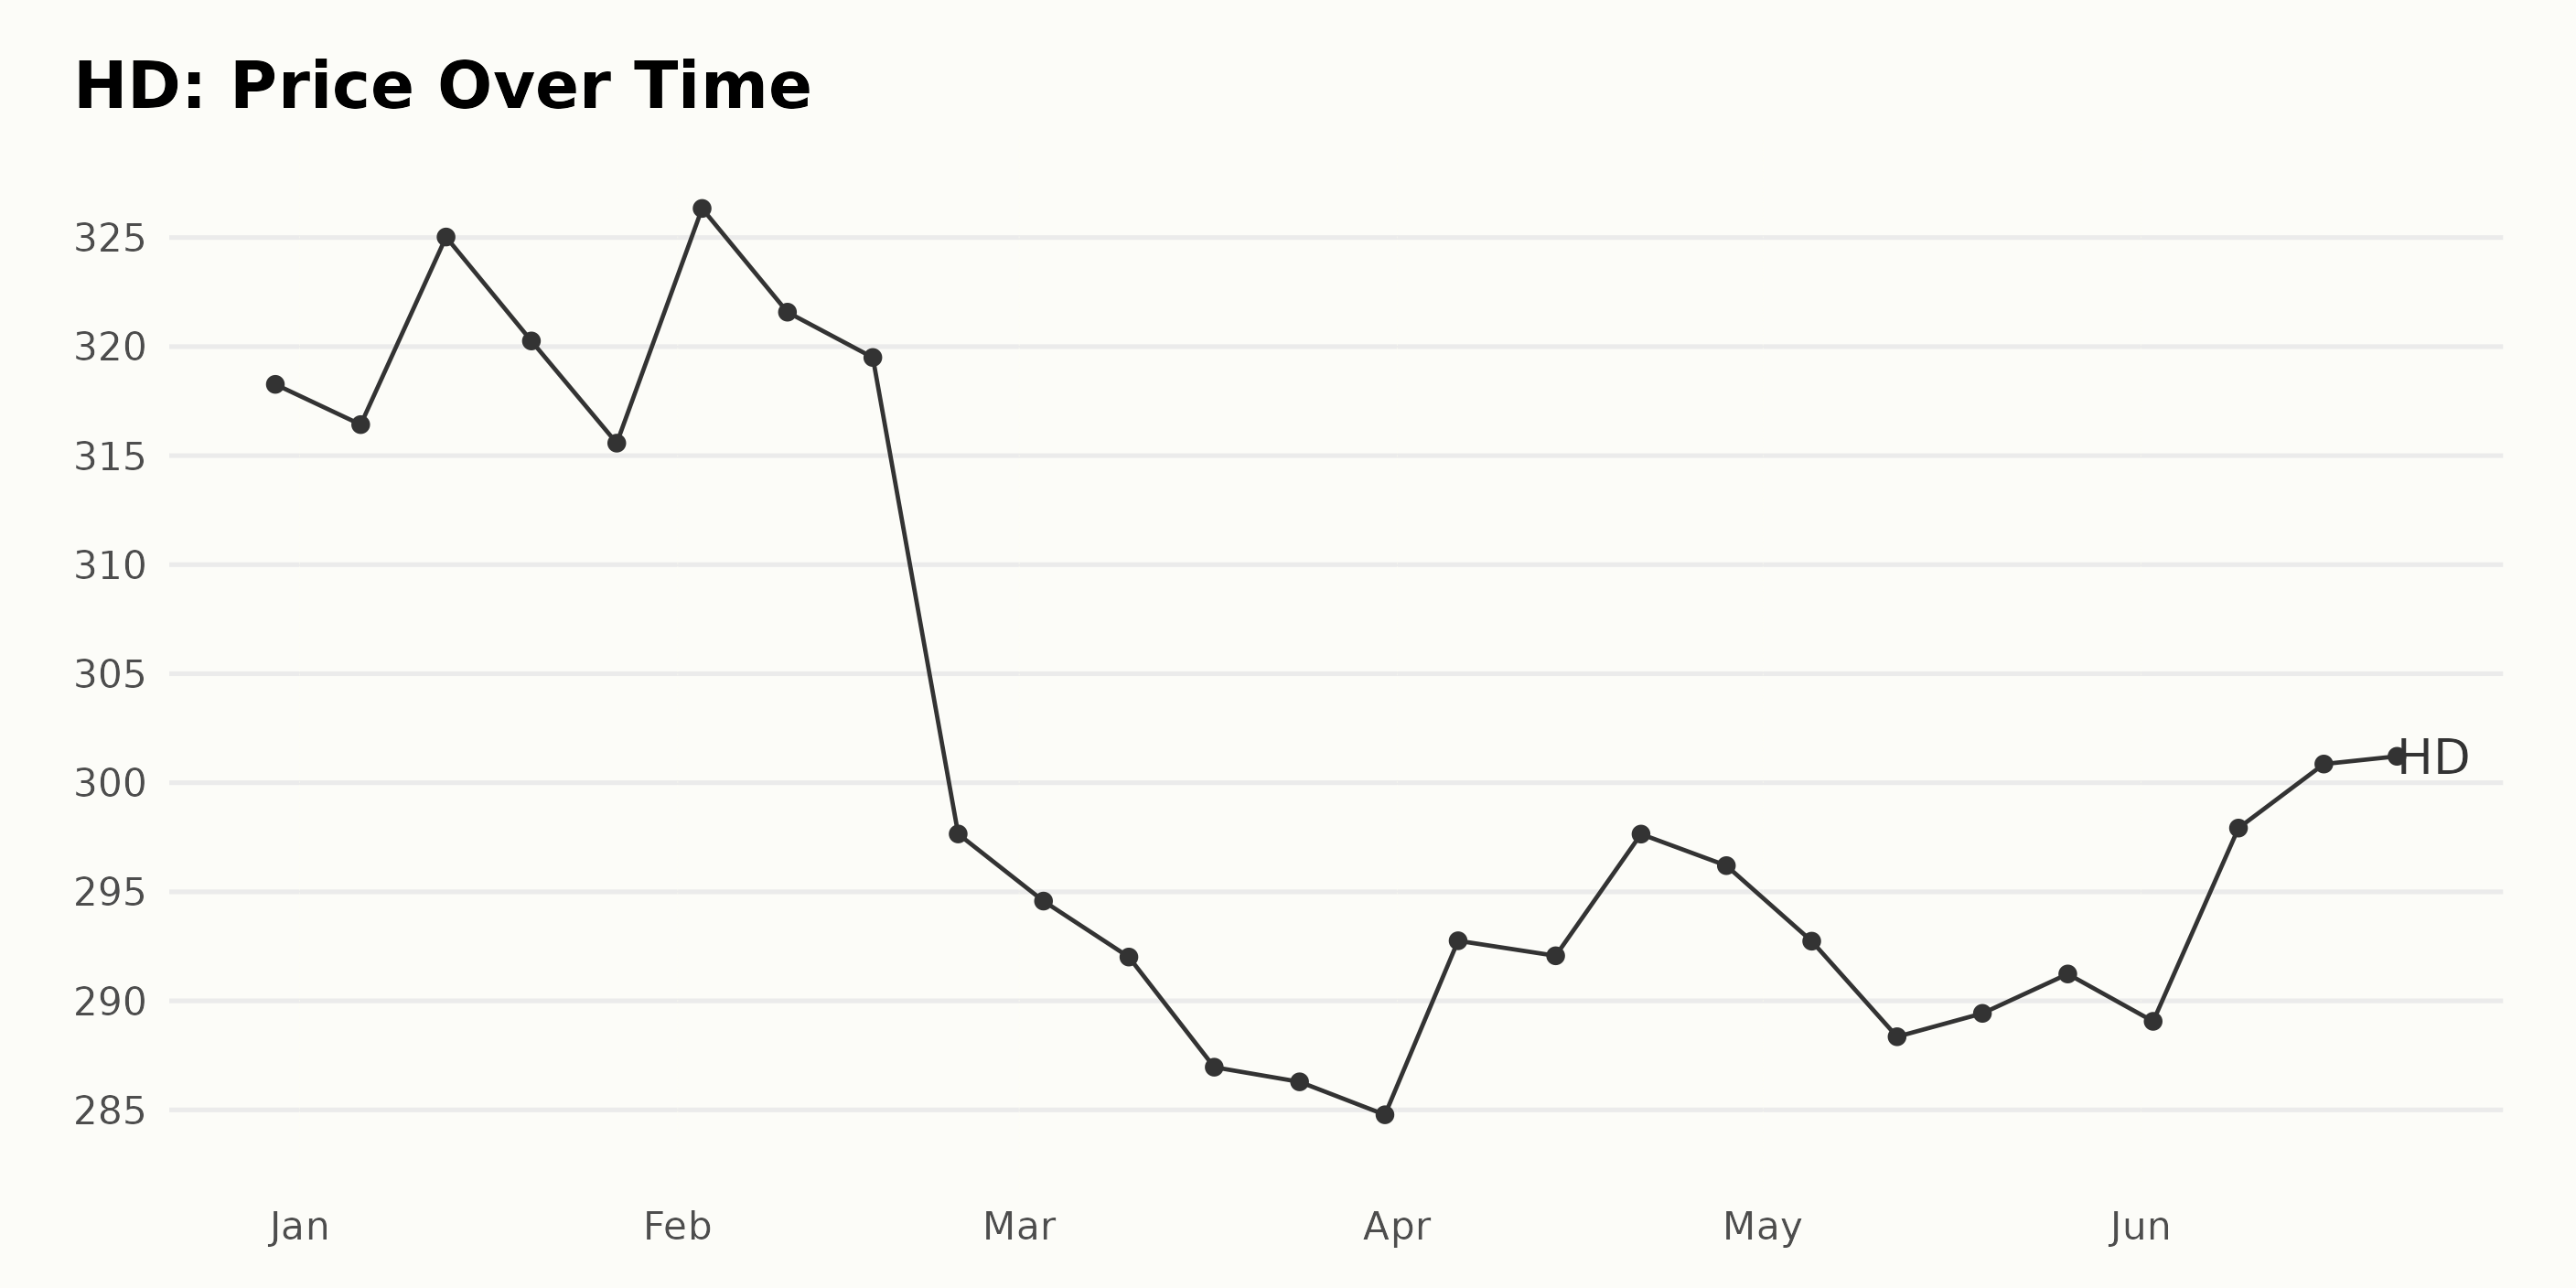
Analyzing Home Depot's Share Price Fluctuations: December 2022 to June 2023
The trend and growth rate of the share price of HD from December 30, 2022, to June 22, 2023, can be summarized as follows:
There is no clear linear trend in the data, but there are some noticeable fluctuations with a temporary dip between February and March 2023. The prices descended from $319.50 on February 17, 2023, to $284.78 on March 31, 2023, followed by a slight recovery after March. Here is a chart of HD's price over the past 180 days.
Home Depot's Notable Performance: Quality, Stability, and Rising Momentum
The overall POWR Ratings grade of HD in the Home Improvement & Goods category has shown consistent performance across several weeks. As of the latest available data on June 23, 2023, HD's overall POWR Ratings grade is a C (Neutral), with its rank in the category being #28 out of 57 stocks. Here is the summary of the HD's POWR grade and rank in the category over the mentioned period:
- December 31, 2022: POWR grade - C; Rank - #30
- February 4, 2023: POWR grade - C; Rank - #24
- April 15, 2023: POWR grade - C; Rank - #24
- May 27, 2023: POWR grade - C; Rank - #31
- June 23, 2023 (latest): POWR grade - C; Rank - #28
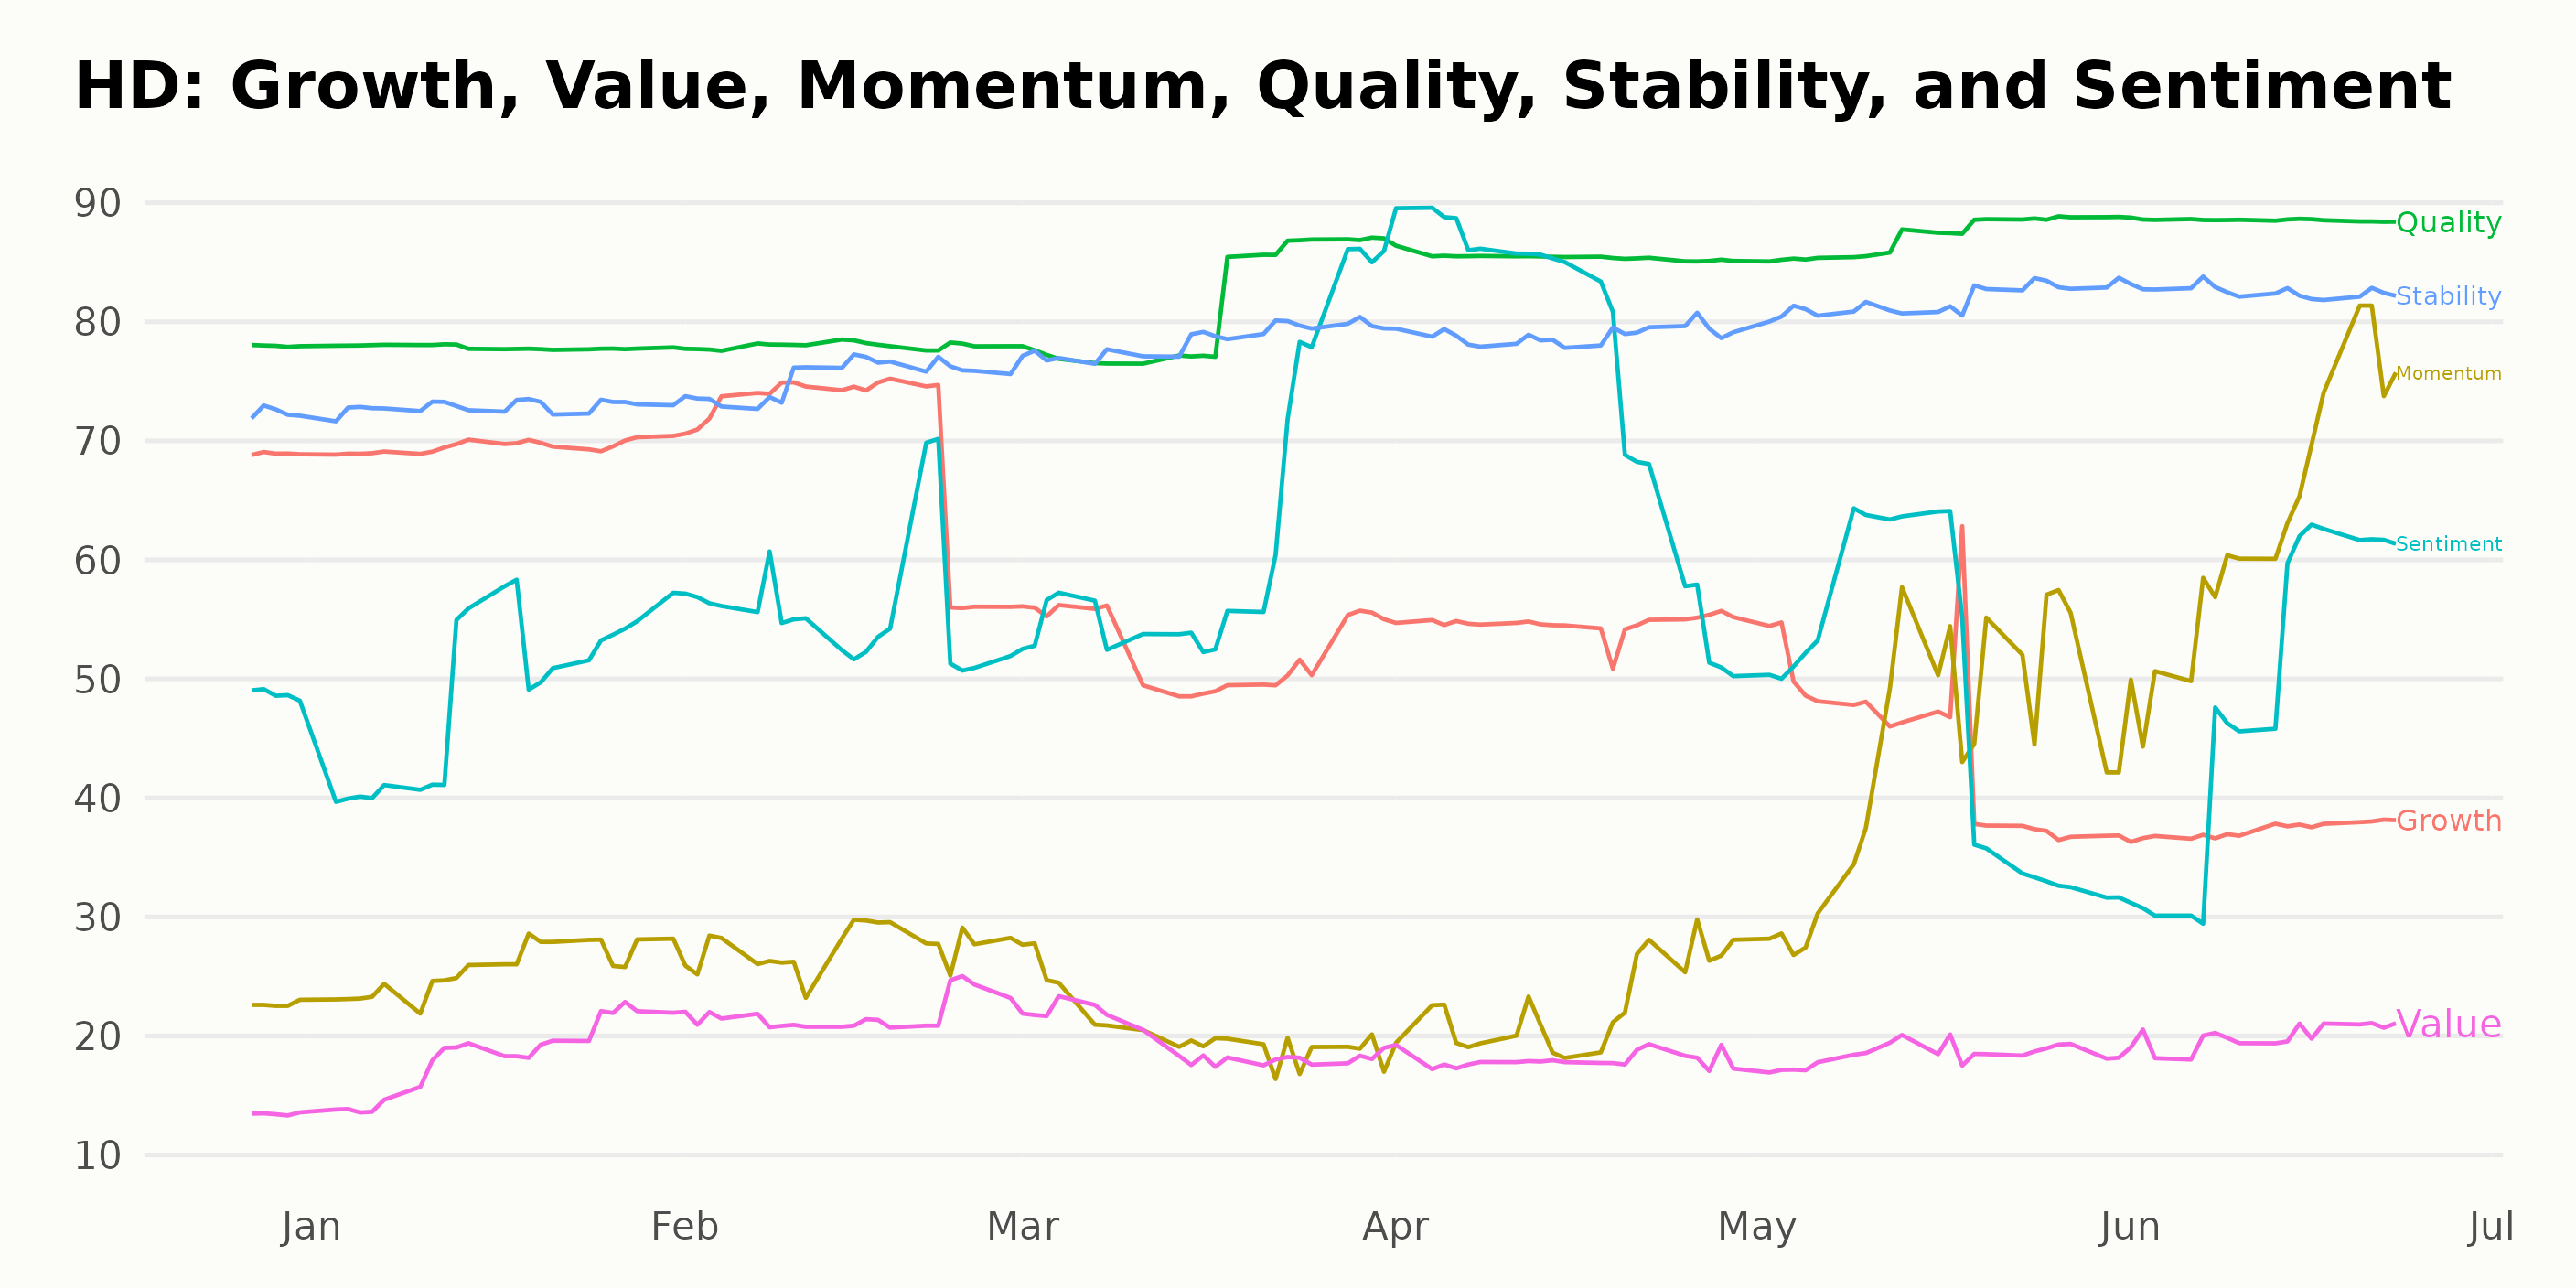
The POWR Ratings for HD showcase its performance along six dimensions. Among these, the three most noteworthy dimensions are Quality, Stability, and Momentum. The highest rating Home Depot received is in the Quality dimension, while there is a clear trend in Momentum. A breakdown of these dimensions over time is as follows:
Quality:
- December 31, 2022: 78
- January 31, 2023: 78
- February 28, 2023: 78
- March 31, 2023: 82
- April 29, 2023: 85
- May 31, 2023: 87
- June 22, 2023: 89
Stability:
- December 31, 2022: 72
- January 31, 2023: 73
- February 28, 2023: 75
- March 31, 2023: 79
- April 29, 2023: 79
- May 31, 2023: 82
- June 22, 2023: 83
Momentum (clear trend): -
- December 31, 2022: 23
- January 31, 2023: 26
- February 28, 2023: 27
- March 31, 2023: 21
- April 29, 2023: 23
- May 31, 2023: 44
- June 22, 2023: 62
In summary, HD has been performing exceptionally well in the Quality and Stability dimensions, with consistent growth in its Quality ratings. In addition, its Momentum ratings have been steadily increasing starting May 2023, showcasing a clear progress in this important dimension.
How does The Home Depot, Inc. (HD) Stack Up Against its Peers?
Other stocks in the Home Improvement & Goods sector that may be worth considering are Bassett Furniture Industries, Incorporated (BSET), Acuity Brands, Inc. (AYI), and Tile Shop Holdings, Inc. (TTSH) - they have better POWR Ratings.
What To Do Next?
Get your hands on this special report with 3 low priced companies with tremendous upside potential even in today’s volatile markets:
3 Stocks to DOUBLE This Year >
HD shares were trading at $301.82 per share on Friday afternoon, up $0.64 (+0.21%). Year-to-date, HD has declined -3.06%, versus a 14.47% rise in the benchmark S&P 500 index during the same period.
About the Author: Anushka Dutta

Anushka is an analyst whose interest in understanding the impact of broader economic changes on financial markets motivated her to pursue a career in investment research.
The post Is Home Depot (HD) a Good Summer Buy? appeared first on StockNews.com