

“PACCAR (Nasdaq: PCAR) reported very good annual revenues and profitability in 2016. PACCAR achieved its 78th consecutive year of net income,” said Ron Armstrong, chief executive officer. “PACCAR’s financial results reflect the company’s premium-quality products and services, increased European truck deliveries, higher truck market share, and good aftermarket parts and PACCAR Financial Services results. I am very proud of our 23,000 employees who have delivered outstanding products and services to our customers.”
This Smart News Release features multimedia. View the full release here: http://www.businesswire.com/news/home/20170131005288/en/

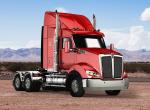
Kenworth T680, Peterbilt Model 579 and DAF XF Trucks (Photo: Business Wire)
PACCAR’s consistent profits and strong cash flow have enabled the company to invest in its core markets while expanding its presence in emerging markets. “PACCAR is well-positioned for long-term growth with investments in new state-of-the-art DAF, Kenworth and Peterbilt vehicles, durable PACCAR engines, innovative aftermarket parts and service capabilities, factory enhancements, and truck technologies that increase vehicle fuel-efficiency and reliability,” added Armstrong.
Very Good Revenue and Net Income
PACCAR achieved fourth quarter 2016 net sales and financial service revenues of $4.07 billion compared to $4.36 billion for the same period in 2015. PACCAR earned $288.8 million ($.82 per diluted share) for the fourth quarter of 2016 compared to $347.2 million ($.98 per diluted share) in the fourth quarter of 2015, which reflects lower truck deliveries in North America. PACCAR achieved revenues of $17.03 billion in 2016 compared to revenues of $19.12 billion in 2015. PACCAR reported net income of $521.7 million ($1.48 per diluted share) in 2016, including an $833.0 million non-tax-deductible, non-recurring charge for a European Commission (EC) settlement. Excluding the non-recurring charge, PACCAR reported adjusted net income (non-GAAP)1 of $1.35 billion ($3.85 per diluted share) in 2016. The company earned $1.60 billion ($4.51 per diluted share) in 2015.
Dividends and Stock Repurchases
PACCAR declared cash dividends of $1.56 per share during 2016, including a special dividend of $.60 per share paid in January 2017. PACCAR has paid a dividend every year since 1941. PACCAR repurchased 1.38 million of its common shares for $70.5 million in 2016. PACCAR’s total shareholder return was 38.3 percent during 2016, compared to the S&P 500 Index return of 11.9 percent. PACCAR’s shareholder return has exceeded the S&P 500 Index return for the previous one-, five-, fifteen- and twenty-year periods.
1 See attached supplementary information for non-GAAP financial measures.
Business Highlights – 2016
- PACCAR delivered 140,900 vehicles worldwide.
- PACCAR invested $649.9 million in capital projects and research and development.
- Kenworth and Peterbilt achieved Class 8 retail market share of 28.5 percent in the U.S. and Canada (27.4 percent in 2015).
- DAF achieved above 16-tonne market share of 15.5 percent in Europe (14.6 percent in 2015).
- PACCAR introduced the PACCAR MX-11 engine in North America.
- PACCAR launched a proprietary PACCAR tandem axle in North America.
- DAF launched the DAF Connect telematics system.
- PACCAR Australia introduced Kenworth’s new T610 truck.
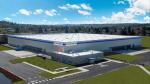
- PACCAR Parts opened a new 160,000 square-foot Parts Distribution Center (PDC) in Renton, Washington.
- PACCAR has implemented over 36,000 Six Sigma projects since 1997.
Financial Highlights – Fourth Quarter 2016
Highlights of PACCAR’s financial results during the fourth quarter of 2016 include:
- Quarterly consolidated net sales and revenues of $4.07 billion.
- Net income of $288.8 million.
- Cash provided by operations of $810.3 million.
- PACCAR Parts pretax income of $137.5 million.
- Research and development expenses of $67.6 million.
- Capital investments of $136.9 million.
- Manufacturing cash and marketable securities of $2.92 billion at December 31, 2016.
Financial Highlights – Full Year 2016
Highlights of PACCAR’s financial results during 2016 include:
- Consolidated net sales and revenues of $17.03 billion.
- Net income of $521.7 million.
- Adjusted net income of $1.35 billion (non-GAAP), excluding an $833.0 million non-recurring charge for the EC settlement.
- PACCAR Parts pretax income of $543.8 million.
- Financial Services pretax income of $306.5 million on assets of $12.19 billion.
- Cash provided by operations of $2.30 billion.
- Dividends declared of $547.9 million.
- Medium-term note (MTN) issuances of $1.94 billion.
- Stockholders’ equity of $6.78 billion.
Global Truck Markets
DAF’s above 16-tonne market share in Europe increased to 15.5 percent in 2016, compared to 14.6 percent last year. “Our customers recognize DAF’s quality leadership, low operating costs and superior driver comfort,” said Preston Feight, DAF president. “European industry truck sales above 16-tonnes were a robust 303,000 trucks in 2016, compared to 269,000 trucks last year. The strong heavy truck market and growth in market share generated record DAF registrations. It is estimated that European truck industry sales in the above 16-tonne market in 2017 will be another strong year in the range of 260,000-290,000 trucks.”
“Class 8 truck industry retail sales in the U.S. and Canada were 216,000 units in 2016, compared to 278,000 vehicles sold in 2015,” said Gary Moore, PACCAR executive vice president. “Truck demand is supported by good economic growth, strong freight tonnage and low fuel prices. PACCAR’s excellent fourth quarter Class 8 retail market share of 30.4 percent in the U.S. and Canada increased its full year 2016 market share to 28.5 percent, compared to 27.4 percent in full year 2015. Customers benefited from Kenworth and Peterbilt vehicles’ industry-leading fuel efficiency and performance.” Estimates for U.S. and Canada Class 8 truck industry retail sales in 2017 are in the range of 190,000-220,000 trucks.
DAF Brasil increased production and market share in 2016 and completed its first year of production of the PACCAR MX-13 engine. “We are pleased that DAF Brasil was honored by Fenabrave, the national industry dealer association in Brasil, as the most desired truck brand in Brasil in 2016,” said Marco Davila, PACCAR vice president.
PACCAR Parts Achieves Excellent Quarterly Results
“PACCAR’s aftermarket parts business achieved fourth quarter pre-tax income of $137.5 million, nine percent higher than the $125.6 million earned in the fourth quarter of 2015,” said David Danforth, PACCAR Parts general manager and PACCAR vice president. “Annual revenues were $3.01 billion and pretax profit was $543.8 million in 2016. PACCAR Parts’ business has been supported by investments in distribution, technology and products. A growing population of Kenworth, Peterbilt and DAF trucks powered by PACCAR engines has contributed to good parts and service business.”
“PACCAR’s 17 PDCs support over 2,100 DAF, Kenworth and Peterbilt dealer locations to deliver industry-leading customer service,” said Laura Bloch, PACCAR Parts assistant general manager. “PACCAR opened a new 160,000 square-foot distribution center in Renton, Washington in 2016 and will begin construction of a new 160,000 square-foot distribution center in Toronto, Canada in 2017.”
PACCAR Australia Launches Kenworth T610 Truck
PACCAR Australia launched the Kenworth T610 truck in the fourth quarter of 2016. The Kenworth T610 represents the largest product investment in PACCAR Australia’s 45-year history. PACCAR engineers designed the Kenworth T610 specifically for Australia’s demanding road transport market. “The new 2.1 meter cab features more driver space, enhanced visibility and excellent ergonomics. The Kenworth T610 delivers industry-leading durability, reliability and fuel efficiency,” said Andrew Hadjikakou, PACCAR Australia general manager.
PACCAR opened its Kenworth plant in Bayswater, Australia in 1971. Kenworth is the industry leader in the above 16-tonne truck market with a market share of 20 percent in 2016. PACCAR Australia employs over 800 people and supports customers through 80 independent dealer locations. PACCAR Australia supports employees’ communities with philanthropic support of leading institutions, such as The University of Melbourne and The Royal Melbourne Hospital.
PACCAR Engine Update
PACCAR has installed over 130,000 PACCAR MX-13 and PACCAR MX-11 engines in Kenworth and Peterbilt trucks in North America since the PACCAR Mississippi engine factory began production in mid-2010. In the fourth quarter of 2016, the PACCAR MX-13 and PACCAR MX-11 engines were installed in 47 percent of Kenworth and Peterbilt heavy-duty trucks in the U.S. and Canada.
Landon Sproull, PACCAR vice president, said, “The PACCAR MX-13 and PACCAR MX-11 engines are designed to deliver optimum performance and fuel economy, industry-leading durability and reliability, and a quiet operating environment for the driver. The 2017 PACCAR MX-13 and PACCAR MX-11 engines include technology enhancements that increase horsepower and torque output, extend service intervals, and provide customers with up to four percent fuel economy gains.”
Increased Investments in Product Development and Aftermarket Support
PACCAR’s consistent profits, strong balance sheet, and intense focus on quality, technology and productivity have enabled the company to invest $6.1 billion in world-class facilities, innovative products and new technologies during the past decade. “Capital of $402.7 million and R&D expenses of $247.2 million were invested in new products and enhanced manufacturing facilities in 2016,” said Harrie Schippers, PACCAR senior vice president. “In 2017, capital expenditures are projected to be $375-$425 million and research and development expenses are estimated to be $250-$280 million. PACCAR is investing for growth in its integrated PACCAR powertrain components, advanced driver assistance and truck connectivity technologies, and enhanced manufacturing and parts distribution facilities.”
DAF is constructing a new $110 million environmentally friendly, robotic cab paint facility at its factory in Westerlo, Belgium, which will increase cab capacity and efficiency, and minimize emissions and energy consumption. The facility is expected to open in mid-2017. “This strategic investment will support DAF’s market share growth and reflects DAF’s leadership in producing high quality vehicles,” noted Preston Feight, DAF president.
Financial Services Companies Achieve Good Annual Results
PACCAR Financial Services (PFS) has a portfolio of 178,000 trucks and trailers, with total assets of $12.19 billion. PacLease, a major full-service truck leasing company in North America and Europe with a fleet of over 38,000 vehicles, is included in this segment. “PFS portfolio performance contributed to good results in 2016,” said Bob Bengston, PACCAR senior vice president. PFS achieved fourth quarter 2016 pretax income of $77.9 million compared to $89.9 million earned in the fourth quarter of 2015. Fourth quarter 2016 revenues were $303.7 million compared to $292.8 million in the same quarter of 2015. PFS earned $306.5 million of pretax profit in 2016 compared to $362.6 million in 2015, and revenues were $1.19 billion in 2016 compared to $1.17 billion in 2015.
“PACCAR’s strong balance sheet, complemented by its A+/A1 credit ratings, enables PFS to offer competitive retail financing to Kenworth, Peterbilt and DAF dealers and customers in 23 countries on four continents,” said Todd Hubbard, PACCAR Financial Corp. president. PACCAR Financial Services has excellent access to the debt markets, issuing $1.94 billion in three- and five-year term notes during 2016.
PACCAR is a global technology leader in the design, manufacture and customer support of high-quality light-, medium- and heavy-duty trucks under the Kenworth, Peterbilt and DAF nameplates. PACCAR also designs and manufactures advanced diesel engines, provides financial services and information technology, and distributes truck parts related to its principal business.
PACCAR will hold a conference call with securities analysts to discuss fourth quarter earnings on January 31, 2017, at 9:00 a.m. Pacific time. Interested parties may listen to the call by selecting “Q4 Earnings Webcast” at PACCAR’s homepage. The Webcast will be available on a recorded basis through February 7, 2017. PACCAR shares are traded on the Nasdaq Global Select Market, symbol PCAR. Its homepage is www.paccar.com.
This release contains “forward-looking statements” within the meaning of the Private Securities Litigation Reform Act. These statements are based on management’s current expectations and are subject to uncertainty and changes in circumstances. Actual results may differ materially from those included in these statements due to a variety of factors. More information about these factors is contained in PACCAR’s filings with the Securities and Exchange Commission.
| PACCAR Inc | |||||||||||||||||
| SUMMARY STATEMENTS OF OPERATIONS | |||||||||||||||||
| (in millions except per share amounts) | |||||||||||||||||
| Three Months Ended | Year Ended | ||||||||||||||||
| December 31 | December 31 | ||||||||||||||||
| 2016 | 2015 | 2016 | 2015 | ||||||||||||||
| Truck, Parts and Other: | |||||||||||||||||
| Net sales and revenues | $ | 3,767.0 | $ | 4,062.5 | $ | 15,846.6 | $ | 17,942.8 | |||||||||
| Cost of sales and revenues | 3,243.2 | 3,469.4 | 13,517.7 | 15,292.1 | |||||||||||||
| Research and development | 67.6 | 66.7 | 247.2 | 239.8 | |||||||||||||
| Selling, general and administrative | 114.8 | 121.2 | 440.8 | 445.9 | |||||||||||||
| European Commission charge | 833.0 | ||||||||||||||||
| Interest and other expense, net | 7.4 | 1.6 | 11.6 | 12.3 | |||||||||||||
| Truck, Parts and Other Income Before Income Taxes | 334.0 | 403.6 | 796.3 | 1,952.7 | |||||||||||||
| Financial Services: | |||||||||||||||||
| Revenues | 303.7 | 292.8 | 1,186.7 | 1,172.3 | |||||||||||||
| Interest and other | 197.4 | 175.0 | 762.4 | 701.7 | |||||||||||||
| Selling, general and administrative | 24.5 | 24.2 | 99.4 | 95.6 | |||||||||||||
| Provision for losses on receivables | 3.9 | 3.7 | 18.4 | 12.4 | |||||||||||||
| Financial Services Income Before Income Taxes | 77.9 | 89.9 | 306.5 | 362.6 | |||||||||||||
| Investment income | 7.0 | 5.2 | 27.6 | 21.8 | |||||||||||||
| Total Income Before Income Taxes | 418.9 | 498.7 | 1,130.4 | 2,337.1 | |||||||||||||
| Income taxes | 130.1 | 151.5 | 608.7 | 733.1 | |||||||||||||
| Net Income | $ | 288.8 | $ | 347.2 | $ | 521.7 | $ | 1,604.0 | |||||||||
| Net Income Per Share: | |||||||||||||||||
| Basic | $ | .82 | $ | .98 | $ | 1.49 | $ | 4.52 | |||||||||
| Diluted | $ | .82 | $ | .98 | $ | 1.48 | $ | 4.51 | |||||||||
| Weighted Average Shares Outstanding: | |||||||||||||||||
| Basic | 351.1 | 353.2 | 351.1 | 354.6 | |||||||||||||
| Diluted | 351.9 | 353.9 | 351.8 | 355.6 | |||||||||||||
| Dividends declared per share | $ | .84 | $ | 1.64 | $ | 1.56 | $ | 2.32 | |||||||||
| PACCAR Inc | |||||||||
| CONDENSED BALANCE SHEETS | |||||||||
| (in millions) | |||||||||
| December 31 | December 31 | ||||||||
| 2016 | 2015 | ||||||||
| ASSETS | |||||||||
| Truck, Parts and Other: | |||||||||
| Cash and marketable debt securities | $ | 2,922.6 | $ | 3,378.0 | |||||
| Trade and other receivables, net | 862.2 | 879.0 | |||||||
| Inventories, net | 727.8 | 796.5 | |||||||
| Property, plant and equipment, net | 2,260.0 | 2,176.4 | |||||||
| Equipment on operating leases and other, net | 1,671.5 | 1,625.3 | |||||||
| Financial Services Assets | 12,194.8 | 12,254.6 | |||||||
| $ | 20,638.9 | $ | 21,109.8 | ||||||
| LIABILITIES AND STOCKHOLDERS' EQUITY | |||||||||
| Truck, Parts and Other: | |||||||||
| Accounts payable, deferred revenues and other | $ | 4,056.2 | $ | 4,331.9 | |||||
| Financial Services Liabilities | 9,805.1 | 9,837.5 | |||||||
| STOCKHOLDERS' EQUITY | 6,777.6 | 6,940.4 | |||||||
| $ | 20,638.9 | $ | 21,109.8 | ||||||
| Common Shares Outstanding | 350.7 | 351.3 | |||||||
| PACCAR Inc | |||||||||||
| CONDENSED CASH FLOW STATEMENTS | |||||||||||
| (in millions) | |||||||||||
| Year Ended December 31 | 2016 | 2015 | |||||||||
| OPERATING ACTIVITIES: | |||||||||||
| Net income | $ | 521.7 | $ | 1,604.0 | |||||||
| Depreciation and amortization: | |||||||||||
| Property, plant and equipment | 302.4 | 292.2 | |||||||||
| Equipment on operating leases and other | 690.7 | 614.9 | |||||||||
| Net change in trade receivables, inventory and payables | (6.3 | ) | 7.0 | ||||||||
| Net decrease (increase) in wholesale receivables on new trucks | 401.6 | (273.4 | ) | ||||||||
| All other operating activities, net | 390.7 | 311.3 | |||||||||
| Net Cash Provided by Operating Activities | 2,300.8 | 2,556.0 | |||||||||
| INVESTING ACTIVITIES: | |||||||||||
| Payments for property, plant and equipment | (375.2 | ) | (286.7 | ) | |||||||
| Acquisitions of equipment for operating leases | (1,589.7 | ) | (1,438.5 | ) | |||||||
| Net increase in financial services receivables | (306.6 | ) | (407.3 | ) | |||||||
| Net decrease (increase) in marketable securities | 272.9 | (294.3 | ) | ||||||||
| Proceeds from asset disposals and other | 434.3 | 451.9 | |||||||||
| Net Cash Used in Investing Activities | (1,564.3 | ) | (1,974.9 | ) | |||||||
| FINANCING ACTIVITIES: | |||||||||||
| Payments of cash dividends | (829.3 | ) | (680.5 | ) | |||||||
| Purchases of treasury stock | (70.5 | ) | (201.6 | ) | |||||||
| Proceeds from stock compensation transactions | 29.4 | 21.8 | |||||||||
| Net increase in debt | 46.9 | 663.8 | |||||||||
| Net Cash Used in Financing Activities | (823.5 | ) | (196.5 | ) | |||||||
| Effect of exchange rate changes on cash | (13.7 | ) | (105.8 | ) | |||||||
| Net (Decrease) Increase in Cash and Cash Equivalents | (100.7 | ) | 278.8 | ||||||||
| Cash and cash equivalents at beginning of period | 2,016.4 | 1,737.6 | |||||||||
| Cash and cash equivalents at end of period | $ | 1,915.7 | $ | 2,016.4 | |||||||
| PACCAR Inc | |||||||||||||||||||||
| SEGMENT AND OTHER INFORMATION | |||||||||||||||||||||
| (in millions) | |||||||||||||||||||||
| Three Months Ended | Year Ended | ||||||||||||||||||||
| December 31 | December 31 | ||||||||||||||||||||
| 2016 | 2015 | 2016 | 2015 | ||||||||||||||||||
| Sales and Revenues: | |||||||||||||||||||||
| Truck | $ | 2,984.9 | $ | 3,285.3 | $ | 12,767.3 | $ | 14,782.5 | |||||||||||||
| Parts | 765.0 | 752.9 | 3,005.7 | 3,060.1 | |||||||||||||||||
| Financial Services | 303.7 | 292.8 | 1,186.7 | 1,172.3 | |||||||||||||||||
| Other | 17.1 | 24.3 | 73.6 | 100.2 | |||||||||||||||||
| $ | 4,070.7 | $ | 4,355.3 | $ | 17,033.3 | $ | 19,115.1 | ||||||||||||||
| Pretax Profit: | |||||||||||||||||||||
| Truck | $ | 207.4 | $ | 292.8 | $ | 1,125.8 | $ | 1,440.3 | |||||||||||||
| Parts | 137.5 | 125.6 | 543.8 | 555.6 | |||||||||||||||||
| Financial Services | 77.9 | 89.9 | 306.5 | 362.6 | |||||||||||||||||
| European Commission Charge | (833.0 | ) | |||||||||||||||||||
| Investment Income and Other | (3.9 | ) | (9.6 | ) | (12.7 | ) | (21.4 | ) | |||||||||||||
| $ | 418.9 | $ | 498.7 | $ | 1,130.4 | $ | 2,337.1 | ||||||||||||||
| GEOGRAPHIC REVENUE | |||||||||||||||||||||
| (in millions) | |||||||||||||||||||||
| Three Months Ended | Year Ended | ||||||||||||||||||||
| December 31 | December 31 | ||||||||||||||||||||
| 2016 | 2015 | 2016 | 2015 | ||||||||||||||||||
| United States and Canada | $ | 2,197.6 | $ | 2,457.7 | $ | 10,065.9 | $ | 12,521.8 | |||||||||||||
| Europe | 1,302.0 | 1,345.6 | 4,903.3 | 4,515.9 | |||||||||||||||||
| Other | 571.1 | 552.0 | 2,064.1 | 2,077.4 | |||||||||||||||||
| $ | 4,070.7 | $ | 4,355.3 | $ | 17,033.3 | $ | 19,115.1 | ||||||||||||||
| NEW TRUCK DELIVERIES | |||||||||||||||||||||
| Three Months Ended | Year Ended | ||||||||||||||||||||
| December 31 | December 31 | ||||||||||||||||||||
| 2016 | 2015 | 2016 | 2015 | ||||||||||||||||||
| United States and Canada | 14,400 | 15,900 | 71,500 | 91,300 | |||||||||||||||||
| Europe | 14,800 | 15,000 | 53,000 | 47,400 | |||||||||||||||||
| Other | 4,700 | 4,500 | 16,400 | 16,000 | |||||||||||||||||
| 33,900 | 35,400 | 140,900 | 154,700 | ||||||||||||||||||
| PACCAR Inc |
| SUPPLEMENTARY INFORMATION |
| RECONCILIATION OF GAAP TO NON-GAAP FINANCIAL MEASURES |
| This earnings release includes “adjusted net income (non-GAAP)” and “adjusted net income per diluted share (non-GAAP)”, which are financial measures that are not in accordance with U.S. generally accepted accounting principles (“GAAP”), since they exclude the non-recurring European Commission charge. These measures differ from the most directly comparable measures calculated in accordance with GAAP and may not be comparable to similarly titled non-GAAP financial measures used by other companies. |
| Management utilizes these non-GAAP measures to evaluate the Company’s performance and believes these measures allow investors and management to evaluate operating trends by excluding a significant non-recurring charge that is not representative of underlying operating trends. |
| Reconciliations from the most directly comparable GAAP measures to adjusted net income (non-GAAP) and adjusted net income per diluted share (non-GAAP) are as follows: |
| Year Ended | |||||
| (in millions) | December 31, 2016 | ||||
| Net Income | $ | 521.7 | |||
| Non-recurring European Commission Charge | 833.0 | ||||
| Adjusted Net Income (Non-GAAP) | $ | 1,354.7 | |||
| Year Ended | |||||
| December 31, 2016 | |||||
| Per Diluted Share: | |||||
| Net Income | $ | 1.48 | |||
| Non-recurring European Commission Charge | 2.37 | ||||
| Adjusted Net Income (Non-GAAP) | $ | 3.85 | |||
View source version on businesswire.com: http://www.businesswire.com/news/home/20170131005288/en/
Contacts:
Ken Hastings, 425-468-7530