Nine months into 2021, home prices across the United States continue to climb at record pace.
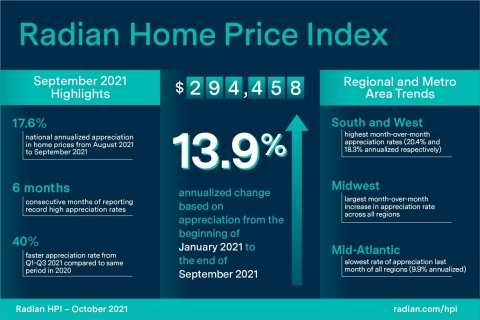
In September, home prices appreciated nationally at an annualized 17.6 percent from the prior month. This marks the sixth consecutive month of reporting an all-time record month-over-month rate, according to Radian Home Price Index (HPI) data released today by Red Bell Real Estate, LLC, a Radian Group Inc. company (NYSE: RDN). The company believes the Radian HPI is the most comprehensive and timely measure of U.S. housing market prices and conditions available in the market today.
This press release features multimedia. View the full release here: https://www.businesswire.com/news/home/20211103006224/en/
Radian Home Price Index (HPI) Infographic October 2021 (Graphic: Business Wire)
The Radian HPI has risen at an annualized rate of 13.9 percent over the nine-month period (January to September 2021), which is nearly 40-percent higher than the rate of the same period in 2020. Over the past year the median national estimate is 12.1 percent higher. These annualized increases represent the continuation of the general upward trend in home price gains with faster acceleration coming in more recent months. The Radian HPI is calculated based on the estimated values of more than 70 million unique addresses each month, covering all single-family property types and geographies.
“Given the rapid rise in home prices over a relatively short period of time, the Radian HPI is constantly mining the data to find signs of a shift in current housing strength--and so far, it seems to be heading in one direction,” noted Steve Gaenzler, SVP of Data and Analytics. “While there are some indications that affordability may be starting to place strain on certain home buyers, the limited supply is a strong support for home price growth.” Gaenzler added that, “ultimately while bidding wars may be reducing in frequency, sellers are still receiving above list price offers in many situations.”
NATIONAL DATA AND TRENDS
- Median estimated home price in the U.S. rose to $294,488
- Sales represent a high percentage of listings
Nationally, the median estimated price for single-family and condominium homes rose to $294,488. Since the onset of the pandemic in March 2020, homes across the U.S. have appreciated, on average, by more than $41,000 significantly adding to borrower home equity for mortgage holders.
The number of homes for sale fell from August to September. However, while falling listing counts is not uncommon in the U.S. after the summer season, the number of homes actively listed for sale in the U.S this month stood at the lowest level for any ninth month (September) over the last 13 years (Chart: Right Axis). In contrast to the continued shortage of available properties for sale, and despite the significant increase in home prices recently, the demand for properties continues to grow. In September 2021, the percent of homes purchased as a percentage of the number of homes listed for sale stood at 34 percent. This is nearly double the average monthly absorption rate for the 180 months (15 years) prior to the onset of the COVID-19 pandemic (Chart: Left Axis).
REGIONAL DATA AND TRENDS
- All Regions reported faster appreciation rates than prior month
- South and West show the strongest overall appreciation rates for the third straight month
In September, all six Regional indices recorded higher annual home price appreciation rates than the prior month. The South and West regions recorded the strongest annualized one-month appreciation rates for the third consecutive month (20.4 and 18.3 percent respectively). While the South and West recorded the highest overall appreciation rates, the Midwest reported the largest month over month increase in appreciation rate at 242 basis points higher than the prior month (16.2 vs. 13.8 percent). Of note, September has been the month with the fastest, annualized one-month appreciation rate for both 2020 and 2021, the pandemic years.
Over the last year, the Mid-Atlantic region has posted the slowest appreciation rate of all regions (9.9 percent) and was the only region to report a slower appreciation rate in September 2021 compared to the prior month.
Home prices continue to be supported by a lack of supply. Months of Supply, which is measured as the current month’s active listings divided by last month's sales, fell last month and settled at 2.71 months. This was the fourth lowest ratio on record and only slightly higher than the all-time record low ratio of 2.49 months measured in January of this year.
METROPOLITAN AREA DATA AND TRENDS
- Appreciation rates rise in a majority of largest metro areas
- Large cities are becoming less affordable faster than smaller cities
Among the 20-largest metropolitan areas of the U.S, more than half of them (13) recorded faster annual (12-month) price appreciation in September when compared to the prior month. Of the seven metros that did not record faster annual appreciation rates this month, for all but two of them, September was still faster than any month other than August making their decrease inconclusive as to a shift in market strength or the start of a decline in appreciation rates.
Appreciation rates have been strong broadly across metro markets. Whether higher priced or lower priced, homes are appreciating at largely, similar rates. As such, when comparing appreciation by median home price level, the difference between the median price in the most expensive and least expensive housing market has widened over the past few years.
ABOUT THE RADIAN HPI
Red Bell Real Estate, LLC, a subsidiary of Radian Group Inc., provides national and regional indices for download at radian.com/hpi, along with information on how to access the full library of indices.
Additional content on the housing market can also be found on the Radian Insights page located at https://radian.com/news-and-knowledge/insights.
Red Bell offers the Radian HPI data set along with a client access portal for content visualization and data extraction. The engine behind the Radian HPI has created more than 100,000 unique data series, which are updated on a monthly basis.
The Radian HPI Portal is a self-service data and visualization platform that contains a library of thousands of high-value indices based on both geographic dimensions as well as by market, or property attributes. The platform provides monthly updated access to nine different geographic dimensions, from the national level down to zip codes. In addition, the Radian HPI provides unique insights into market changes, conditions and strength across multiple property attributes, including bedroom count and livable square footage. To help enhance customers’ understanding of granular real estate markets, the library is expanded regularly to include more insightful indices.
In addition to the services offered by its Red Bell subsidiary, Radian is ensuring the American dream of homeownership responsibly and sustainably through products and services that include industry-leading mortgage insurance and a comprehensive suite of mortgage, risk, title, valuation, asset management and other real estate services. The company is powered by technology, informed by data and driven to deliver new and better ways to transact and manage risk.
Visit http://www.radian.com to see how Radian is shaping the future of mortgage and real estate services.
View source version on businesswire.com: https://www.businesswire.com/news/home/20211103006224/en/
Contacts
For Investors
John Damian – Phone: 215.231.1383
Email: john.damian@radian.com
For the Media
Rashi Iyer – Phone: 215.231.1167
Email: rashi.iyer@radian.com


