According to Radian Home Price Index (HPI) data released today by Red Bell Real Estate, LLC, a Radian Group Inc. company (NYSE: RDN), home prices nationally rose from the end of November 2021 to the end of December 2021 at an annualized rate of 15.9 percent, and December 2021 marked the tenth consecutive month in which month-over-month home prices rose more than 10 percent on an annualized basis. The company believes the Radian HPI is the most comprehensive and timely measure of U.S. housing market prices and conditions.
This press release features multimedia. View the full release here: https://www.businesswire.com/news/home/20220127005217/en/
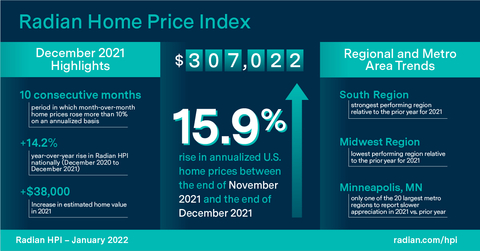
Radian Home Price Index (HPI) Infographic, January 2022 (Graphic: Business Wire)
For the full year, the Radian HPI rose 14.2 percent year-over-year (December 2020 to December 2021). In 2021, the 12-month rate of appreciation nationally was nearly double the rate of 8.0 percent set in 2020. Unlike 2020, which was marked by a slow first half and a robust second half, price appreciation strengthened steadily over the course of 2021. During the first six months of 2021, annualized appreciation was 10.6 percent, the strongest Radian HPI had recorded to date. Not to be outdone, the last six months of 2021 were even stronger; annualized appreciation was 16.9 percent. The Radian HPI is calculated based on the estimated values of more than 70 million unique addresses each month, covering all single-family property types and geographies.
For the calendar year, national real estate records were broken in several important categories.
National Records Broken in 2021:
Record (annual) |
Prior Record (2020) |
2021 Record |
10-year average |
Average Sales Price |
$381K |
$457K |
$320K |
Median Estimated Price |
$268K (12/2020) |
$307K (12/2021) |
|
Days on Market (1mo) |
93 |
75 |
108 |
Number of Closed Sales |
3.66mm |
3.77mm |
3.10mm |
Average Monthly Listings |
1.16mm |
0.92mm |
1.39mm |
“2021 was nothing short of spectacular for U.S. home values,” said Steve Gaenzler, SVP of Product, Data and Analytics. “The median owner saw an estimated increase of more than $38,000 in their home value, creating trillions of dollars in potential borrower equity. However, the market remains tough for many would-be buyers – competition is fierce, supply is low, entry-level options are more limited than ever before, and for the first time, more than one-quarter of homes sold cost $500,000 or more.”
NATIONAL DATA AND TRENDS
- Median estimated home price in the U.S. rose to $307,022
- Home prices rose an annualized 17.0 percent during the final quarter
Radian HPI’s national median estimated price for single-family and condominium homes reflects the median of the projections on more than 70 million residential homes, the broadest representation of U.S. housing stock value. Other popular measures, such as the Average Sales Price only consider the much narrower population of actual sales, and not the housing stock as a whole. While both measures are at record levels, current data indicate that higher priced homes have dominated sales during COVID, pushing the average sales price up much faster than the housing stock’s true median value.
In December 2021, homes that sold for prices greater than $500,000 represented 28 percent of all sales. Just two years earlier, those homes accounted for only 16 percent of all sales. Contrast that to lower priced homes, those selling below $250,000, which accounted for 18 percent of all sales two years ago but represented only 11 percent of all sales nationally last month. Mobility of more affluent borrowers has pushed performance on this segment relative to those homeowners more adversely impacted economically by the pandemic.
Nationally, 2021 recorded both historic low average monthly listing counts (supply) and record high sales volume (demand), as homes moved very efficiently through the real estate process. A review of the year by home price reveals some interesting trends. In 2021, Radian HPI recorded more than 3.7 million closed transactions, the highest ever recorded and besting the record of 3.6 million set in 2020. Unfortunately for buyers, the supply of homes has collapsed at the same time record sales are being recorded. In fact, in December 2021, the number of actively listed homes for sale was at the lowest level ever recorded (since the Radian HPI began tracking in 2007). At only 708,000 active listings, December’s inventory was more than -15 percent below the next lowest December (2020, 845k) and a whopping 40 percent below the average of the winter months (Nov-Feb).
The result of these record trends has been the continued rise in home prices. Across the U.S., home prices nationally rose 17.0 percent in the final quarter, the strongest quarter of the year and a strong increase over the first, second and third quarter annualized appreciation rates of 9.4, 11.7 and 16.3 percent respectively. Strong demand for limited supply continues to keep the average number of days that a property for sale is listed before going under contract at near record lows. In December, the average days on market for sold homes was 77 days, an increase of four days from the prior month and 10 days longer than the all-time record set in July and August of 2021 (67 days).
“One year ago, the housing supply shortage was dire. Since then, it has only gotten worse,” said Gaenzler. “The combination of limited supply and record-high demand has buoyed prices and shrunk the time it takes for homes to sell, but it has also made it a very difficult market for many potential buyers.”
REGIONAL DATA AND TRENDS
- Ten states posted greater than 20% appreciation rates in December
- From year earlier, South is strongest Region
Regionally, all six regions had stronger home price appreciation in 2021 than they did in 2020. The South was the strongest performing region relative to the prior year notching a nearly doubling of the full year appreciation rates (16.9 percent vs.8.5 percent). The South’s 16.9 percent annual appreciation was also the highest absolute regional appreciation rate for 2021. The strongest performing region of 2020, the Midwest, became the worst performer relative to the prior year, recording a 12.1 percent home price appreciation rate, an increase of only 33 percent above the full year rate of 9.1 percent in 2020. On an absolute basis, the MidAtlantic region recorded the slowest annual appreciation rate amongst the regions at +11.3 percent.
Pace of home price appreciation differs by state, but all 50 states recorded positive home price appreciation in 2021. In fact, while December tends to be a seasonally slower month, 10 states, all in the South region, still managed to record annualized one-month appreciation rates greater than +20 percent (GA, NC, SC, FL, MS, MT, UT, VT, ME, AZ).
METROPOLITAN AREA DATA AND TRENDS
- Largest metropolitan areas appreciate more slowly than nation in 2021
- 2021 is on pace to be one of the most active on record
All the 20 largest metro areas of the U.S recorded positive price appreciation, and all but one recorded faster annual appreciation in 2021 relative to the prior year. Minneapolis was the only one of the 20 largest metros to record slower appreciation rates in 2021. For the remaining 19 metros where home prices rose faster in 2021 than 2020, they averaged 50 percent faster appreciation rates. On an absolute basis, annual appreciation across the top 20 finished the year at 9.8 percent. Three metro areas, Seattle, WA, Phoenix, AZ, and Tampa, FL recorded price appreciation rates faster than the national average of +14.2. The remaining large metros recorded appreciation below the national average. The average median estimated home price in the 20 largest metros is higher by more than $37,092 over the last 12 months, slightly below the national average gain of $38,367.
ABOUT THE RADIAN HPI
Red Bell Real Estate, LLC, a subsidiary of Radian Group Inc., provides national and regional indices for download at info.radian.com/hpi, along with information on how to access the full library of indices.
Additional content on the housing market can also be found on the Radian Insights page located at https://radian.com/news-and-knowledge/insights.
Red Bell offers the Radian HPI data set along with a info.radian.com/hpi for content visualization and data extraction. The engine behind the Radian HPI has created more than 100,000 unique data series, which are updated on a monthly basis.
The Radian HPI Portal is a self-service data and visualization platform that contains a library of thousands of high-value indices based on both geographic dimensions as well as by market, or property attributes. The platform provides monthly updated access to nine different geographic dimensions, from the national level down to zip codes. In addition, the Radian HPI provides unique insights into market changes, conditions and strength across multiple property attributes, including bedroom count and livable square footage. To help enhance its customers’ understanding of granular real estate markets, the library is expanded regularly to include more insightful indices.
In addition to the services offered by its Red Bell subsidiary, Radian is ensuring the American dream of homeownership responsibly and sustainably through products and services that include industry-leading mortgage insurance and a comprehensive suite of mortgage, risk, title, valuation, asset management and other real estate services. The company is powered by technology, informed by data and driven to deliver new and better ways to transact and manage risk. Visit www.radian.com to see how Radian is shaping the future of mortgage and real estate services.
View source version on businesswire.com: https://www.businesswire.com/news/home/20220127005217/en/
Contacts
For Investors
John Damian – Phone: 215.231.1383
Email: john.damian@radian.com
For the Media
Rashi Iyer – Phone: 215.231.1167
Email: rashi.iyer@radian.com


