Digital insurance provider Lemonade (NYSE: LMND) reported Q3 2026 results beating Wall Street’s revenue expectations, with revenue up 72.8% year on year to $336.1 million. The company expects next quarter’s revenue to be around $344 million, close to analysts’ consensus estimates. Its GAAP loss of $0.56 per share was 3.1% above analysts’ consensus estimates.
For more on Lemonade, read our free full research report.
Lemonade (LMND) Q3 2026 highlights:
- Net premiums earned $294.8 million vs analysts’ consensus estimates of $280.2 million (111% year-on-year growth, 5.2% beat)
- Revenue $336.1 million vs S&P analysts’ consensus estimates of $323.7 million (72.8% year-on-year growth, 3.8% beat)
- Pre-tax profit -$43.2 million (-12.9% margin)
- EPS (GAAP) -$0.56 vs analysts’ consensus estimates of -$0.58 (3.1% beat)
- Revenue guidance $344 million at the midpoint for Q4 2026, roughly in line with what analysts were expecting
- Market capitalization $3.55 billion
Revenue growth
Insurance companies generate revenue three ways. The first is the core insurance business itself, represented in the income statement as premiums earned. The second source is investment income from investing the “float” (premiums collected but not yet paid out as claims) in assets such as fixed-income assets and equities. The third is fees from policy administration, annuities and other value-added services. Lemonade’s 59.6% annualized revenue growth over the last five years was strong. Its growth beat the average insurance company and shows its offerings resonate with customers.
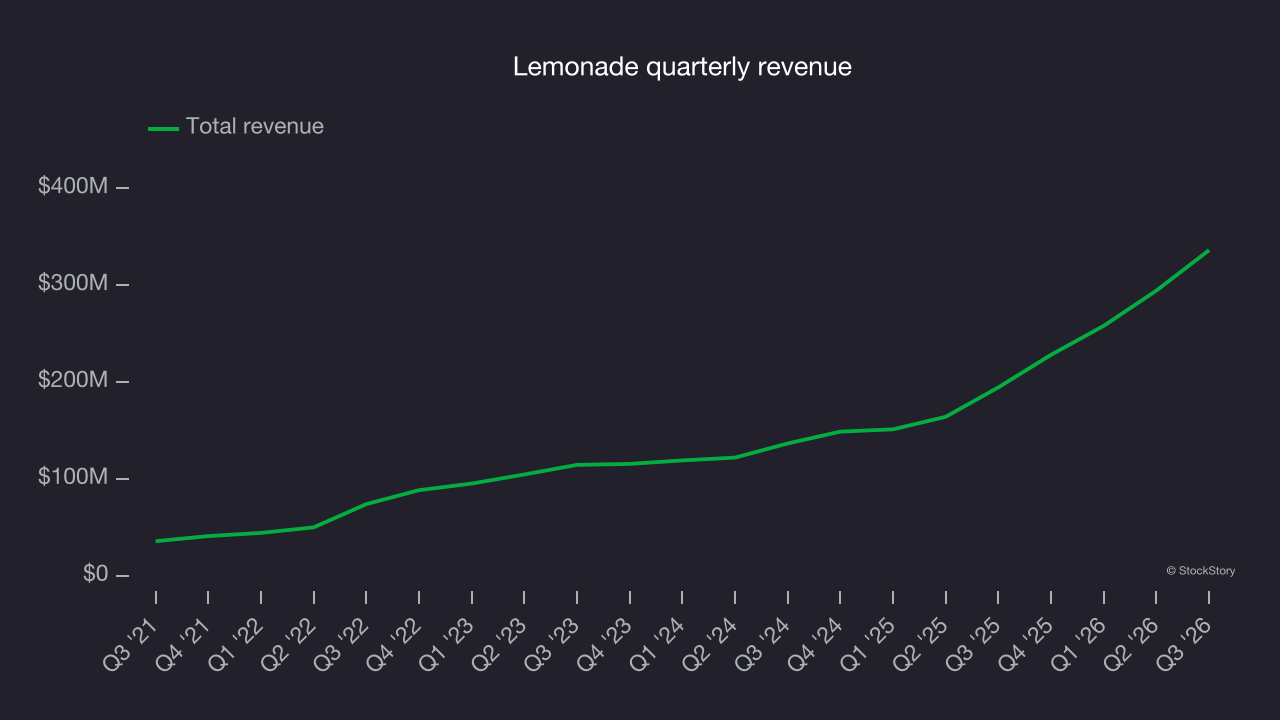
Long-term growth is the most important, but within financials, a half-decade historical view may miss recent interest rate changes and market returns. Lemonade’s annualized revenue growth of 50.5% over the last two years is below its five-year trend, but the results still suggest healthy demand.
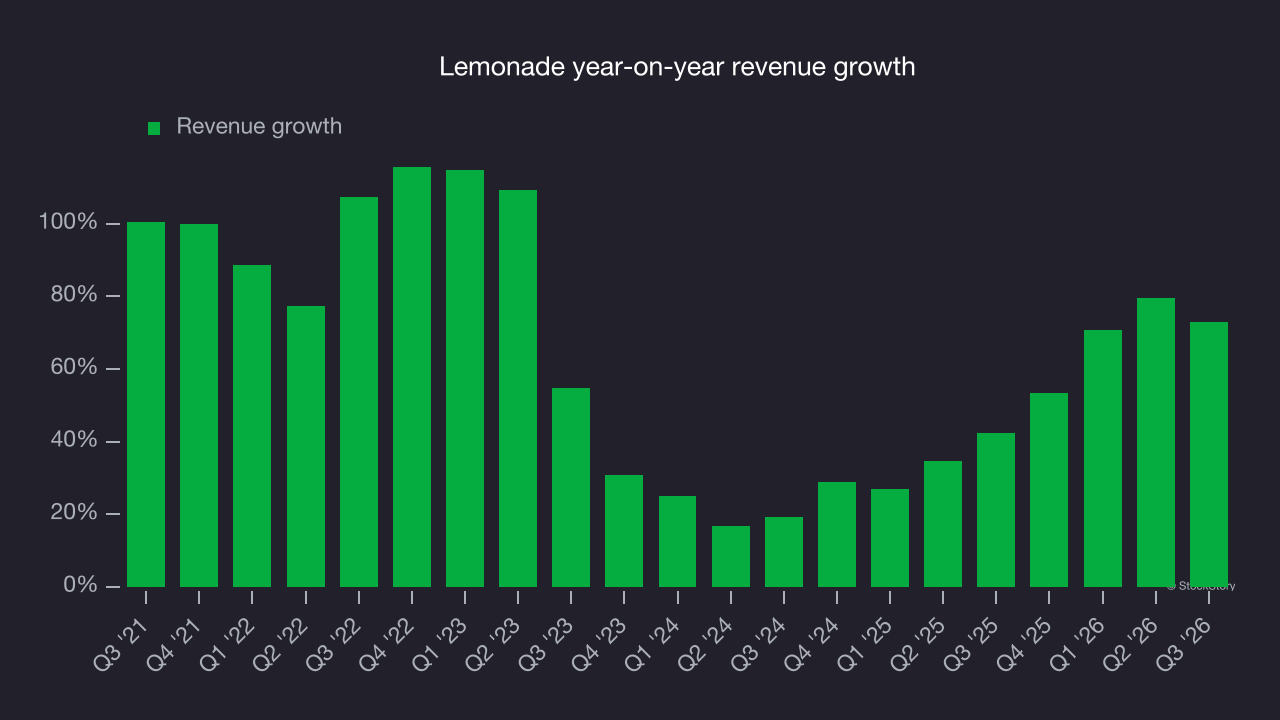
This quarter, Lemonade reported strong year-on-year revenue growth of 72.8%, and its $336.1 million of revenue beat Wall Street’s consensus estimates by 3.8%. Company management is currently guiding for a 50.8% year-on-year increase in revenue next quarter.
Net premiums earned made up 75.7% of the company’s total revenue during the last five years, meaning insurance operations are Lemonade’s largest source of revenue.
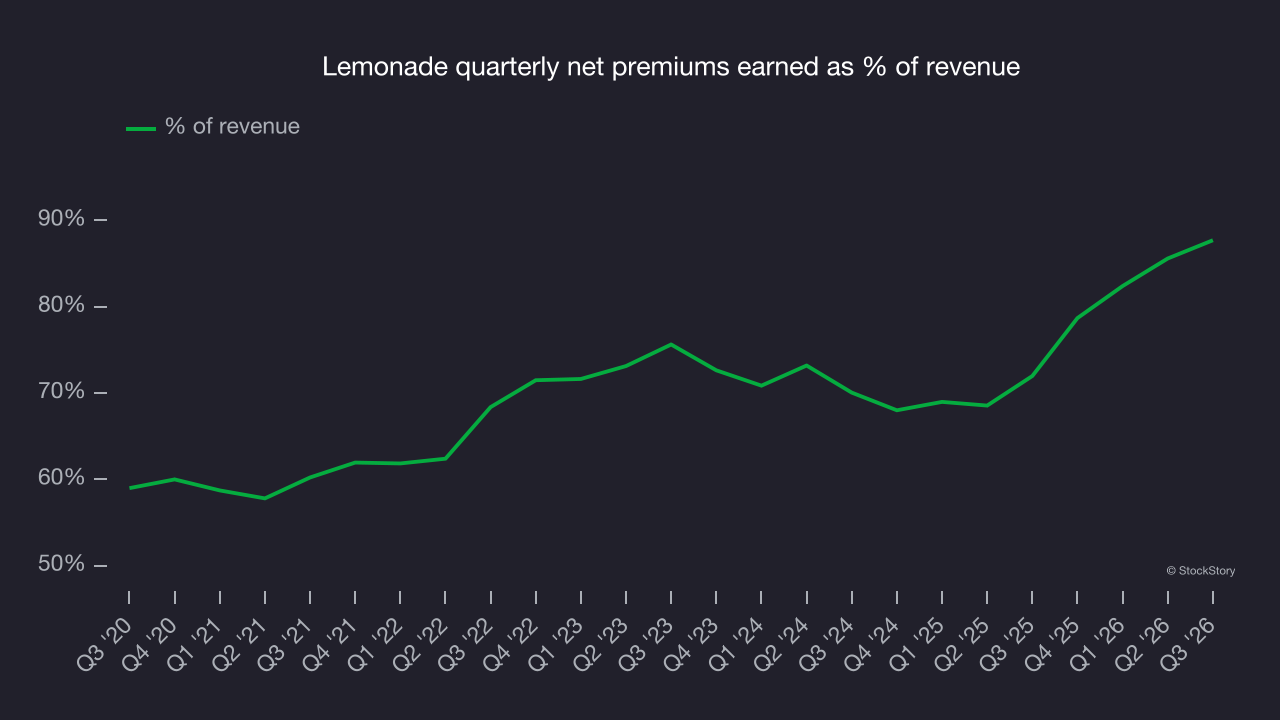
Net premiums earned command greater market attention due to their reliability and consistency, whereas investment and fee income are often seen as more volatile revenue streams that fluctuate with market conditions.
Net premiums earned
When insurers sell policies, they protect themselves from large losses or an outsized accumulation of losses with reinsurance (insurance for insurance companies). Net premiums earned are calculated as follows:
- Gross premiums - what’s ceded to reinsurers as a risk mitigation and transfer strategy
Lemonade’s net premiums earned have grown at a 71.2% annualized rate over the last five years, much faster than the broader insurance industry and faster than its total revenue.
Growth in Lemonade’s net premiums earned decelerated to 63% annually over the last two years. Net premiums earned outpaced total revenue over this period, indicating that other line items such as investment income grew at a slower rate. While these additional streams contribute to the bottom line, their impact can vary. Some firms have shown greater success and long-term consistency in investing their float compared to peers. However, sharp fluctuations in the fixed income and equity markets can significantly affect short-term performance.
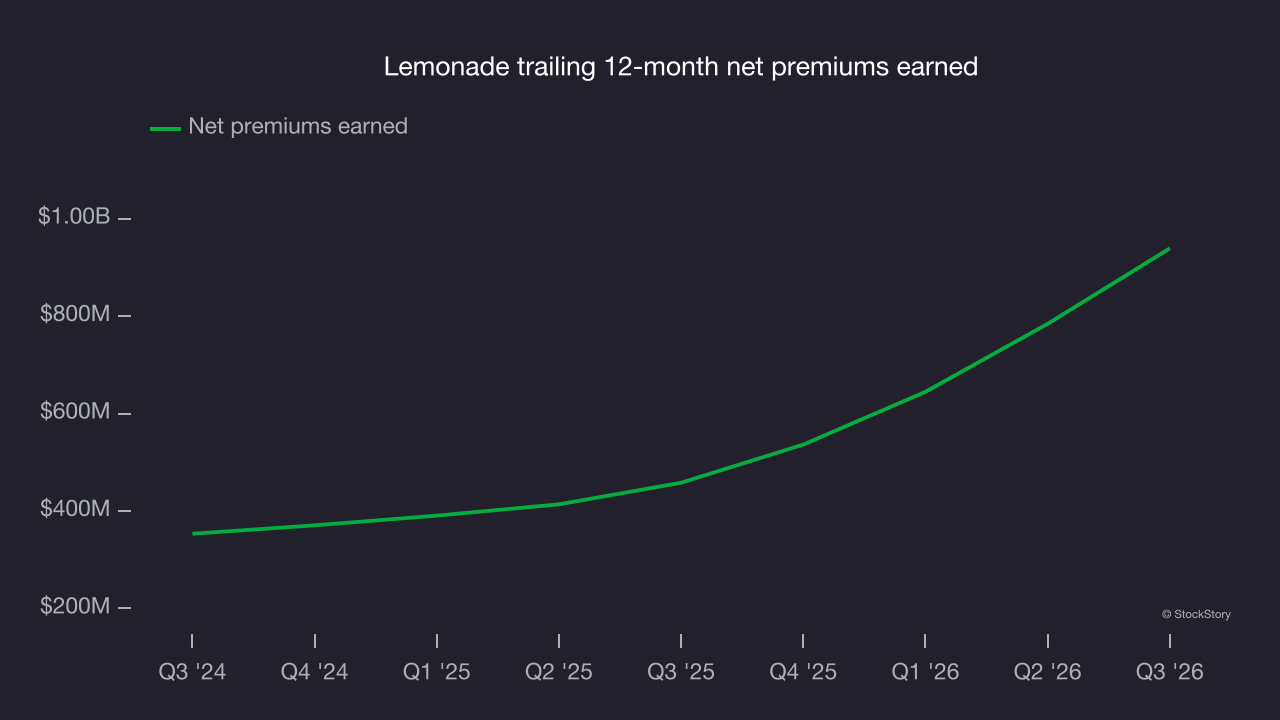
Lemonade’s net premiums earned rose 111% year on year to $294.8 million this quarter, topping Wall Street’s consensus estimates by 5.2%.
Key takeaways from Lemonade’s Q3 results
Lemonade posted a solid quarter, with net premiums earned and revenue both beating Wall Street’s consensus estimates by wide margins. EPS came in roughly in line with consensus. Still, the market seemed to be hoping for more, and shares tumbled 6.1% to $43.09 immediately after the results.
When deciding whether to buy the stock, consider its valuation, business quality and latest quarterly results. For more on those factors, read our full research report here (it’s free).