
Entertainment venue operator Lucky Strike (NYSE: LUCK) reported Q3 CY2025 results beating Wall Street’s revenue expectations, with sales up 12.3% year on year to $292.3 million. The company’s full-year revenue guidance of $1.29 billion at the midpoint came in 0.6% above analysts’ estimates.
Is now the time to buy Lucky Strike? Find out by accessing our full research report, it’s free for active Edge members.
Lucky Strike (LUCK) Q3 CY2025 Highlights:
- Revenue: $292.3 million vs analyst estimates of $282.9 million (12.3% year-on-year growth, 3.3% beat)
- Adjusted EBITDA: $72.65 million vs analyst estimates of $70.99 million (24.9% margin, 2.3% beat)
- The company reconfirmed its revenue guidance for the full year of $1.29 billion at the midpoint
- EBITDA guidance for the full year is $395 million at the midpoint, above analyst estimates of $390.3 million
- Operating Margin: 9.7%, up from 5% in the same quarter last year
- Same-Store Sales were flat year on year, in line with the same quarter last year
- Market Capitalization: $1.16 billion
Company Overview
Born from the transformation of traditional bowling alleys into modern entertainment destinations, Lucky Strike (NYSE: LUCK) operates bowling alleys and other entertainment venues with upscale amenities, arcade games, and food and beverage services across North America.
Revenue Growth
A company’s long-term performance is an indicator of its overall quality. Any business can have short-term success, but a top-tier one grows for years. Luckily, Lucky Strike’s sales grew at an incredible 57.6% compounded annual growth rate over the last five years. Its growth beat the average consumer discretionary company and shows its offerings resonate with customers.
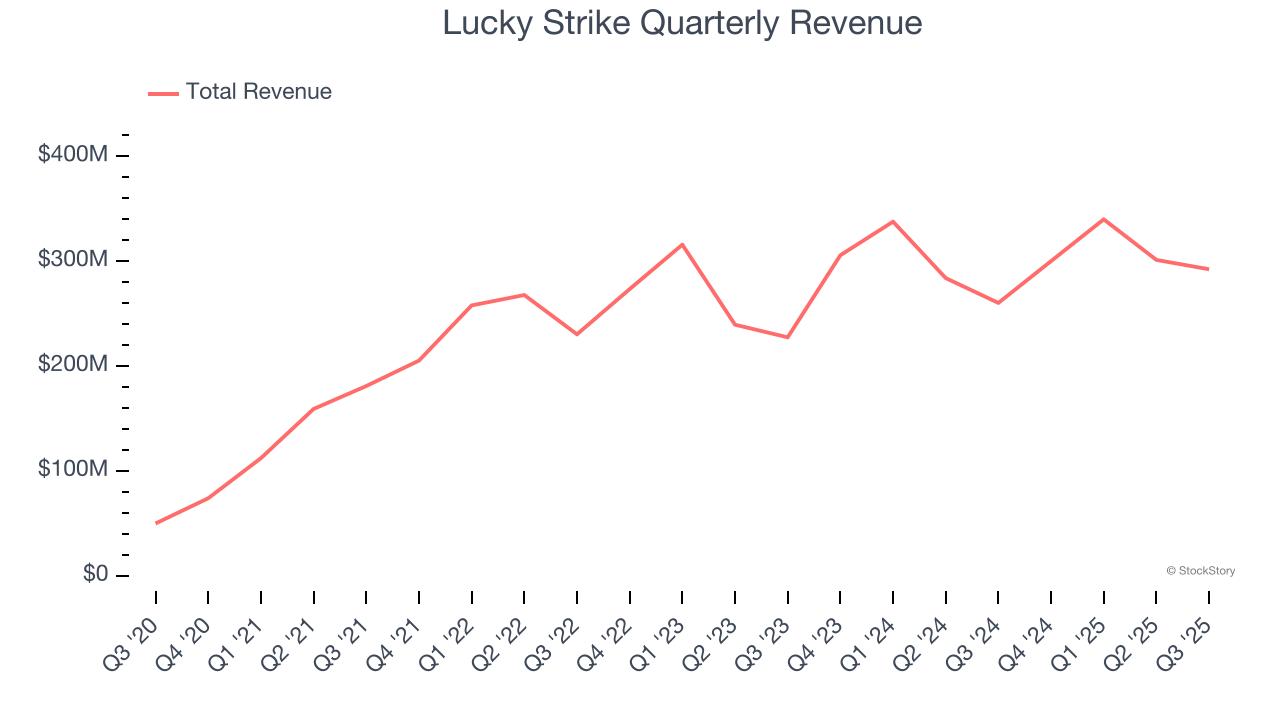
We at StockStory place the most emphasis on long-term growth, but within consumer discretionary, a stretched historical view may miss a company riding a successful new product or trend. Lucky Strike’s recent performance shows its demand has slowed significantly as its annualized revenue growth of 8.1% over the last two years was well below its five-year trend. Note that COVID hurt Lucky Strike’s business in 2020 and part of 2021, and it bounced back in a big way thereafter. 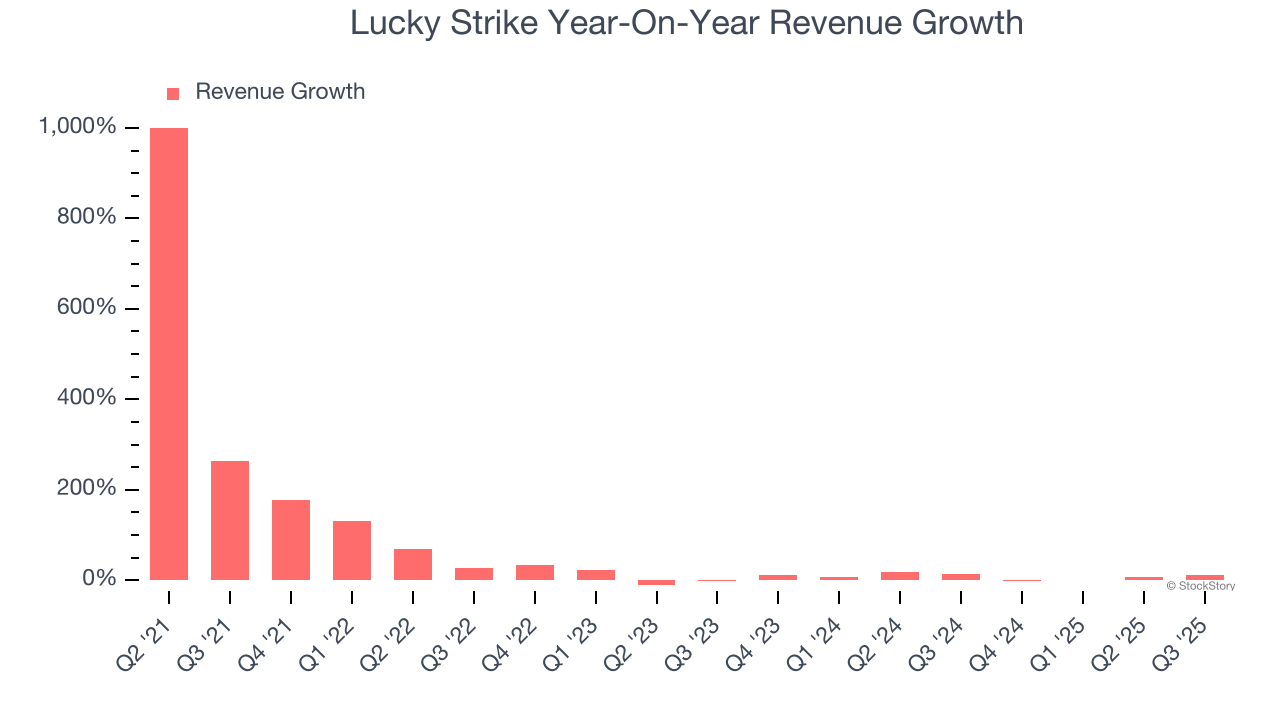
We can dig further into the company’s revenue dynamics by analyzing its same-store sales, which show how much revenue its established locations generate. Over the last two years, Lucky Strike’s same-store sales averaged 2.4% year-on-year growth. Because this number is lower than its revenue growth, we can see the opening of new locations is boosting the company’s top-line performance. 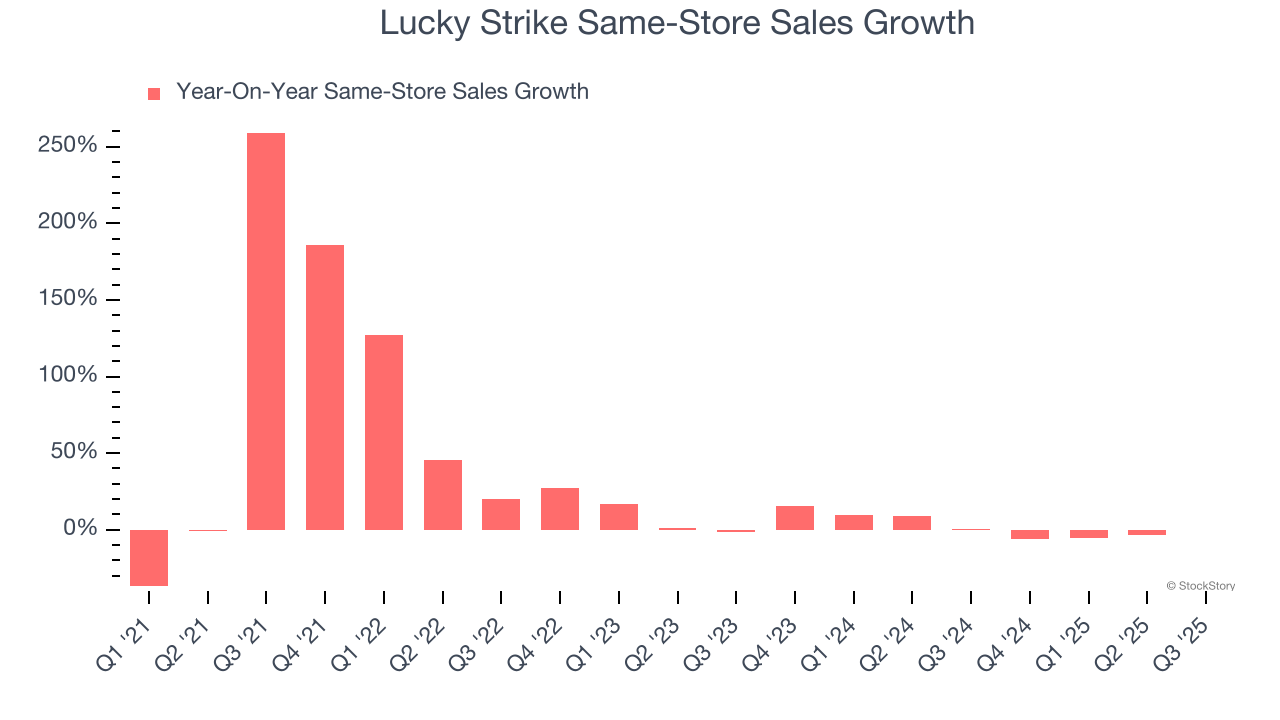
This quarter, Lucky Strike reported year-on-year revenue growth of 12.3%, and its $292.3 million of revenue exceeded Wall Street’s estimates by 3.3%.
Looking ahead, sell-side analysts expect revenue to grow 5% over the next 12 months, a deceleration versus the last two years. This projection is underwhelming and suggests its products and services will face some demand challenges.
Software is eating the world and there is virtually no industry left that has been untouched by it. That drives increasing demand for tools helping software developers do their jobs, whether it be monitoring critical cloud infrastructure, integrating audio and video functionality, or ensuring smooth content streaming. Click here to access a free report on our 3 favorite stocks to play this generational megatrend.
Operating Margin
Operating margin is a key measure of profitability. Think of it as net income - the bottom line - excluding the impact of taxes and interest on debt, which are less connected to business fundamentals.
Lucky Strike’s operating margin has risen over the last 12 months and averaged 10.4% over the last two years. Its profitability was higher than the broader consumer discretionary sector, showing it did a decent job managing its expenses.
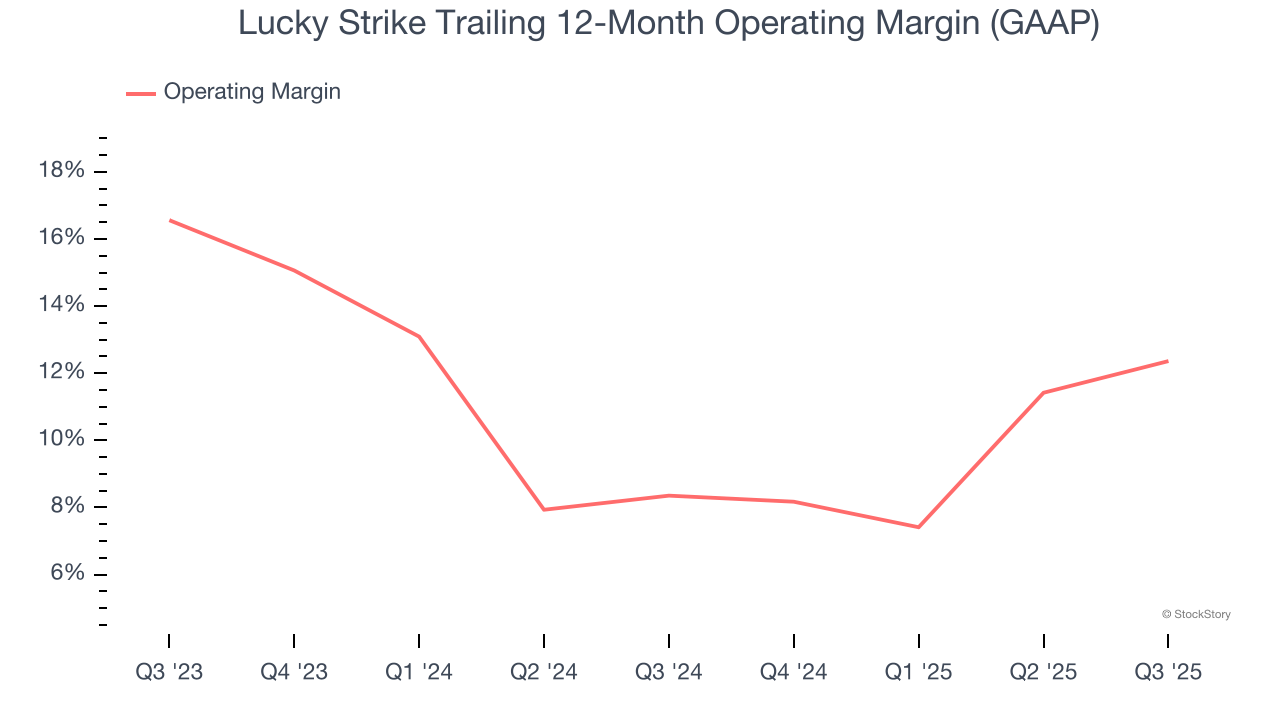
In Q3, Lucky Strike generated an operating margin profit margin of 9.7%, up 4.7 percentage points year on year. This increase was a welcome development and shows it was more efficient.
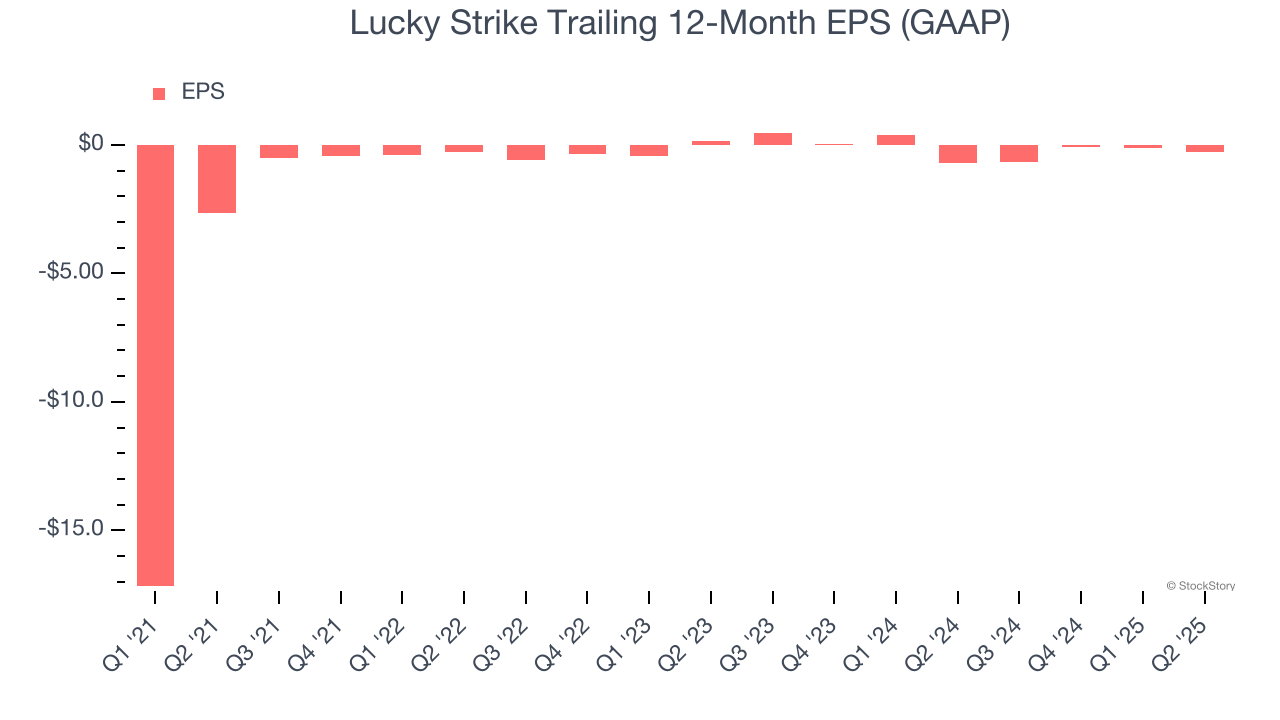
Earnings Per Share
Revenue trends explain a company’s historical growth, but the long-term change in earnings per share (EPS) points to the profitability of that growth – for example, a company could inflate its sales through excessive spending on advertising and promotions.
Although Lucky Strike’s full-year earnings are still negative, it reduced its losses and improved its EPS by 9.4% annually over the last four years. The next few quarters will be critical for assessing its long-term profitability.
Key Takeaways from Lucky Strike’s Q3 Results
It was encouraging to see Lucky Strike beat analysts’ revenue and EBITDA expectations this quarter. We were also glad its full-year revenue and EBITDA guidance exceeded Wall Street’s estimates. Overall, this print had some key positives. The stock remained flat at $8.07 immediately following the results.
Is Lucky Strike an attractive investment opportunity at the current price? The latest quarter does matter, but not nearly as much as longer-term fundamentals and valuation, when deciding if the stock is a buy. We cover that in our actionable full research report which you can read here, it’s free for active Edge members.


