
Entertainment venue operator Lucky Strike (NYSE: LUCK) beat Wall Street’s revenue expectations in Q2 CY2025, with sales up 6.1% year on year to $301.2 million. The company’s full-year revenue guidance of $1.29 trillion at the midpoint came in 101,478% above analysts’ estimates. Its GAAP loss of $0.52 per share was significantly below analysts’ consensus estimates.
Is now the time to buy Lucky Strike? Find out by accessing our full research report, it’s free.
Lucky Strike (LUCK) Q2 CY2025 Highlights:
- Revenue: $301.2 million vs analyst estimates of $293.4 million (6.1% year-on-year growth, 2.7% beat)
- EPS (GAAP): -$0.52 vs analyst estimates of -$0.10 (significant miss)
- Adjusted EBITDA: $88.73 million vs analyst estimates of $86.22 million (29.5% margin, 2.9% beat)
- EBITDA guidance for the upcoming financial year 2026 is $395 million at the midpoint, below analyst estimates of $405.9 million
- Operating Margin: 5%, up from -12.1% in the same quarter last year
- Same-Store Sales fell 4.1% year on year (5.2% in the same quarter last year)
- Market Capitalization: $1.50 billion
Company Overview
Born from the transformation of traditional bowling alleys into modern entertainment destinations, Lucky Strike (NYSE: LUCK) operates bowling alleys and other entertainment venues with upscale amenities, arcade games, and food and beverage services across North America.
Revenue Growth
A company’s long-term sales performance is one signal of its overall quality. Any business can have short-term success, but a top-tier one grows for years. Thankfully, Lucky Strike’s 32% annualized revenue growth over the last four years was incredible. Its growth beat the average consumer discretionary company and shows its offerings resonate with customers.
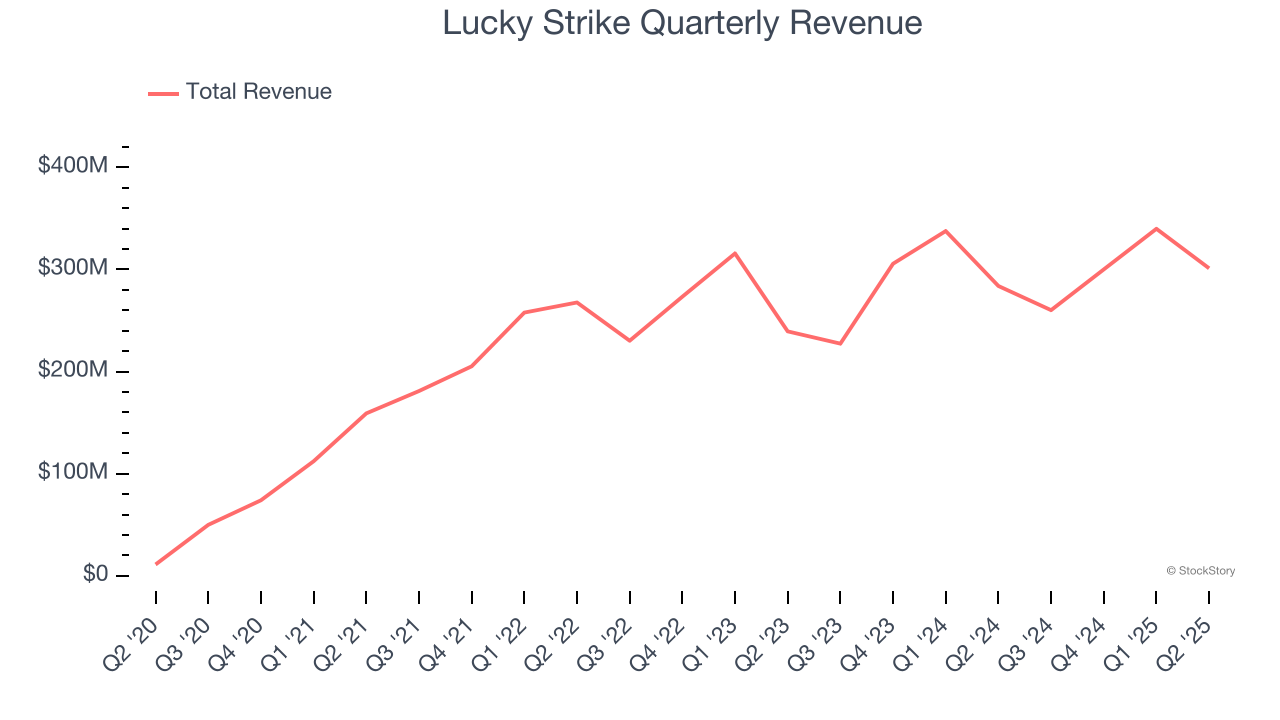
Long-term growth is the most important, but within consumer discretionary, product cycles are short and revenue can be hit-driven due to rapidly changing trends and consumer preferences. Lucky Strike’s recent performance shows its demand has slowed significantly as its annualized revenue growth of 6.5% over the last two years was well below its four-year trend. Note that COVID hurt Lucky Strike’s business in 2020 and part of 2021, and it bounced back in a big way thereafter. 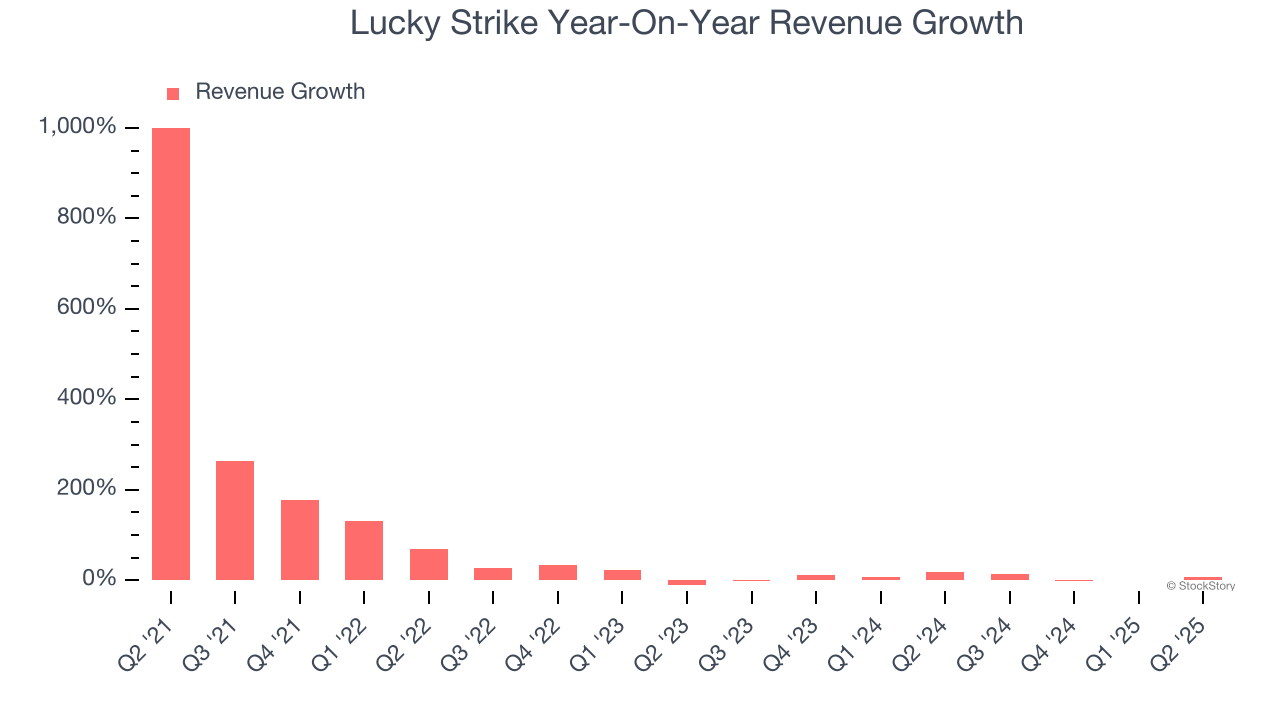
We can dig further into the company’s revenue dynamics by analyzing its same-store sales, which show how much revenue its established locations generate. Over the last two years, Lucky Strike’s same-store sales were flat. Because this number is lower than its revenue growth, we can see the opening of new locations is boosting the company’s top-line performance. 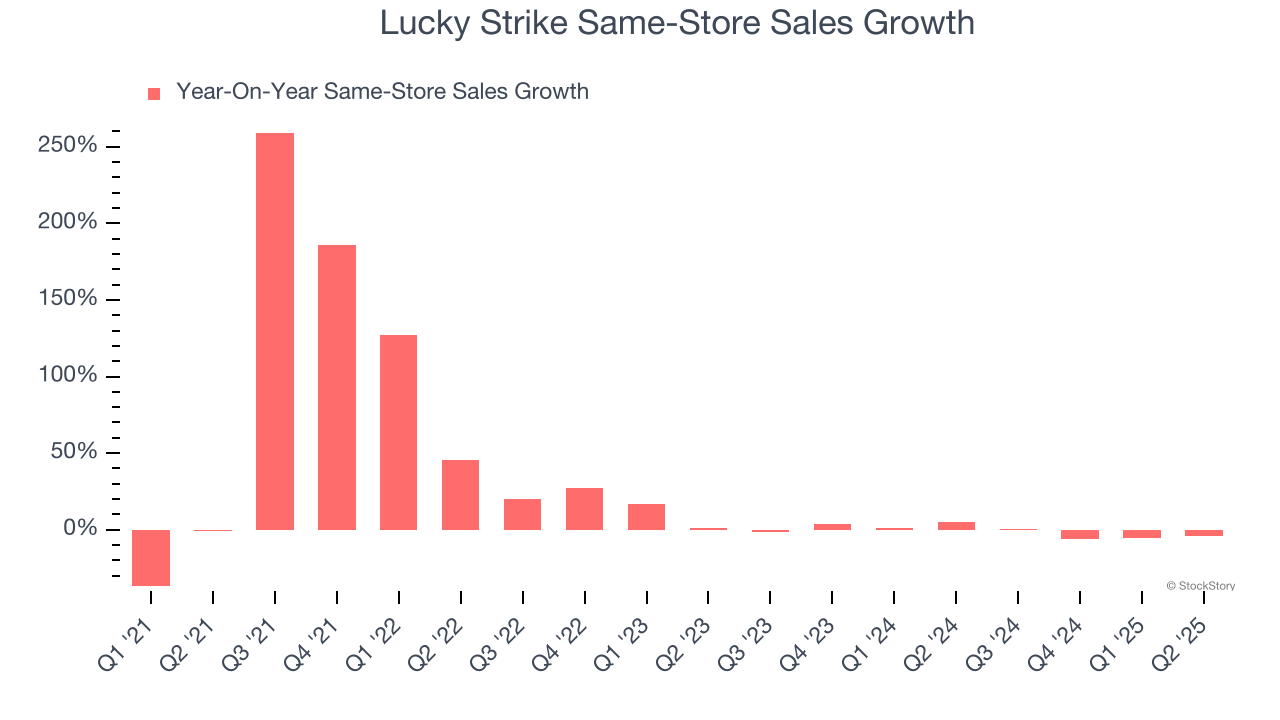
This quarter, Lucky Strike reported year-on-year revenue growth of 6.1%, and its $301.2 million of revenue exceeded Wall Street’s estimates by 2.7%.
Looking ahead, sell-side analysts expect revenue to grow 5.3% over the next 12 months, similar to its two-year rate. This projection is underwhelming and suggests its products and services will see some demand headwinds.
Today’s young investors won’t have read the timeless lessons in Gorilla Game: Picking Winners In High Technology because it was written more than 20 years ago when Microsoft and Apple were first establishing their supremacy. But if we apply the same principles, then enterprise software stocks leveraging their own generative AI capabilities may well be the Gorillas of the future. So, in that spirit, we are excited to present our Special Free Report on a profitable, fast-growing enterprise software stock that is already riding the automation wave and looking to catch the generative AI next.
Operating Margin
Operating margin is an important measure of profitability as it shows the portion of revenue left after accounting for all core expenses – everything from the cost of goods sold to advertising and wages. It’s also useful for comparing profitability across companies with different levels of debt and tax rates because it excludes interest and taxes.
Lucky Strike’s operating margin has risen over the last 12 months and averaged 9.7% over the last two years. The company’s higher efficiency is a breath of fresh air, but its suboptimal cost structure means it still sports mediocre profitability for a consumer discretionary business.
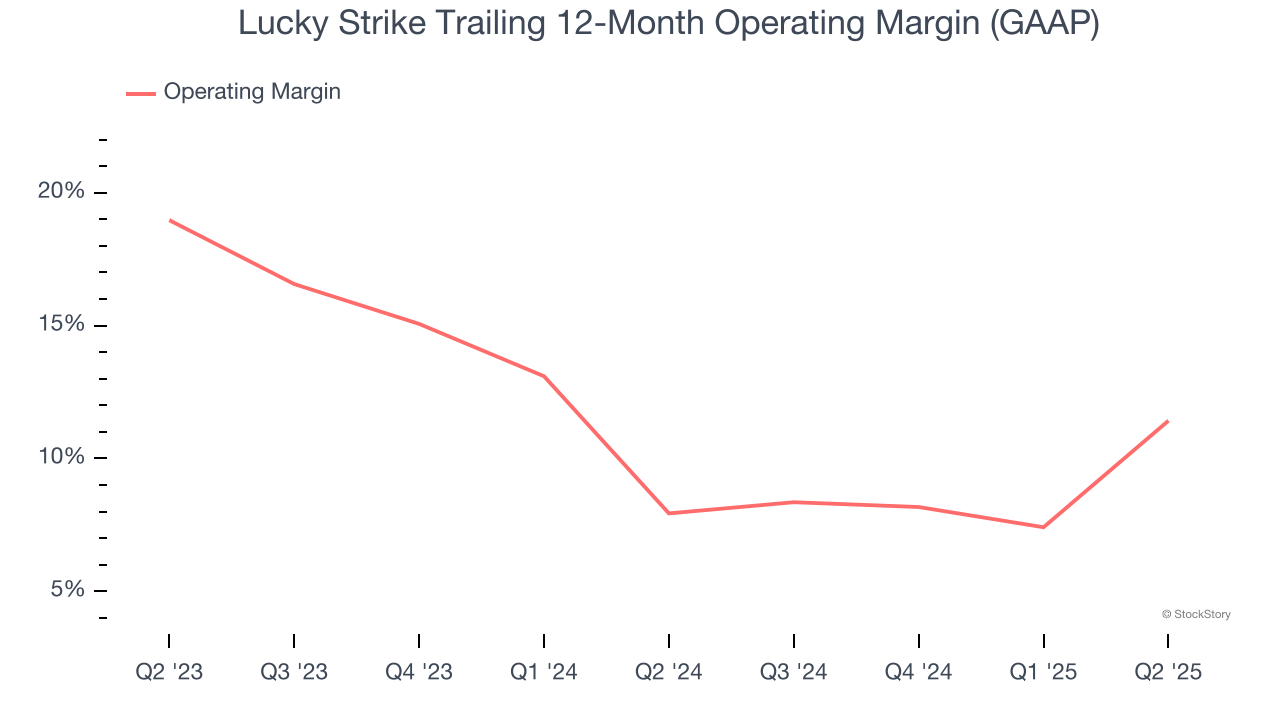
In Q2, Lucky Strike generated an operating margin profit margin of 5%, up 17.1 percentage points year on year. This increase was a welcome development and shows it was more efficient.
Earnings Per Share
Revenue trends explain a company’s historical growth, but the long-term change in earnings per share (EPS) points to the profitability of that growth – for example, a company could inflate its sales through excessive spending on advertising and promotions.
Although Lucky Strike’s full-year earnings are still negative, it reduced its losses and improved its EPS by 50.4% annually over the last four years. The next few quarters will be critical for assessing its long-term profitability.
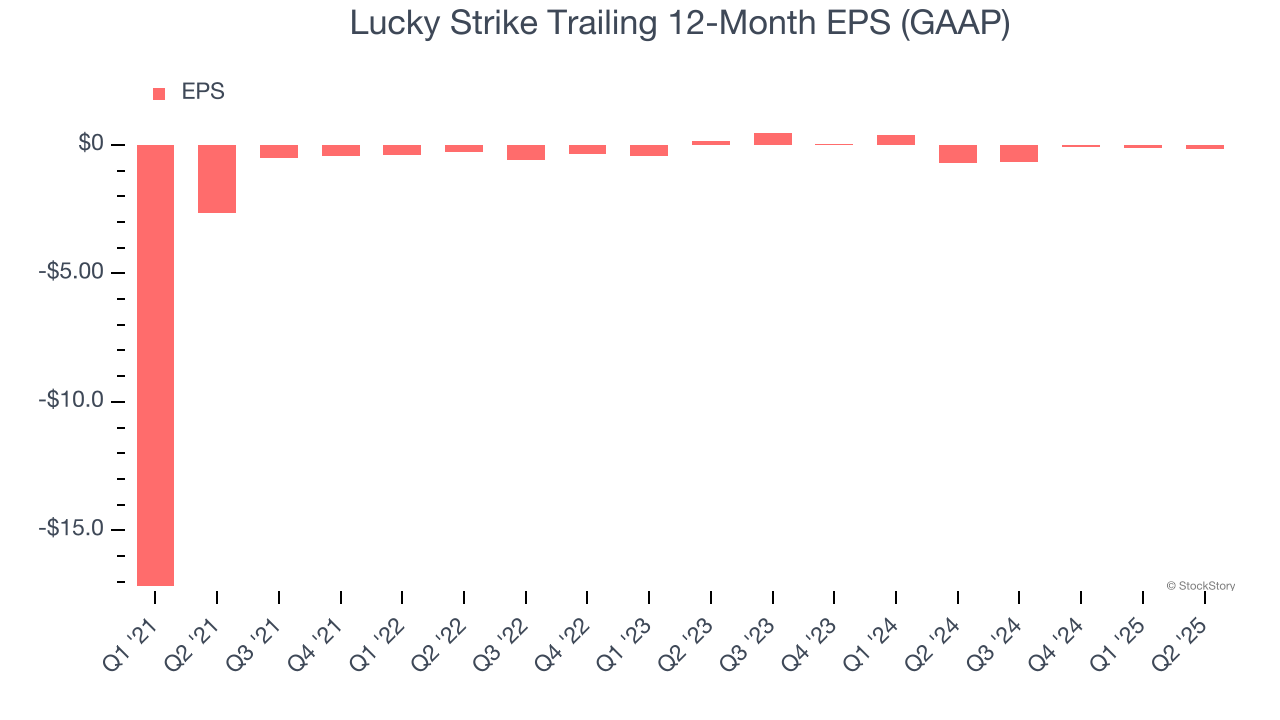
In Q2, Lucky Strike reported EPS of negative $0.52, down from negative $0.48 in the same quarter last year. This print missed analysts’ estimates. Over the next 12 months, Wall Street is optimistic. Analysts forecast Lucky Strike’s full-year EPS of negative $0.16 will flip to positive $0.08.
Key Takeaways from Lucky Strike’s Q2 Results
We were impressed by Lucky Strike’s optimistic full-year revenue guidance, which blew past analysts’ expectations. We were also happy its revenue outperformed Wall Street’s estimates. On the other hand, its EPS missed and its full-year EBITDA guidance fell short of Wall Street’s estimates. Overall, this print was mixed but still had some key positives. The stock traded up 2.6% to $10.96 immediately after reporting.
Big picture, is Lucky Strike a buy here and now? The latest quarter does matter, but not nearly as much as longer-term fundamentals and valuation, when deciding if the stock is a buy. We cover that in our actionable full research report which you can read here, it’s free.


