Regional banking company Flagstar Financial (NYSE: FLG) fell short of the market’s revenue expectations in Q3 2026, but revenue rose 6.4% year on year to $530 million. Its non-GAAP profit of $0.01 per share was 85.9% below analysts’ consensus estimates.
For more on Flagstar Financial, read the full research report, available free.
Flagstar Financial (FLG) Q3 2026 highlights:
- Net Interest Income: $460 million vs analysts' consensus estimates of $463.4 million (8.2% year-on-year growth, 0.7% miss)
- Net Interest Margin: 2.2% vs analysts' consensus estimates of 2.2% (in line)
- Revenue: $530 million vs analysts' consensus estimates of $545 million (6.4% year-on-year growth, 2.7% miss)
- Efficiency Ratio: 83.2% vs analysts' consensus estimates of 82.2% (108 basis point miss)
- Adjusted EPS: $0.01 vs analysts' consensus estimates of $0.07 (85.9% miss)
- Tangible Book Value per Share: $17.05 vs analysts' consensus estimates of $17.64 (1.6% year-on-year decline, 3.4% miss)
- Market Capitalization: $4.75 billion
"We believe these trends demonstrate ongoing progress in strengthening our core franchise and improving the quality and composition of our balance sheet. We remain focused on executing our long-term strategic plan of transforming Flagstar into a high performing regional bank. While the current interest rate environment may affect the pace at which we achieve certain objectives, our commitment to the transformation remains unchanged. We will continue to prioritize disciplined risk management, sustainable earnings growth, balance sheet strength, and the consistent execution of our strategic plan to position the Bank for long-term success."
Revenue growth
Two primary revenue streams drive bank earnings. While net interest income, which is earned by charging higher rates on loans than paid on deposits, forms the foundation, fee-based services across banking, credit, wealth management and trading operations provide additional income. Flagstar Financial’s revenue grew at a mediocre 9.5% compounded annual growth rate over the last five years. This fell short of the banking-sector benchmark and provides a poor growth baseline.
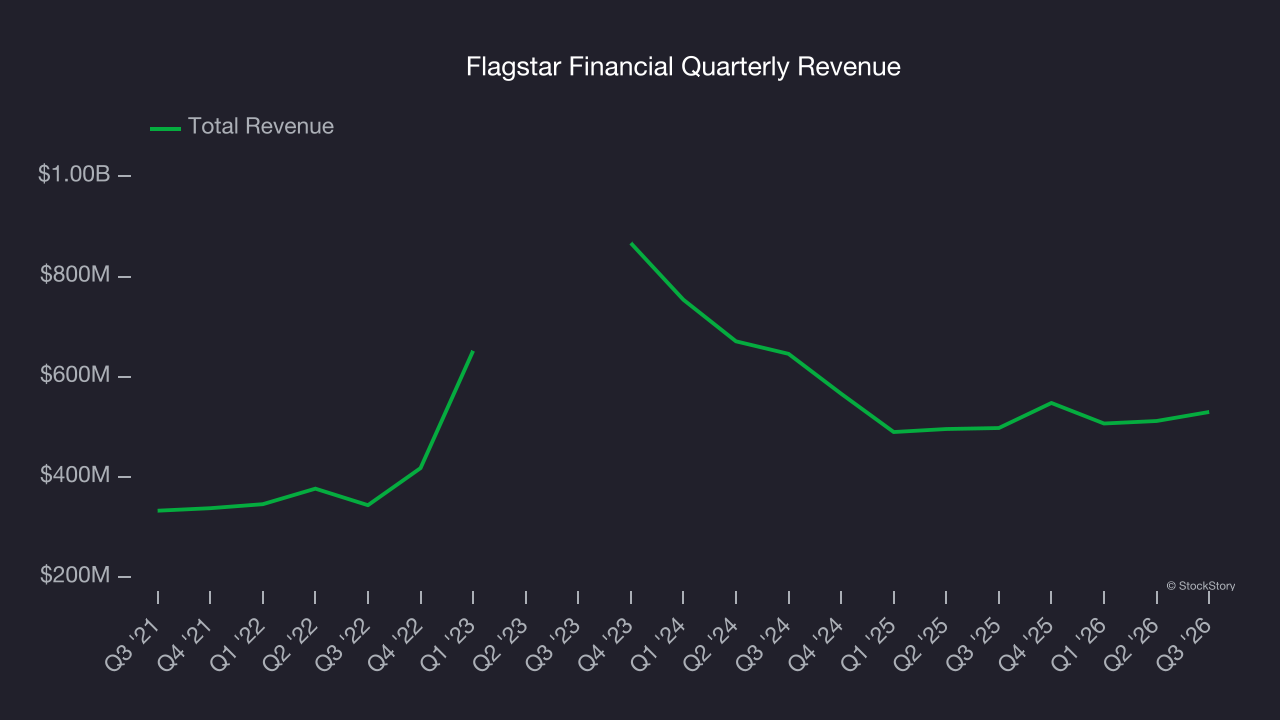 Note: Quarters not shown were determined to be outliers because they were impacted by outsized investment gains/losses that are not indicative of the recurring fundamentals of the business.
Long-term growth matters most, but within financials, a half-decade historical view may miss recent interest rate changes, market returns and industry trends. Flagstar Financial’s performance shows it grew in the past but gave back those gains over the last two years, as its revenue fell by 15.5% annually. 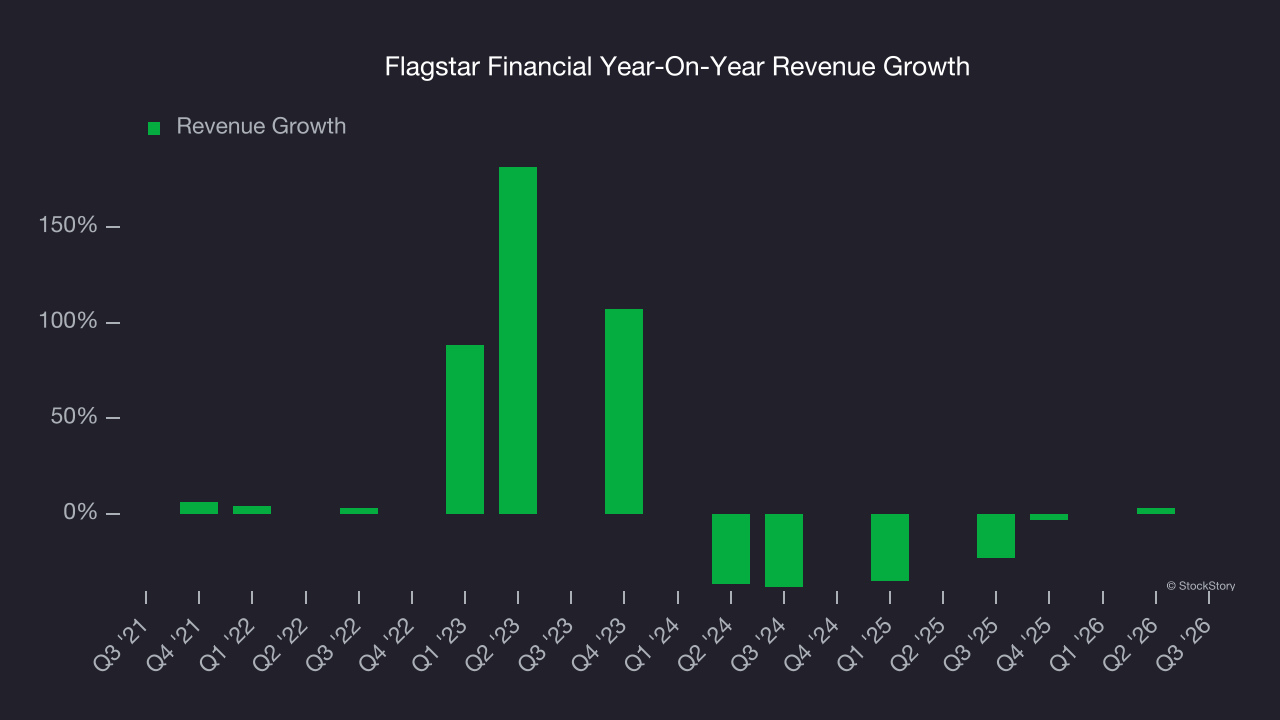 Note: Quarters not shown were determined to be outliers because they were impacted by outsized investment gains/losses that are not indicative of the recurring fundamentals of the business.
This quarter, Flagstar Financial’s revenue grew by 6.4% year on year to $530 million, missing Wall Street’s consensus estimates.
Net interest income made up 86.8% of the company’s total revenue during the last five years, meaning Flagstar Financial barely relies on non-interest income to drive its overall growth.
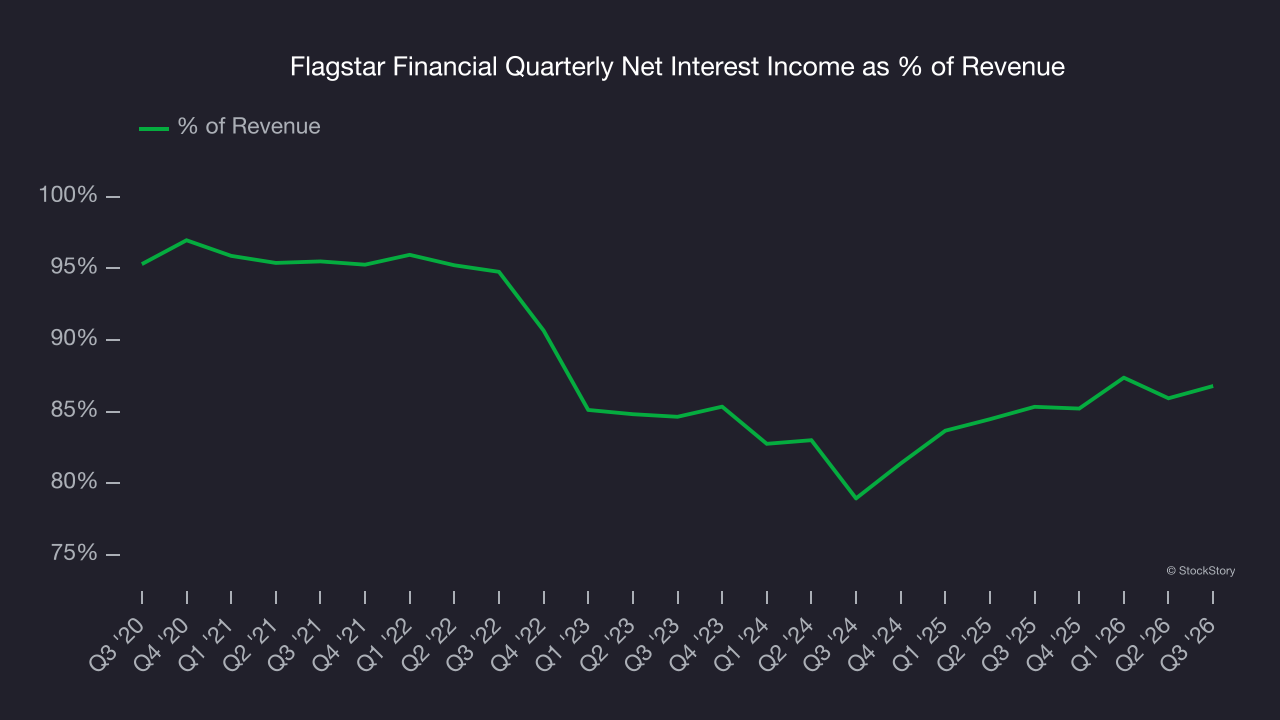
The market cares primarily about a bank’s net interest income growth as non-interest income is considered a lower-quality and non-recurring revenue source.
Tangible book value per share (TBVPS)
Banks are balance sheet-driven businesses because they generate earnings primarily through borrowing and lending. They’re also valued based on their balance sheet strength and ability to compound book value (another name for shareholders’ equity) over time.
This makes tangible book value per share (TBVPS) the most important metric to track for banks. TBVPS represents the real, liquid net worth per share of a bank, excluding intangible assets that have debatable value upon liquidation. Other (and more commonly known) per-share metrics like EPS can sometimes be harder to interpret because of M&A or accounting rules allowing for loan losses to be spread out.
Flagstar Financial’s TBVPS declined at an annual rate of 8.1% over the last five years. On a two-year basis, TBVPS fell at a slower pace, dropping by 3.2% annually from $18.18 to $17.05 per share.
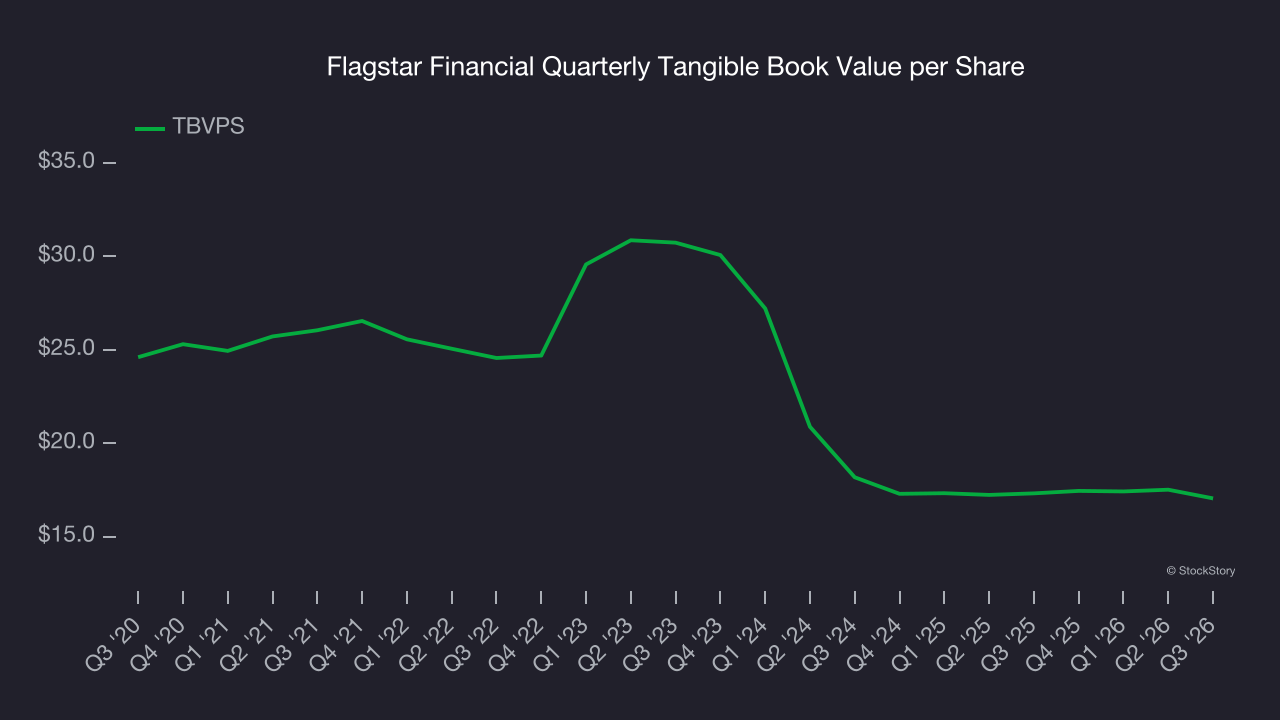
Over the next 12 months, consensus estimates call for Flagstar Financial’s TBVPS to grow by 11.3% to $18.98, a mediocre growth rate.
Key takeaways from Flagstar Financial’s Q3 results
Flagstar Financial fell short of Wall Street’s consensus estimates for both revenue and EPS, leaving few positives in a softer quarter. Shares fell 4.2% to $10.97 immediately after the results.
Flagstar Financial’s latest earnings report disappointed. One quarter doesn’t define a company’s quality, so assessing whether the stock is a buy at the current price requires a longer-term view. The latest quarter is only one piece of the business quality picture. Quality, combined with valuation, can help determine if the stock is a buy. For more on those factors, read our full research report here (it’s free).