Real estate data provider CoStar Group (NASDAQ: CSGP) beat Wall Street’s revenue expectations in Q3 2026, with revenue up 14.1% year on year to $952 million. The company expects next quarter’s revenue to be around $986 million, close to analysts’ consensus estimates. Its non-GAAP profit of $0.38 per share was 12% above analysts’ consensus estimates.
For more on CoStar, read our free full research report.
CoStar (CSGP) Q3 2026 highlights:
- Revenue $952 million vs S&P analysts’ consensus estimates of $946 million (14.1% year-on-year growth, 0.6% beat)
- Adjusted EPS $0.38 vs S&P analysts’ consensus estimates of $0.34 (12% beat)
- Adjusted EBITDA $229 million vs analysts’ consensus estimates of $206.8 million (24.1% margin, 10.8% beat)
- Revenue guidance $986 million at the midpoint for Q4 2026, roughly in line with what analysts were expecting
- Adjusted EPS guidance Management raised its full-year adjusted EPS guidance to $1.40 at the midpoint, a 3% increase
- EBITDA guidance $830 million at the midpoint for the full year, above analysts’ consensus estimates of $813.7 million
- Operating margin 8.8%, up from -6.1% in the same quarter last year
- Market capitalization $13.66 billion
“CoStar Group generated outstanding profitability growth in the third quarter, delivering on our commitment to expand margins as we exit a period of investment,” said Andy Florance, Founder and Chief Executive Officer of CoStar Group. “Adjusted EBITDA doubled year-over-year and was considerably above the high end of our $190 million to $210 million guidance range. We achieved significant additional efficiencies in the quarter, bringing total anticipated cost savings this year to approximately $150 million versus our original guidance. Our ongoing deep expense review has identified potential additional savings of at least $200 million that we believe will improve efficiency without sacrificing revenue growth. We expect to realize these over the next 12 to 18 months, keeping us on track to achieve our 2028 Adjusted EBITDA target of $1.25 billion.”
Revenue growth
Examining a company’s long-term performance can provide clues about its quality. Any business can put up a good quarter or two, but the best consistently grow over the long haul.
With $3.67 billion in revenue over the past 12 months, CoStar is a mid-sized business services company, which sometimes brings disadvantages compared to larger competitors benefiting from better economies of scale. On the positive side, it can still achieve high growth rates because it’s working from a smaller revenue base.
CoStar’s 14.3% annualized revenue growth over the last five years was strong. This shows it had high demand.
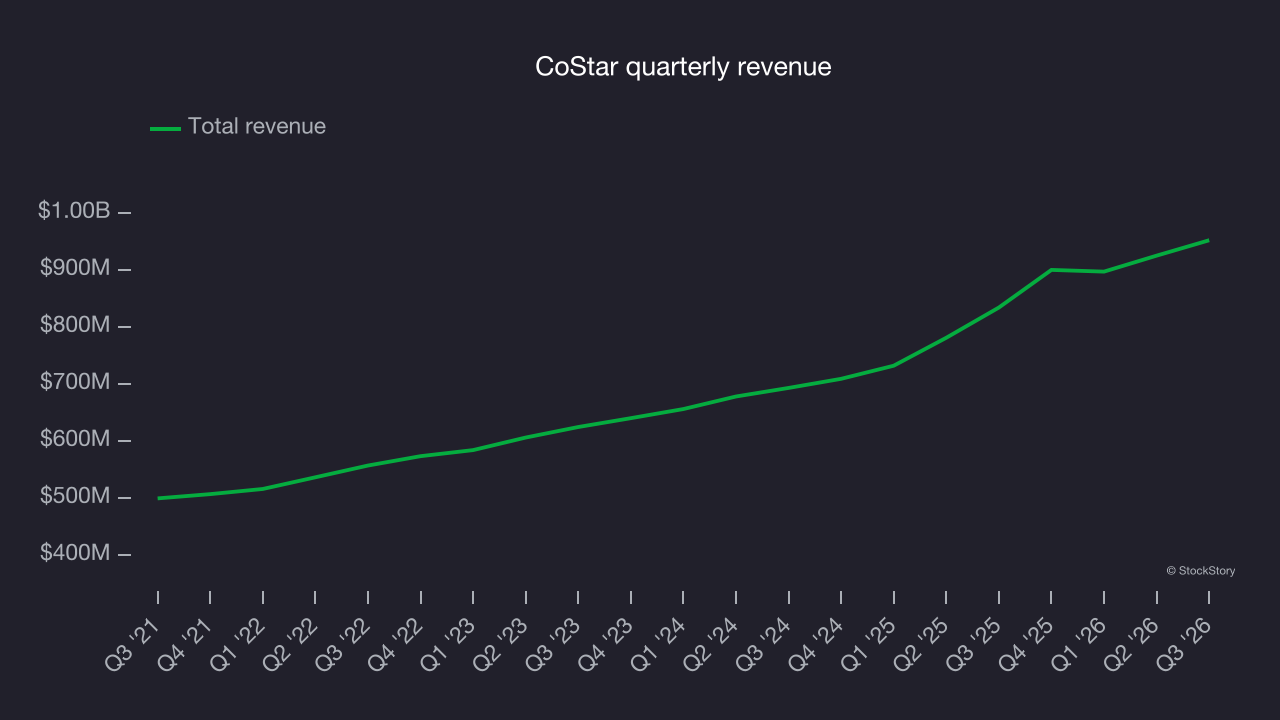
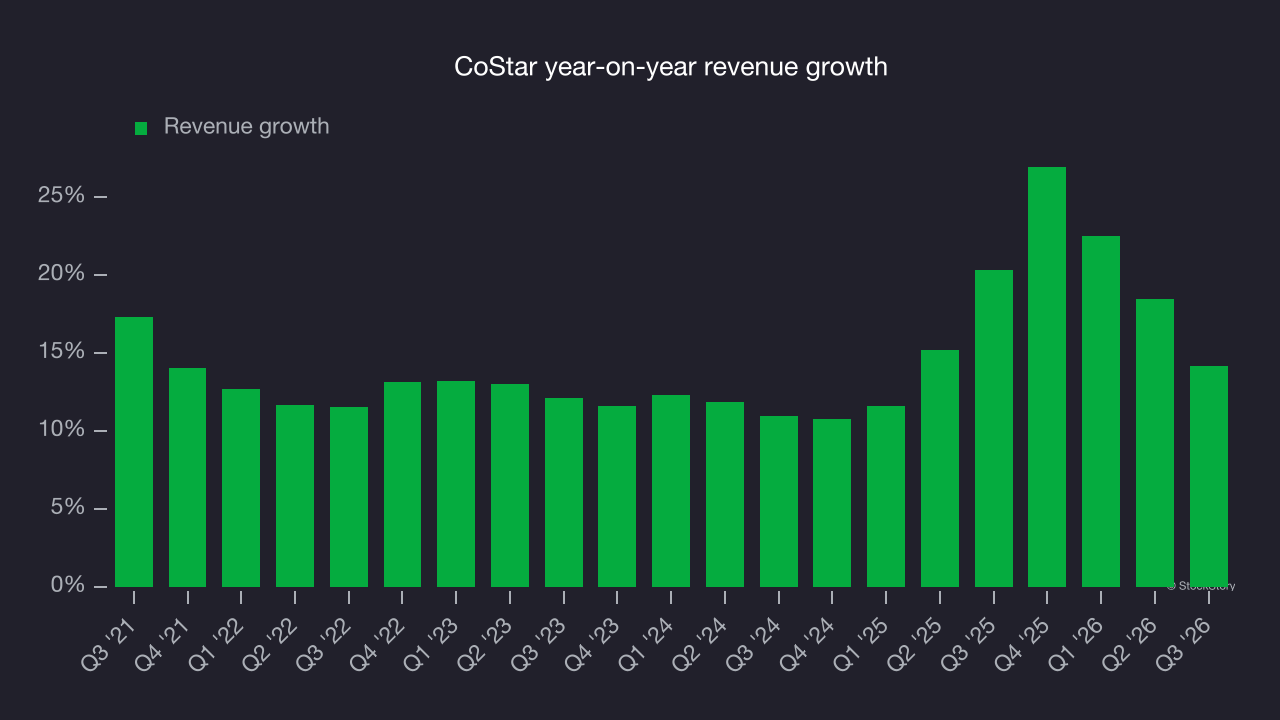
This quarter, CoStar reported year-on-year revenue growth of 14.1%, and its $952 million of revenue exceeded Wall Street’s consensus estimates by 0.6%. Company management is currently guiding for a 9.6% year-on-year increase in revenue next quarter.
Looking further ahead, sell-side analysts expect revenue to grow 10.7% over the next 12 months, according to S&P, a deceleration versus the last two years. Still, this is a solid projection and implies the market sees success for its products and services.
Adjusted operating margin
Adjusted operating margin is one of the best measures of profitability because it tells us how much money a company takes home after subtracting all core expenses, like marketing and R&D. It also removes various one-time costs to paint a better picture of normalized profits.
CoStar has been an efficient company over the last five years. It was one of the more profitable businesses in the business services sector, with an average adjusted operating margin of 16.5%.
Looking at the trend in its profitability, CoStar’s adjusted operating margin decreased by 15.8 percentage points over the last five years. This raises questions about the company’s expense base because its revenue growth should have given it leverage on its fixed costs, resulting in better economies of scale and profitability.
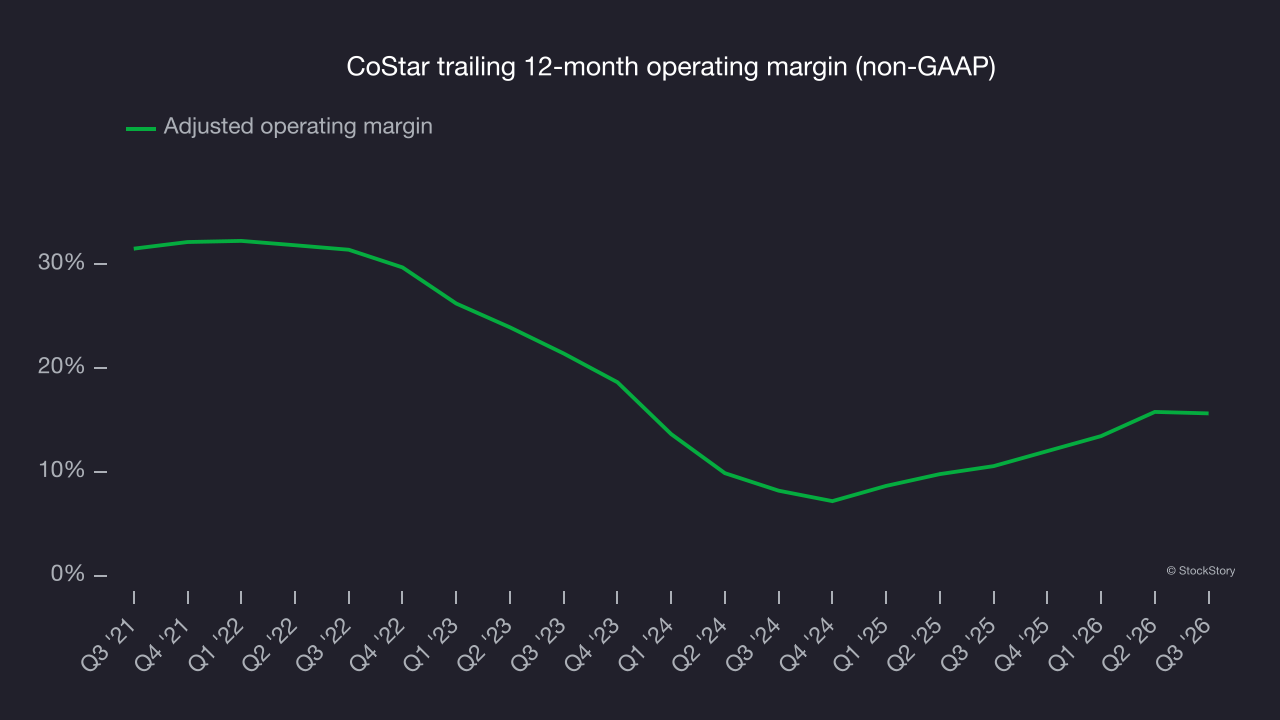
In Q3, CoStar generated an adjusted operating margin of 12.2%, in line with the same quarter last year. This indicates the company’s overall cost structure has been relatively stable.
Earnings per share
Revenue trends explain a company’s historical growth, but the long-term change in earnings per share (EPS) points to the profitability of that growth. For example, a company could inflate its revenue through excessive spending on advertising and promotions.
CoStar’s EPS grew at a weak 3% compounded annual growth rate over the last five years, lower than its 14.3% annualized revenue growth. This tells us the company became less profitable on a per-share basis as it expanded.
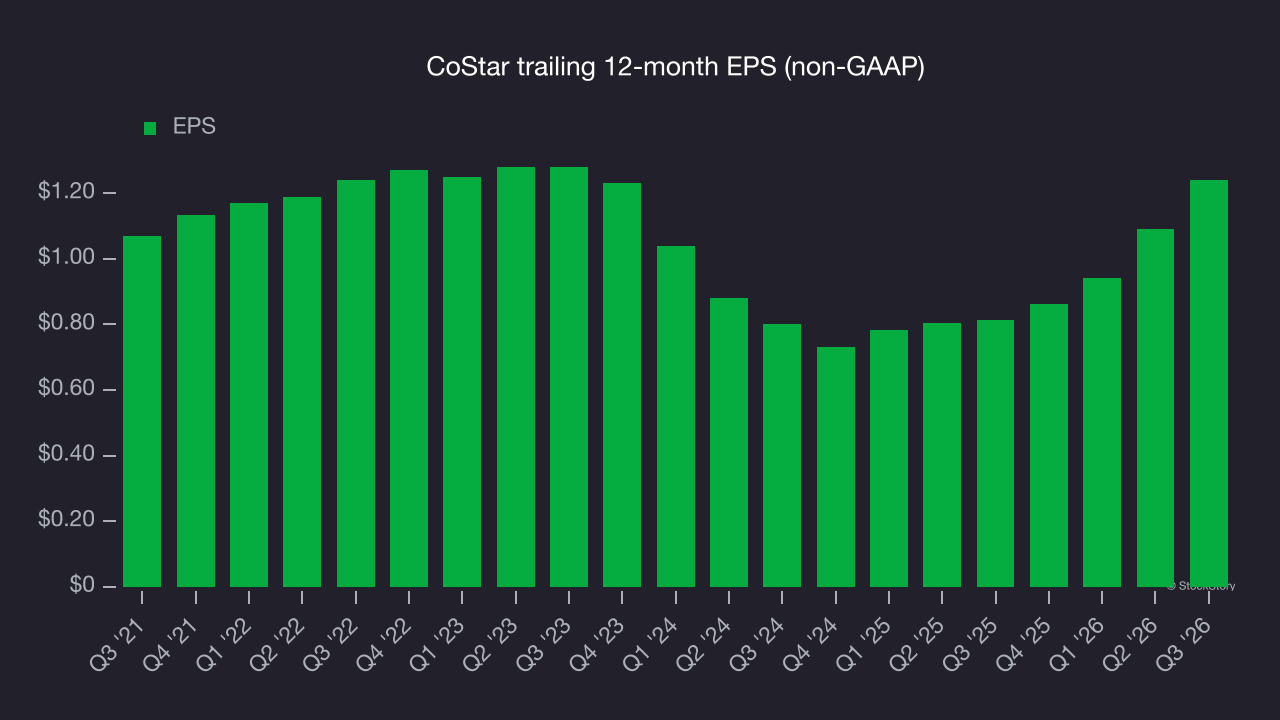
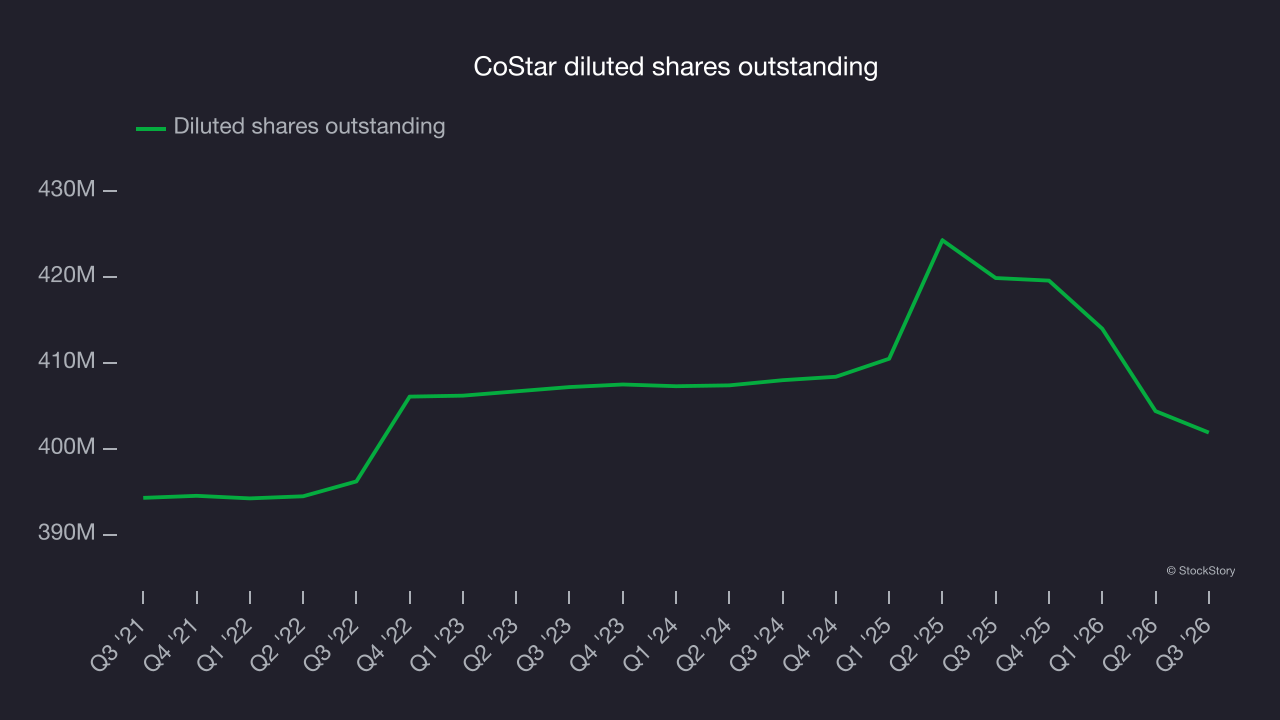
Like with revenue, we analyze EPS over a more recent period because it can provide insight into an emerging theme or development for the business.
For CoStar, its two-year annual EPS growth of 24.5% was higher than its five-year trend. This acceleration made it one of the faster-growing business services companies in recent history.
In Q3, CoStar reported adjusted EPS of $0.38, up from $0.23 in the same quarter last year. This was a strong result, comfortably beating analysts’ consensus estimates. Over the next 12 months, Wall Street expects CoStar’s full-year EPS to grow 34.8% from $1.24 to $1.67, according to S&P.
Key takeaways from CoStar’s Q3 results
CoStar’s quarter had some key positives: EPS beat analysts’ consensus estimates, and full-year EPS guidance also topped Wall Street’s consensus. But full-year revenue guidance fell slightly short of expectations. Investors were likely hoping for more, as shares tumbled 9.7% to $28.87 immediately after the report.
When deciding whether to invest in CoStar, consider its valuation, business quality and latest quarterly results. For more on CoStar, read our full research report here (it’s free).