Infrastructure and defense services provider Parsons (NYSE: PSN) reported Q3 2026 results exceeding the market’s revenue expectations, with revenue up 1.8% year on year to $1.65 billion. The company expects the full year’s revenue to be around $6.35 billion, close to analysts’ consensus estimates. Its non-GAAP profit of $0.89 per share was 13.5% above analysts’ consensus estimates.
For more on Parsons, read our free full research report.
Parsons (PSN) Q3 2026 highlights:
- Revenue $1.65 billion vs S&P analysts’ consensus estimates of $1.62 billion (1.8% year-on-year growth, 2% beat)
- Adjusted EPS $0.89 vs S&P analysts’ consensus estimates of $0.78 (13.5% beat)
- Adjusted EBITDA $167.8 million vs analysts’ consensus estimates of $159.2 million (10.2% margin, 5.4% beat)
- Revenue guidance The company reconfirmed its revenue guidance for the full year of $6.35 billion at the midpoint (slight miss)
- EBITDA guidance $530 million at the midpoint for the full year, above analysts’ consensus estimates of $523.3 million
- Operating margin 6.3%, in line with the same quarter last year
- Free cash flow margin 0%, down from 9.2% in the same quarter last year
- Backlog $9.36 billion at quarter end, up 6% year on year
- Market capitalization $5.42 billion
“We delivered a strong third quarter, exceeding our commitments with record adjusted EBITDA and adjusted EBITDA margin, and robust operating cash flow and bookings across both Federal Solutions and Critical Infrastructure. This performance highlights the resilience of our diversified portfolio and the strength of our differentiated solutions and products. Strong awards, record total and funded backlog, and a robust pipeline provide a solid foundation for continued organic growth,” said Carey Smith, chair, president and chief executive officer.
Revenue growth
A company’s long-term performance is an indicator of its overall quality. Any business can deliver a good quarter or two, but many enduring ones grow for years. Over the last five years, Parsons grew its revenue at an impressive 11.5% compounded annual growth rate. Its growth beat the average industrials company and shows its offerings resonate with customers.
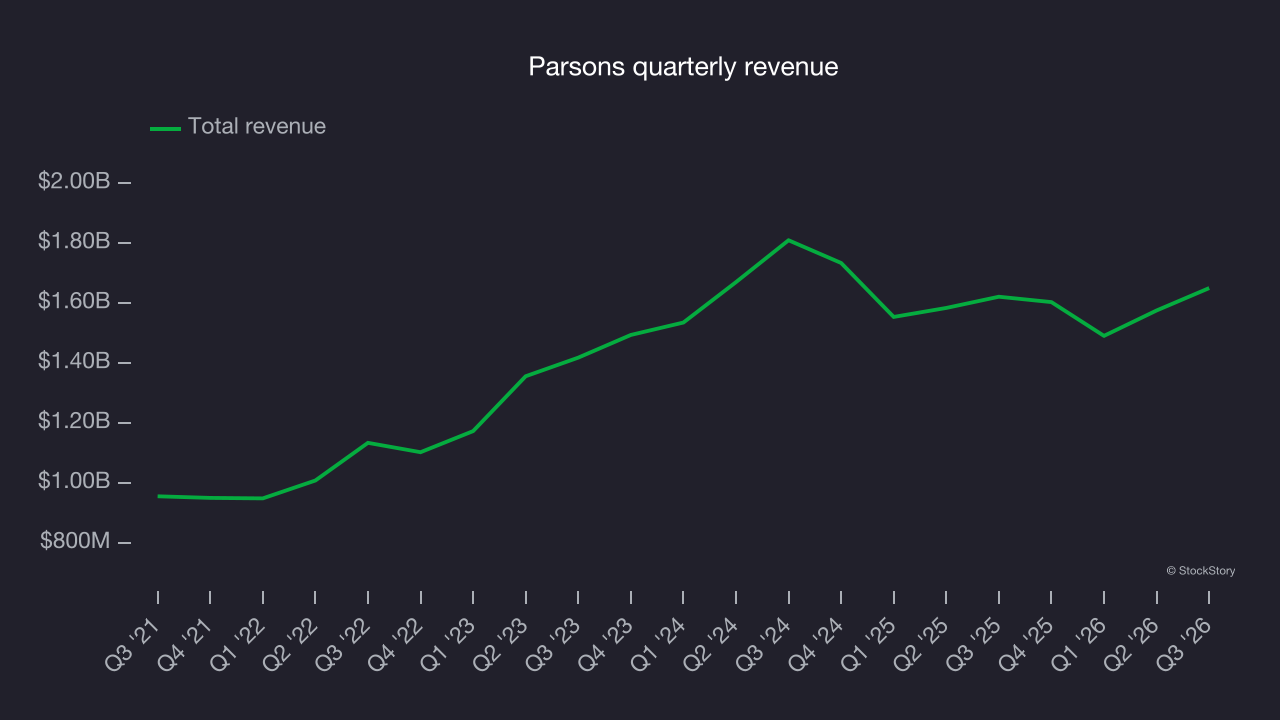
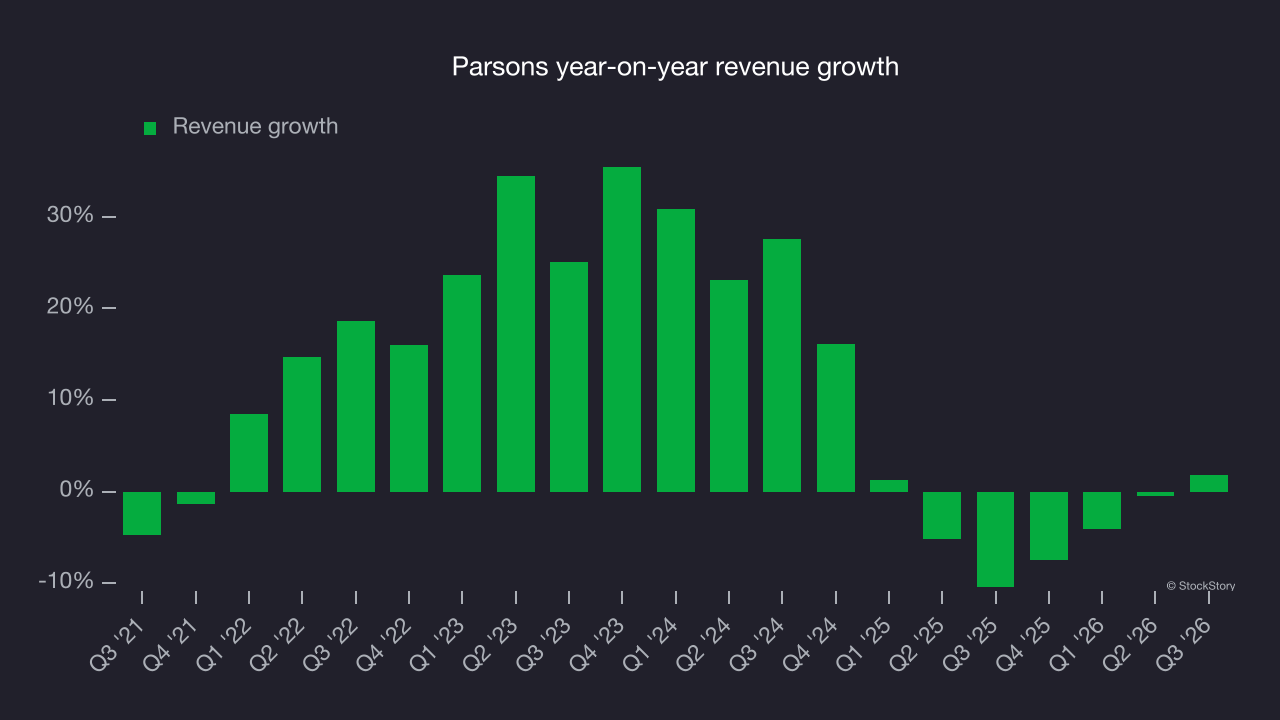
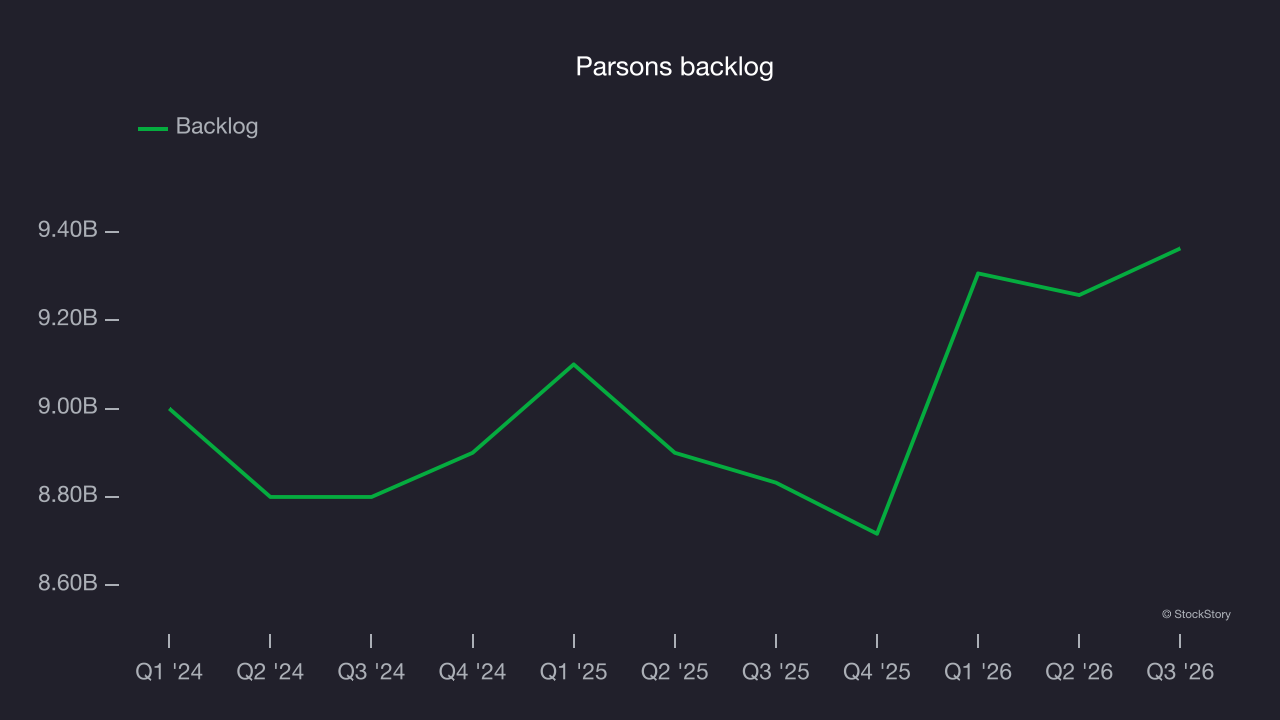
This quarter, Parsons reported modest year-on-year revenue growth of 1.8% but beat Wall Street’s consensus estimates by 2%.
Looking ahead, sell-side analysts expect revenue to grow 5.1% over the next 12 months, according to S&P. Although this projection implies its newer products and services will drive better revenue growth, it is still below average for the sector.
Operating margin
Operating margin is a key measure of profitability. Think of it as net income, the bottom line, excluding the impact of taxes and interest on debt, which are less connected to business fundamentals.
Parsons’s operating margin has remained roughly unchanged over the last 12 months, averaging 5.5% over the last five years. This profitability was poor for an industrials business, reflecting its suboptimal cost structure.
Parsons’s operating margin might have fluctuated slightly but has generally stayed the same over the last five years. This raises questions about the company’s expense base because its revenue growth should have given it leverage on its fixed costs, resulting in better economies of scale and profitability.
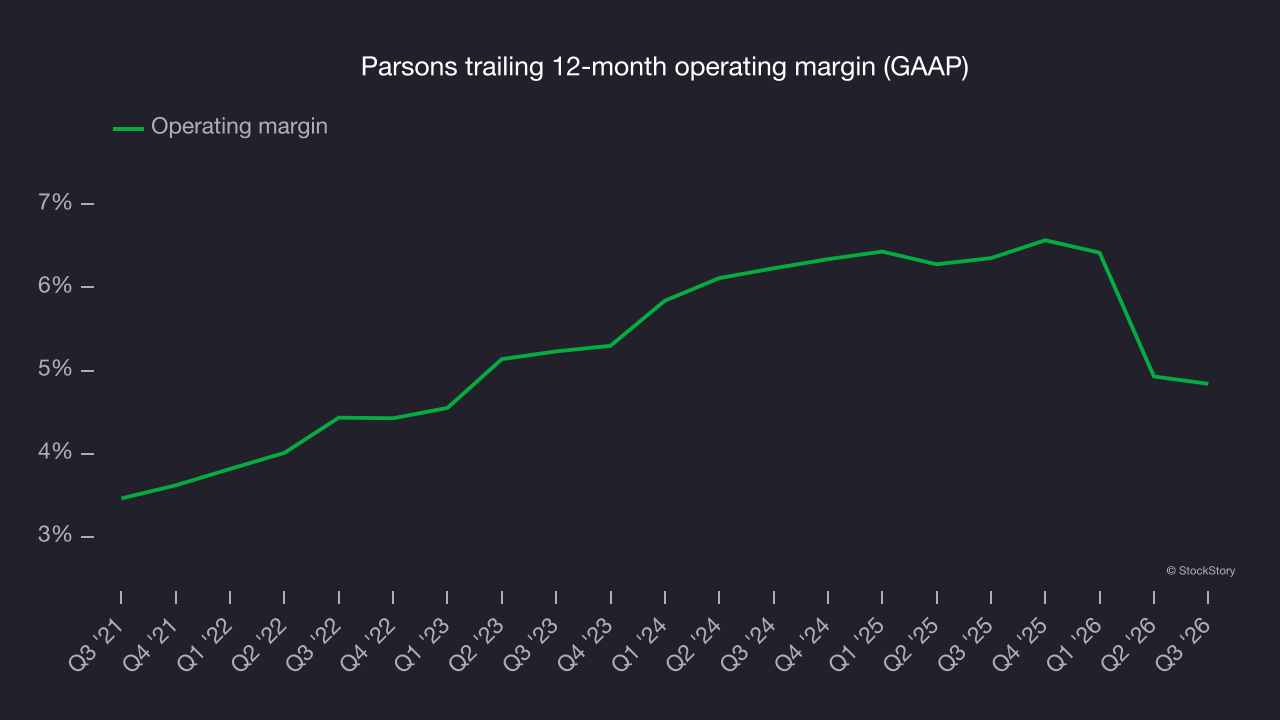
This quarter, Parsons generated an operating margin of 6.3%, in line with the same quarter last year. This indicates the company’s overall cost structure has been relatively stable.
Earnings per share
Revenue trends explain a company’s historical growth, but the long-term change in earnings per share (EPS) points to the profitability of that growth. For example, a company could inflate its revenue through excessive spending on advertising and promotions.
Parsons’s EPS grew at a 15.4% compounded annual growth rate over the last five years, higher than its 11.5% annualized revenue growth. This indicates the company became more profitable on a per-share basis as it expanded.
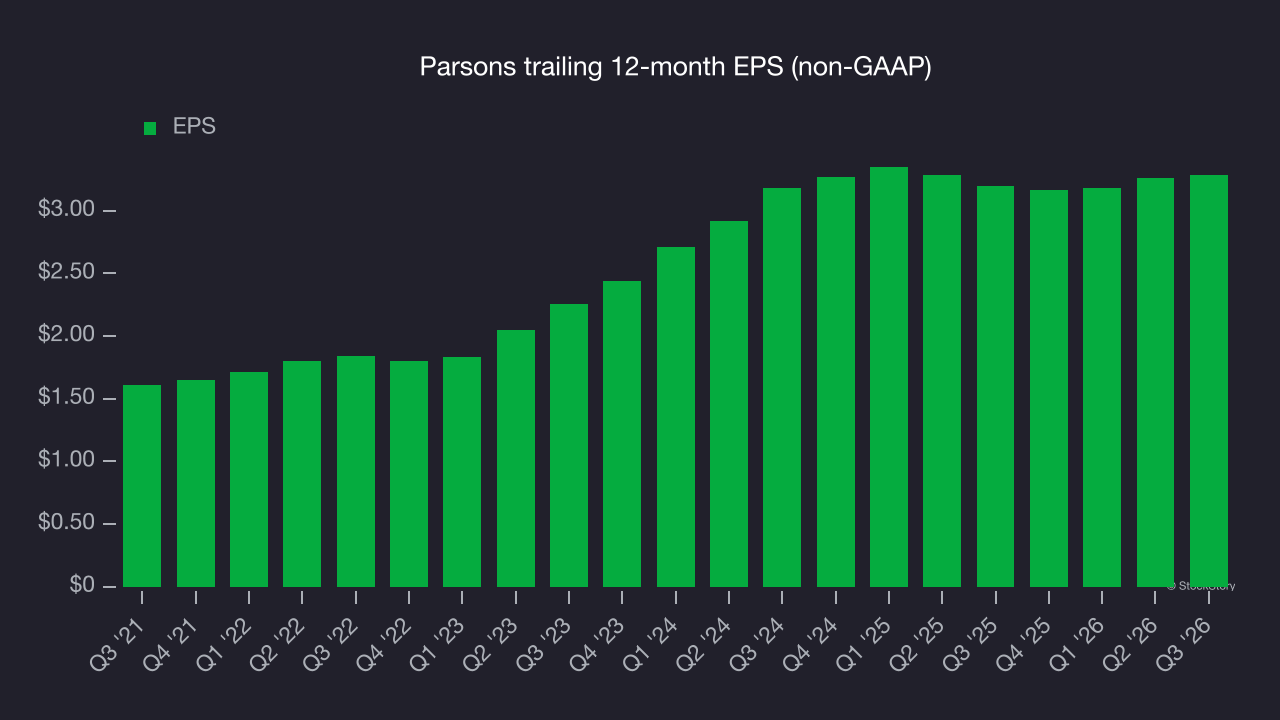
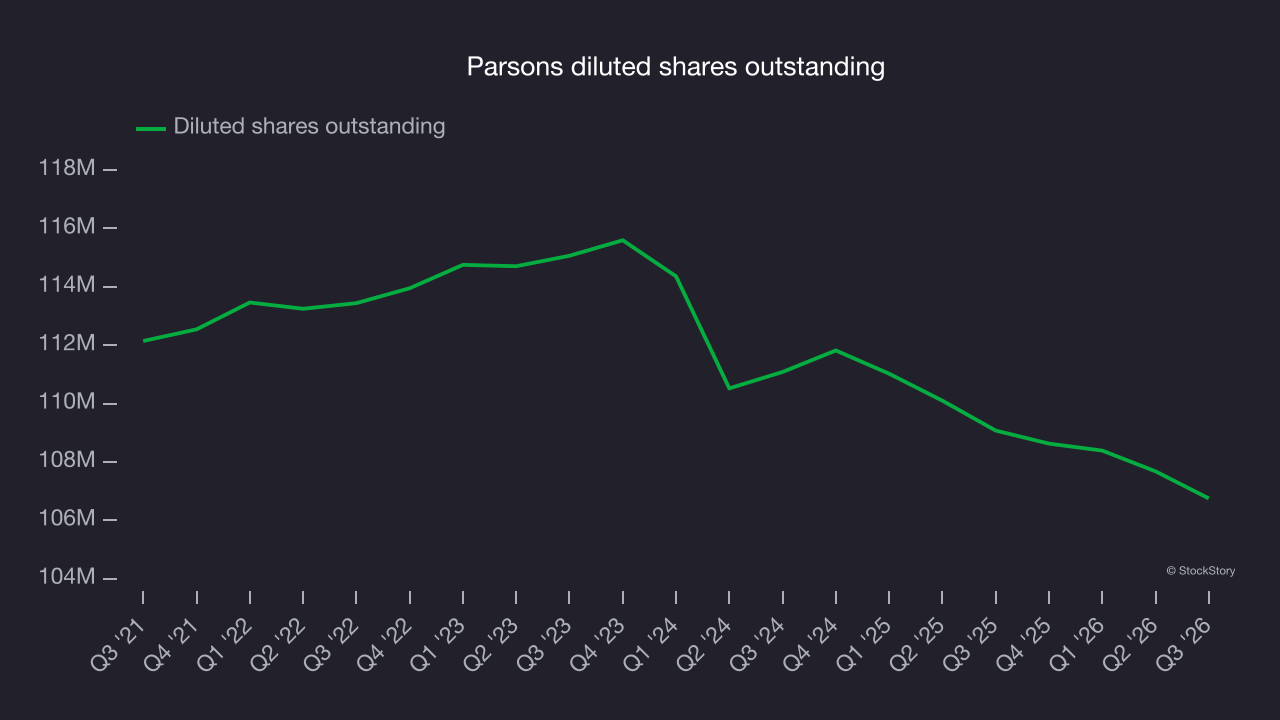
As with revenue, examining EPS over a more recent period can provide insight into an emerging theme or development for the business.
For Parsons, its two-year annual EPS growth of 1.7% was lower than its five-year trend. An acceleration in growth would be welcome.
In Q3, Parsons reported adjusted EPS of $0.89, up from $0.86 in the same quarter last year. EPS easily cleared analysts’ consensus estimates, a positive result for shareholders. Over the next 12 months, Wall Street expects Parsons’s full-year EPS to grow 4.3% from $3.29 to $3.43, according to S&P.
Key takeaways from Parsons’s Q3 results
We enjoyed seeing Parsons beat analysts’ EBITDA expectations this quarter. We were also glad its revenue outperformed Wall Street’s estimates. On the other hand, full-year revenue guidance slightly missed. Overall, we think this was a mixed quarter. The market seemed to be hoping for more, and the stock traded down 6.9% to $47.16 immediately after reporting.
Parsons’ latest quarter matters, but longer-term business quality and valuation matter more when deciding whether to invest in the stock. Read the full research report here (it’s free).