Hotel franchisor Choice Hotels (NYSE: CHH) beat Wall Street’s revenue expectations in Q3 2026, with revenue rising 2.5% year on year to $458.3 million. Its non-GAAP profit of $2.33 per share was 1.8% above analysts’ consensus estimates.
For more on Choice Hotels, read our full research report for free.
Choice Hotels (CHH) Q3 2026 highlights:
- Revenue $458.3 million vs S&P analysts’ consensus estimates of $448.4 million (2.5% year-on-year growth, 2.2% beat)
- Adjusted EPS $2.33 vs S&P analysts’ consensus estimates of $2.29 (1.8% beat)
- Adjusted EBITDA $192.5 million vs analysts’ consensus estimates of $193.3 million (42% margin, in line)
- Adjusted EPS guidance Management slightly raised its full-year adjusted EPS guidance to $7.00 at the midpoint
- EBITDA guidance $646 million at the midpoint for the full year, in line with analysts’ consensus estimates
- Operating margin 23.2%, down from 31.8% in the same quarter last year
- Free cash flow margin 10.2%, up from 9% in the same quarter last year
- RevPAR $67.41 at quarter end, up 11.7% year on year
- Market capitalization $4.96 billion
"Our third-quarter results reflect continued progress against our key priorities: the U.S. net rooms growth rate improved for the third consecutive quarter, U.S. RevPAR growth strengthened, and capital recycling is underway," said Dom Dragisich, President and Chief Executive Officer. "Our focus is on returning to the fundamentals that have driven our success for decades, while continuing to invest in commercial and technology capabilities that help franchisees capture more demand. We expect U.S. net rooms growth to accelerate to approximately 1% by year-end, and stronger demand trends support our increased full-year RevPAR outlook. These improvements position us to deliver more consistent financial performance and stronger long-term free cash flow for shareholders."
Revenue growth
Examining a company’s long-term performance can provide clues about its quality. Any business can deliver a good quarter or two, but the best consistently grow over the long term. Over the last five years, Choice Hotels grew its revenue at a 10.8% compounded annual growth rate. Though this growth is acceptable on an absolute basis, the consumer discretionary sector’s significant earnings volatility calls for scrutiny beyond top-line growth. The bar for the sector is particularly high, reflecting the nonessential and hit-driven nature of the products and services offered. Additionally, the five-year CAGR starts around Covid, when revenue was depressed before rebounding.
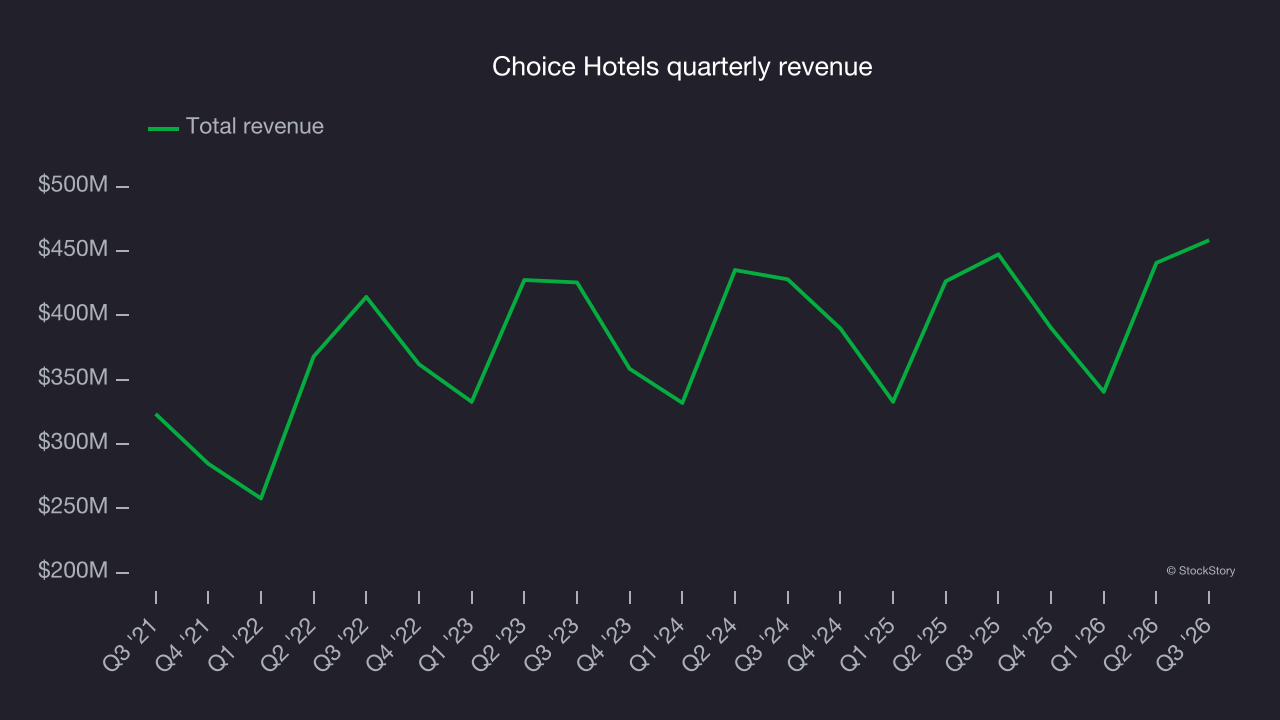
Long-term growth matters most, but within consumer discretionary, a stretched historical view may miss a company riding a successful new property or trend. Choice Hotels’s recent performance shows its demand has slowed as its annualized revenue growth of 2.4% over the last two years was below its five-year trend. Revenue growth deceleration in the sector warrants caution, as it could signal changing consumer tastes aided by low switching costs. 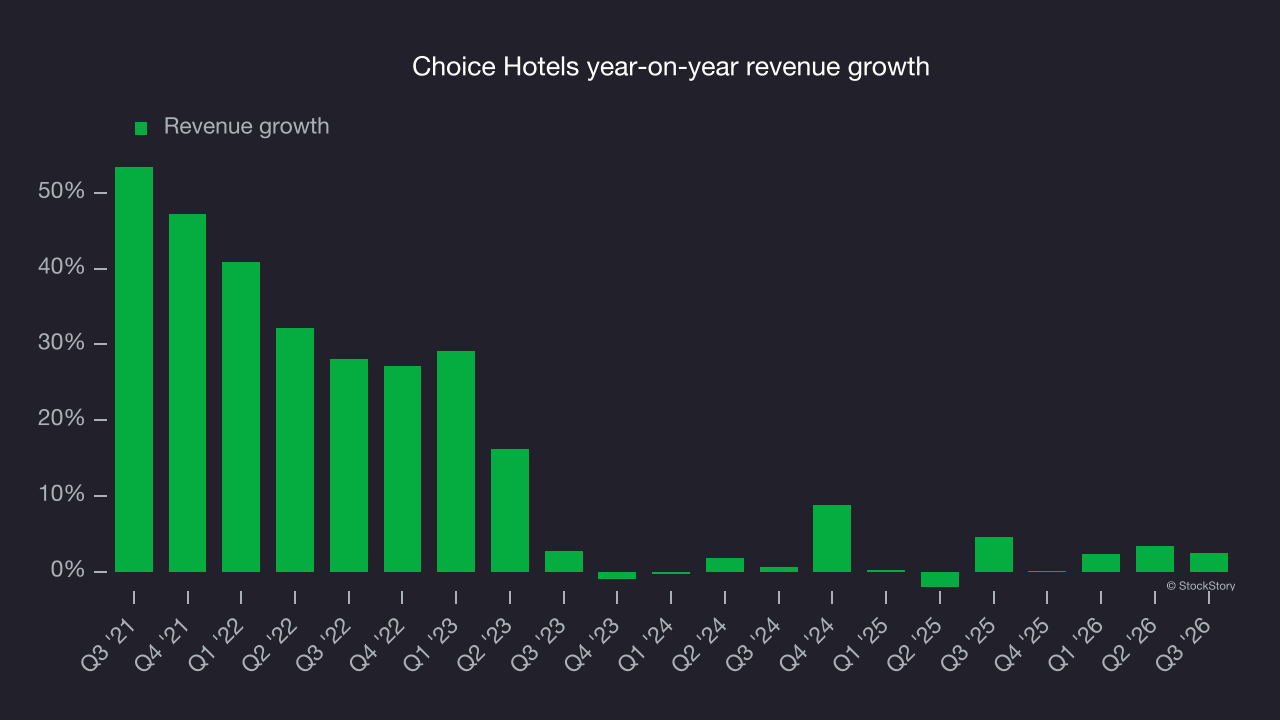
Revenue per available room, a key metric accounting for daily rates and occupancy levels, provides more insight into the company’s revenue dynamics and was $67.41 this quarter. Over the last two years, Choice Hotels’s revenue per room averaged an underwhelming 2.5% year-on-year growth. That pace is unsurprising given that it’s in line with revenue growth. Hotels sometimes pursue ancillary revenue growth because they are price takers in room revenue. 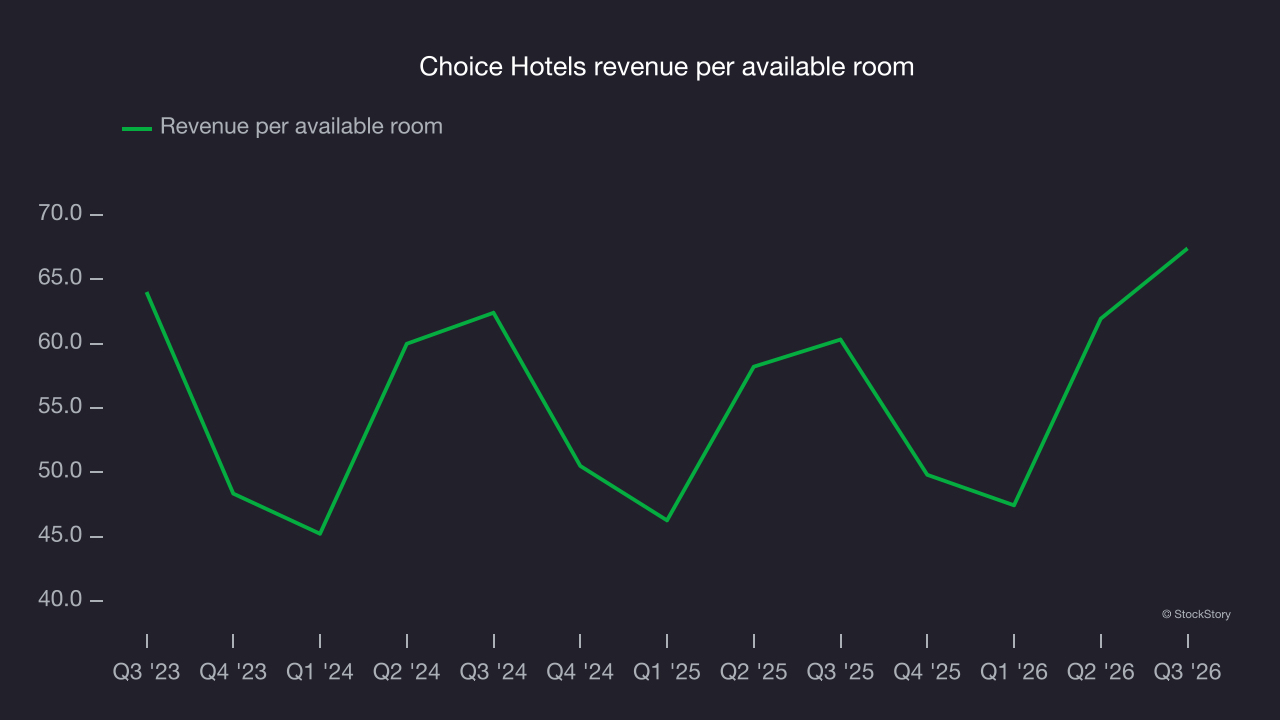
This quarter, Choice Hotels reported modest year-on-year revenue growth of 2.5% but beat Wall Street’s consensus estimates by 2.2%.
Looking ahead, sell-side analysts expect revenue to grow 1.1% over the next 12 months, according to S&P, similar to its two-year rate. This projection is underwhelming and suggests its products and services will see some demand headwinds.
Operating margin
Operating margin is a key measure of profitability. Think of it as net income – the bottom line – excluding the impact of taxes and interest on debt, which are less connected to business fundamentals.
Choice Hotels’s operating margin has been trending down over the last 12 months and averaged 26% over the last two years. The company’s profitability was mediocre for a consumer discretionary business and shows it couldn’t pass its higher operating expenses on to its customers.
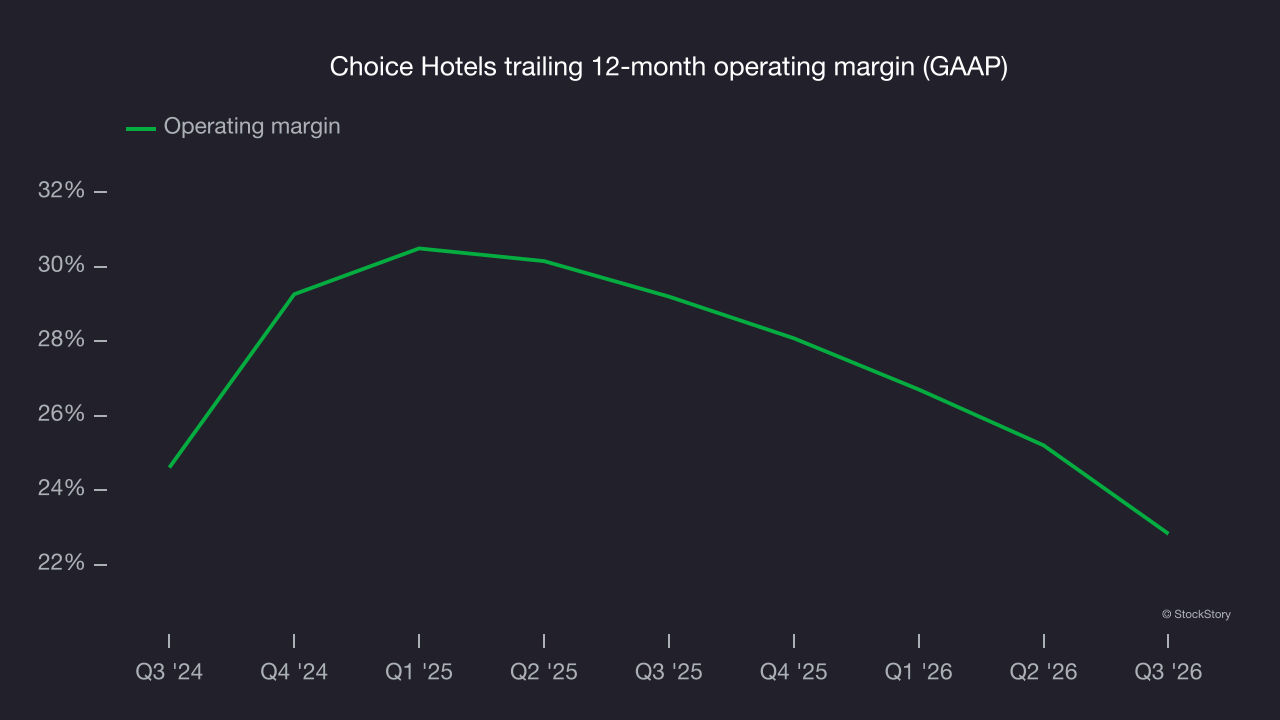
This quarter, Choice Hotels generated an operating margin of 23.2%, down 8.6 percentage points year on year. This contraction shows it was less efficient because its expenses grew faster than its revenue.
Earnings per share
We track the long-term change in earnings per share (EPS) for the same reason as long-term revenue growth. Compared to revenue, however, EPS highlights whether a company’s growth is profitable.
Choice Hotels’s EPS grew at a 13% compounded annual growth rate over the last five years. This performance was better than its revenue growth but doesn’t tell us much about its business quality because its operating margin improvement lagged that of peers.
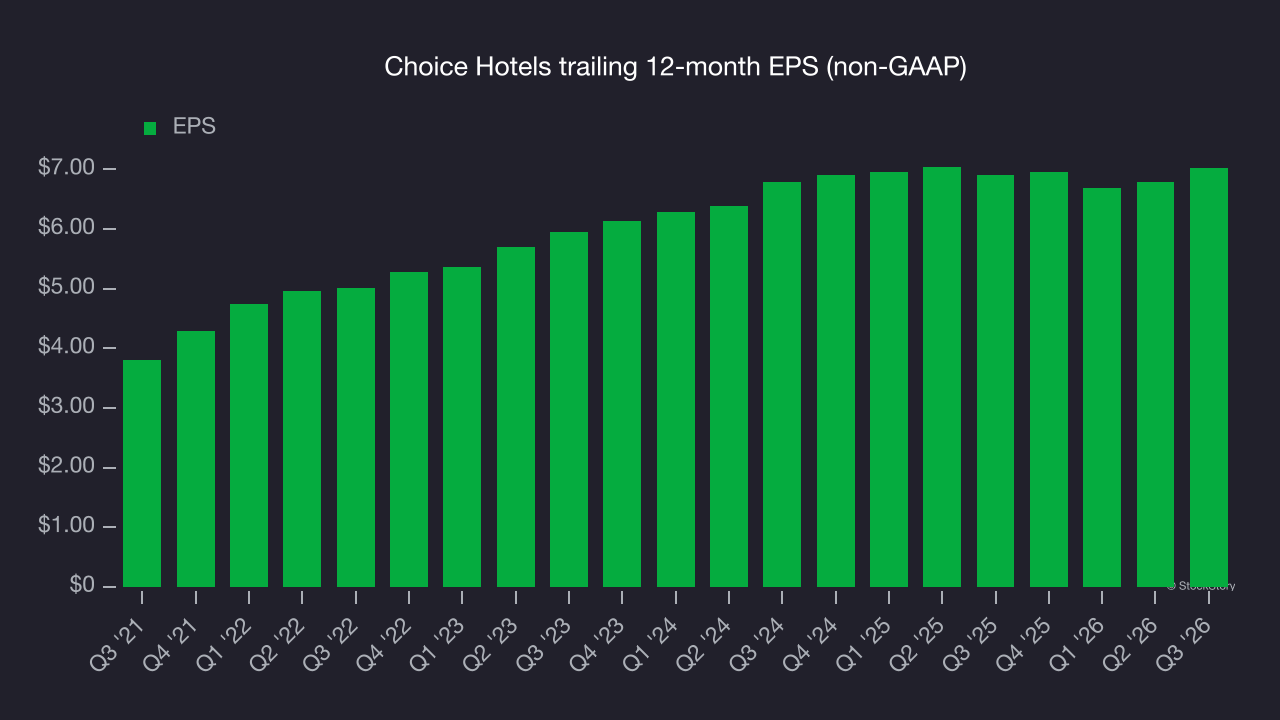
In Q3, Choice Hotels reported adjusted EPS of $2.33, up from $2.10 in the same quarter last year. This result beat analysts’ consensus estimates by 1.8%. Over the next 12 months, Wall Street expects Choice Hotels’s full-year EPS to grow 7.1% from $7.02 to $7.52, according to S&P.
Key takeaways from Choice Hotels’s Q3 results
Choice Hotels delivered a decent Q3, with revenue topping analysts’ consensus estimates. Shares remained flat at $110.93 immediately after the release.
To assess Choice Hotels at its current price, consider the bigger picture of valuation and business quality as well as the latest earnings. For more on Choice Hotels, read the full research report here (it’s free).