Performance marketing company QuinStreet (NASDAQ: QNST) beat Wall Street’s revenue expectations in calendar Q3 2026 (fiscal Q1 2027), with revenue up 45.8% year on year to $416.7 million. In addition, next quarter’s revenue guidance ($370 million at the midpoint) was a positive surprise, coming in 6.4% above analysts’ consensus estimates. Its non-GAAP profit of $0.50 per share was 27.7% above analysts’ consensus estimates.
For more on QuinStreet, read the full research report for free.
QuinStreet (QNST) Q3 CY2026 highlights:
- Revenue $416.7 million vs S&P analysts’ consensus estimates of $374.4 million (45.8% year-on-year growth, 11.3% beat)
- Adjusted EPS $0.50 vs S&P analysts’ consensus estimates of $0.39 (27.7% beat)
- Adjusted EBITDA $42.67 million vs analysts’ consensus estimates of $38.26 million (10.2% margin, 11.5% beat)
- Revenue guidance $1.55 billion at the midpoint for the full year, above analysts’ consensus estimates of $1.5 billion
- EBITDA guidance $160 million at the midpoint for the full year, above analysts’ consensus estimates of $153.8 million
- Operating margin 5.6%, up from 1.7% in the same quarter last year
- Free cash flow margin 4.9%, similar to the same quarter last year
- Market capitalization $1.04 billion
“We saw continued strength and broadening of carrier demand in Auto Insurance and made good progress expanding our footprint for future growth in that important client vertical. Strong momentum also continued across our Home Services platform, including HomeBuddy, whose integration continues to go well. Our overall footprint for Company growth, and expectations for continued strong performance – short and long term – have never been greater.”
Revenue growth
A company’s long-term revenue performance is one signal of its overall quality. Any business can have short-term success, but a top-tier one grows for years.
With $1.42 billion in revenue over the past 12 months, QuinStreet is a mid-sized business services company, which sometimes brings disadvantages compared to larger competitors benefiting from better economies of scale. On the positive side, it can still deliver high growth rates because it’s working from a smaller revenue base.
QuinStreet grew its revenue at a strong 18.9% compounded annual growth rate over the last five years. This shows QuinStreet’s demand was higher than that of many business services companies.
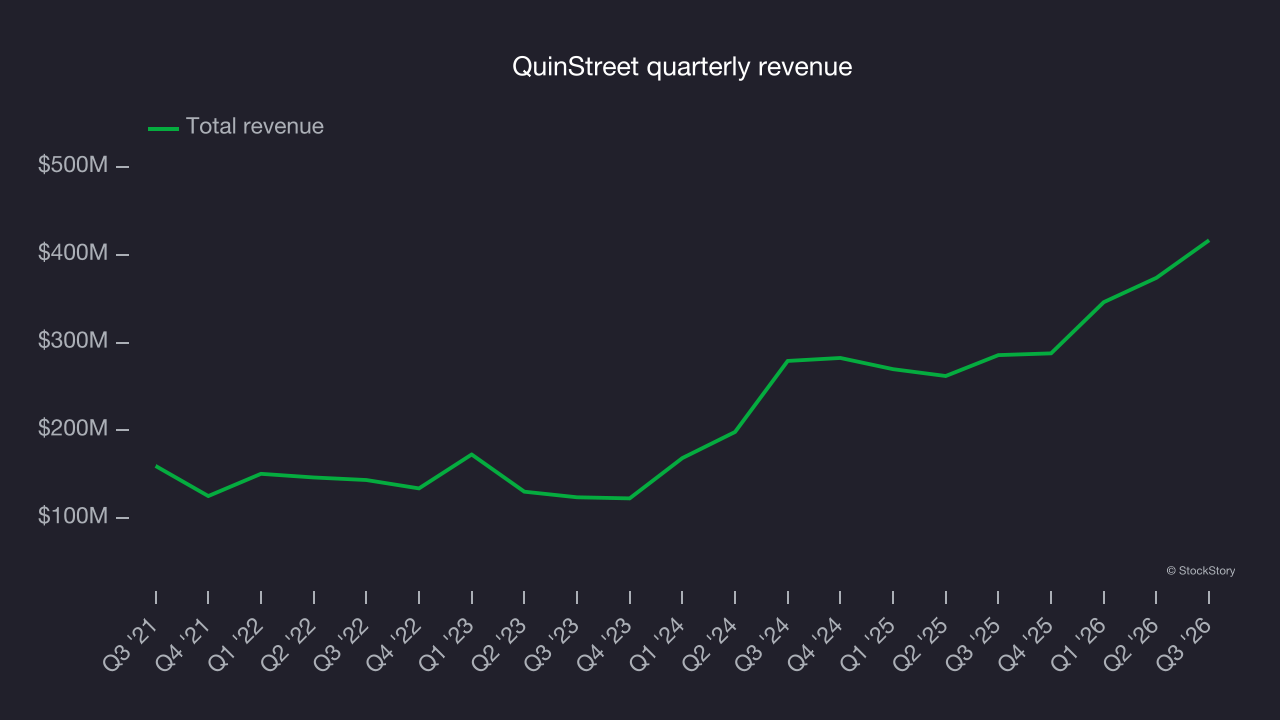
Long-term growth matters most, but within business services, a half-decade historical view may miss recent innovations or disruptive industry trends. QuinStreet’s annualized revenue growth of 36.1% over the last two years is above its five-year trend, suggesting its demand was strong and recently accelerated. 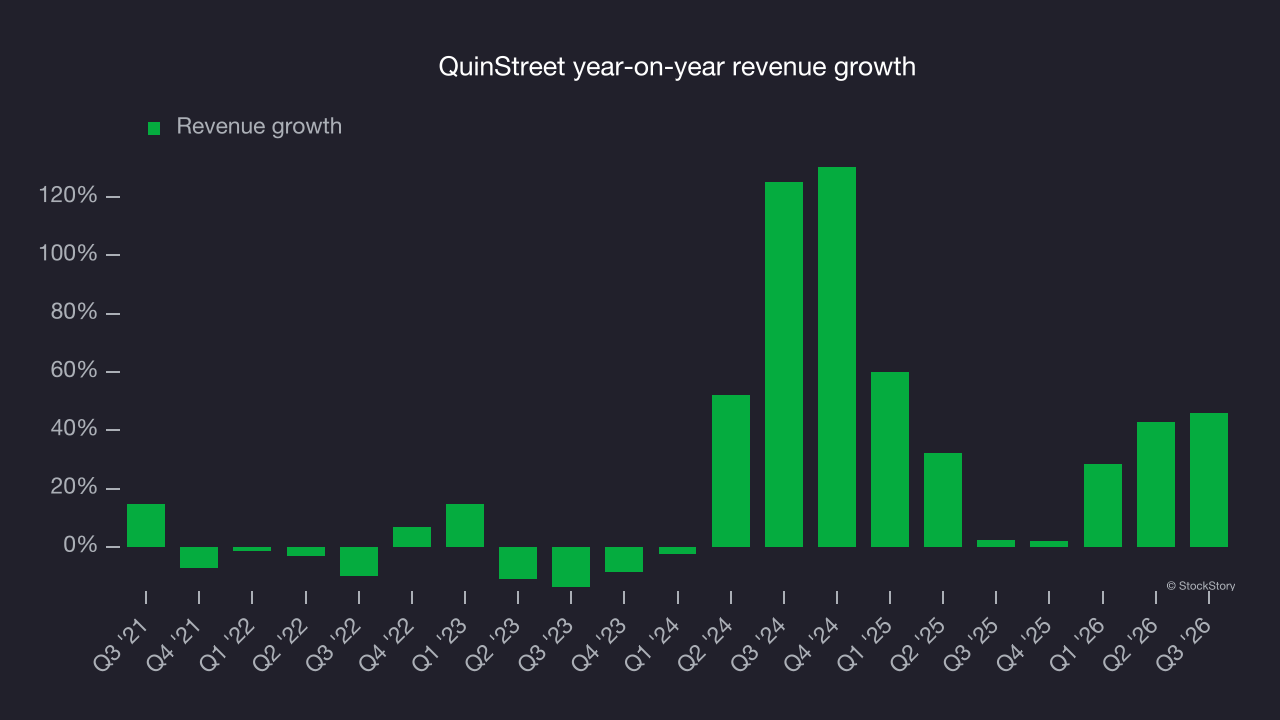
This quarter, QuinStreet reported year-on-year revenue growth of 45.8%, and its $416.7 million in revenue beat Wall Street’s consensus estimates by 11.3%. Company management is guiding for a 28.5% year-on-year increase in revenue next quarter.
Looking further ahead, sell-side analysts expect revenue to grow 8.2% over the next 12 months, according to S&P, a deceleration versus the last two years. Still, this projection is healthy and indicates the market sees success for its products and services.
Adjusted operating margin
QuinStreet was roughly breakeven when averaging the last five years of quarterly operating profits, inadequate for a business services business.
On the positive side, QuinStreet’s adjusted operating margin rose by 7 percentage points over the last five years, as its revenue growth provided operating leverage.
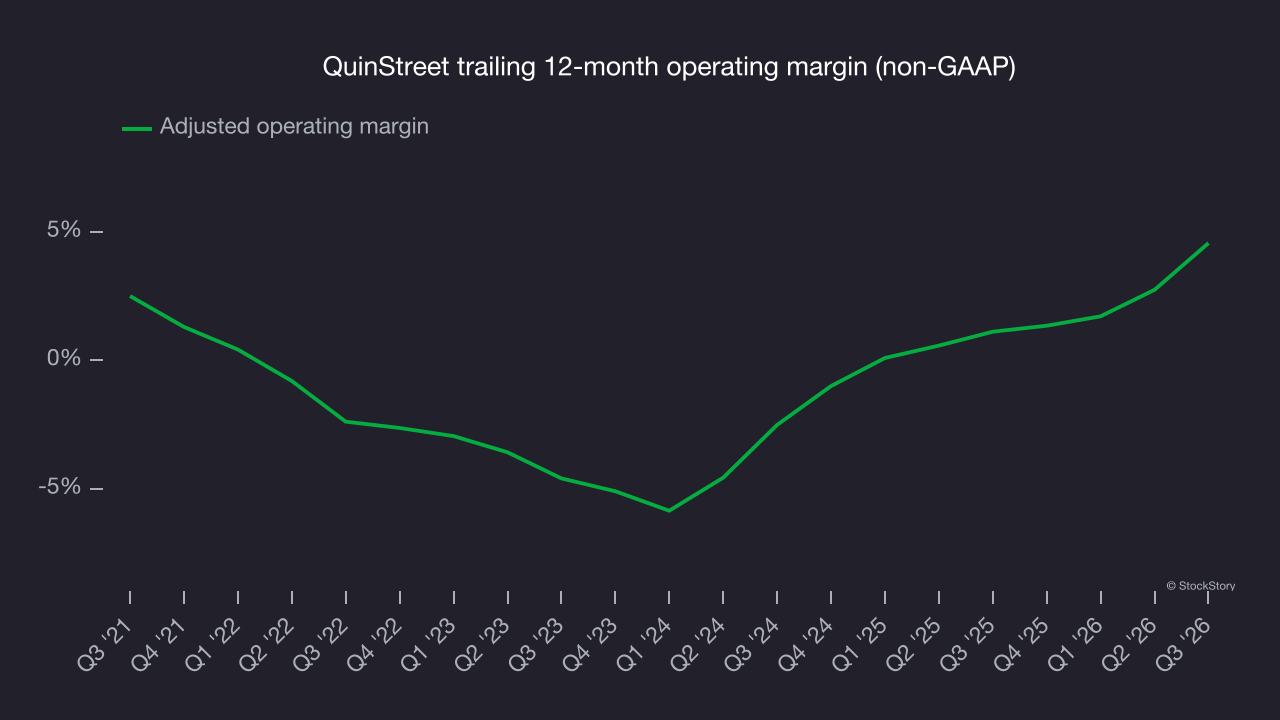
In Q3, QuinStreet generated an adjusted operating margin of 8.2%, up 6.6 percentage points year on year. This improvement shows it was more efficient.
Earnings per share
We track the long-term change in earnings per share (EPS) for the same reason as long-term revenue growth. Compared to revenue, however, EPS highlights whether a company’s growth is profitable.
QuinStreet’s strong 18.3% annual EPS growth over the last five years aligns with its revenue performance. This indicates its incremental revenue was profitable.
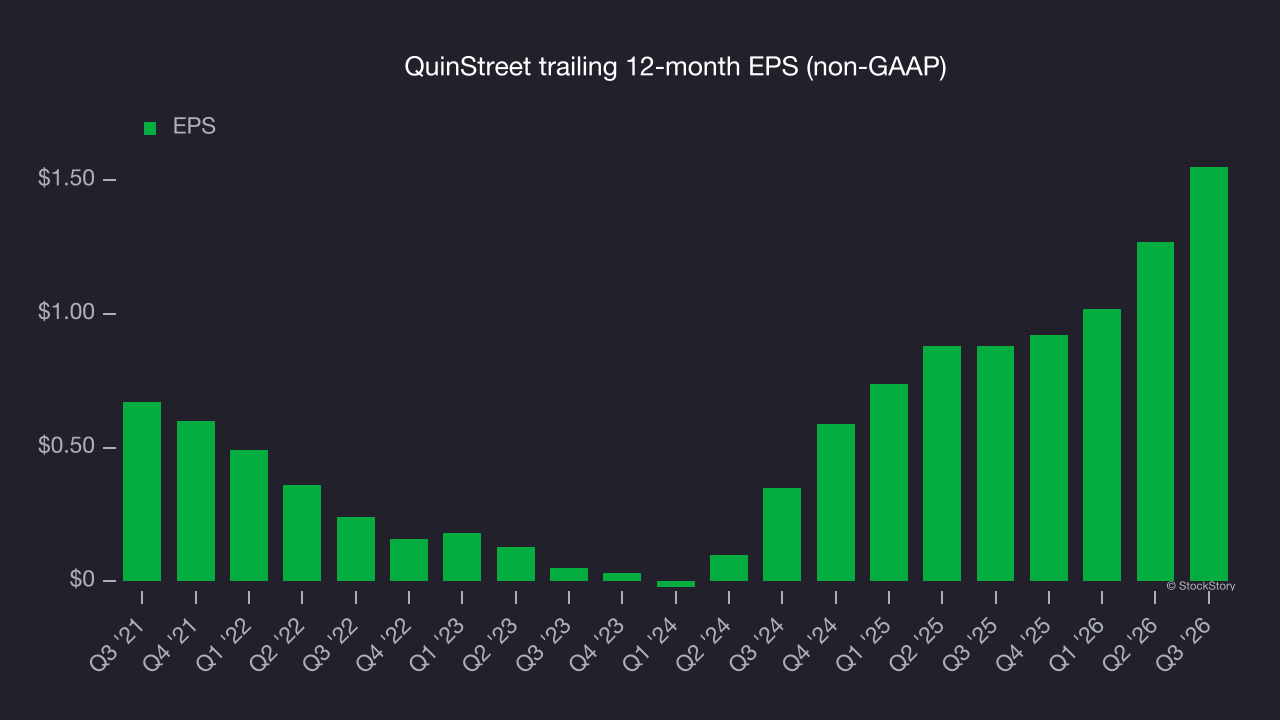
Like with revenue, we analyze EPS over a more recent period because it can provide insight into an emerging theme or development for the business.
QuinStreet’s two-year annual EPS growth of 110% was strong and topped its 36.1% two-year revenue growth.
Diving into the nuances of QuinStreet’s earnings can give us a better understanding of its performance. QuinStreet’s adjusted operating margin has expanded over the last two years. This was the most relevant factor (aside from the revenue impact) behind its higher earnings; interest expenses and taxes can also affect EPS but don’t tell us as much about a company’s fundamentals.
In Q3, QuinStreet reported adjusted EPS of $0.50, up from $0.22 in the same quarter last year. This result easily cleared analysts’ consensus estimates, a positive for shareholders. Over the next 12 months, Wall Street expects QuinStreet’s full-year EPS to grow 6.9% from $1.55 to $1.66, according to S&P.
Key takeaways from QuinStreet’s Q3 results
QuinStreet delivered a solid quarter, with revenue beating Wall Street’s consensus estimates by a wide margin and EPS also topping analysts’ consensus estimates. Shares soared 10.4% to $21.26 immediately after the results.
QuinStreet had a solid quarterly earnings result, but is the stock a good investment? That decision calls for a look at valuation and business quality as well as the latest earnings. Read the full research report here (it’s free).