Wireless telecommunications provider Array (NYSE: AD) reported Q3 2026 results topping the market’s revenue expectations, with revenue up 14.3% year on year to $53.87 million. Its GAAP profit of $0.80 per share was 96.4% above analysts’ consensus estimates.
For more on Array, read our free full research report.
Array (AD) Q3 2026 highlights:
- Revenue $53.87 million vs S&P consensus estimates of $53.52 million (14.3% year-on-year growth, 0.7% beat)
- EPS (GAAP) $0.80 vs analysts’ consensus estimates of $0.41 (96.4% beat)
- Adjusted EBITDA $63.74 million vs analysts’ consensus estimates of $55.6 million (118% margin, 14.6% beat)
- Operating margin -4.3%, up from -113% in the same quarter last year
- Free cash flow $3.92 million, up from -$82.1 million in the same quarter last year
- Market capitalization $2.71 billion
"As Array marks its first year as a tower company, we continue to make meaningful progress against our 2026 strategic priorities," said Anthony Carlson, President and CEO. "Our team remains intensely focused on maximizing the value of our tower portfolio by driving tenant growth and enhancing operational efficiency. These efforts are strengthening the earnings power of our assets and positioning the company for long-term value creation."
Revenue growth
Examining a company’s long-term performance can provide clues about its quality. Even a weak business can perform well for one or two quarters, but a high-quality one grows for years.
With $220.3 million in revenue over the past 12 months, Array is a small player in the business services space, which sometimes brings disadvantages compared to larger competitors benefiting from economies of scale and numerous distribution channels.
Array’s demand was weak over the last five years. Its revenue fell by 44.3% annually.
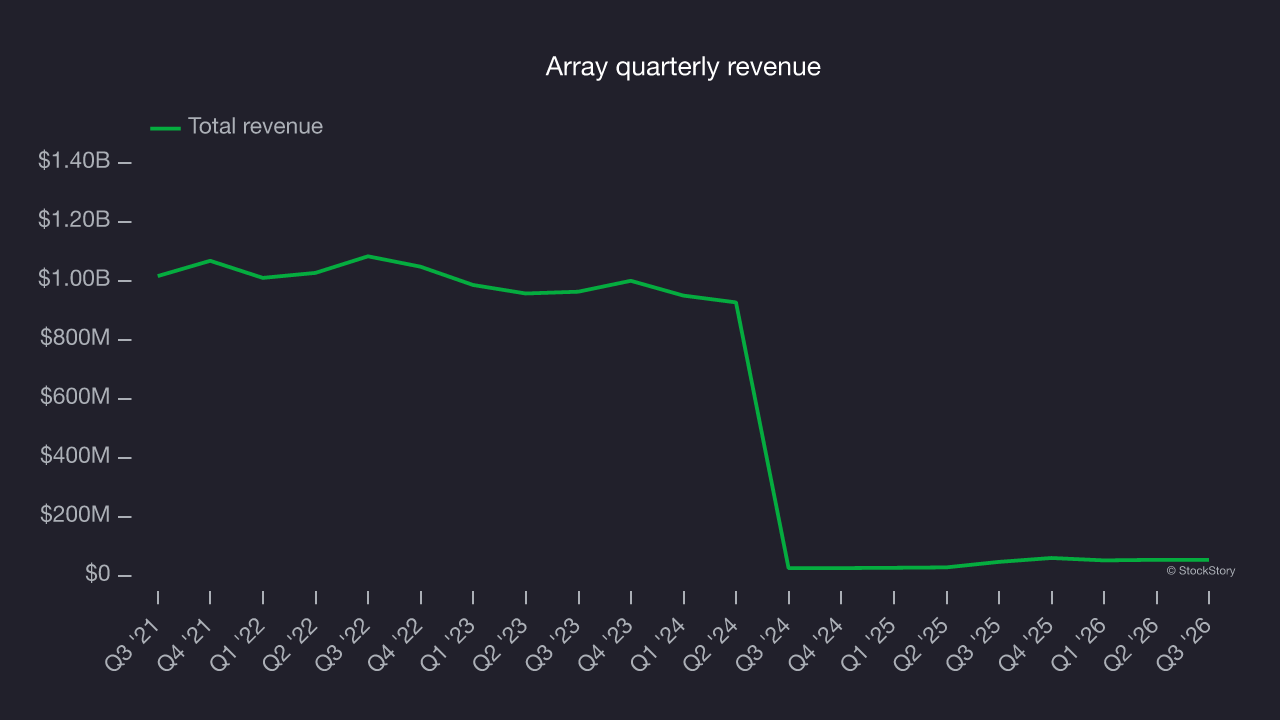
Long-term growth is the most important, but within business services, a half-decade historical view may miss new innovations or demand cycles. Array’s recent performance shows its demand remained suppressed as its revenue has declined by 72.5% annually over the last two years. 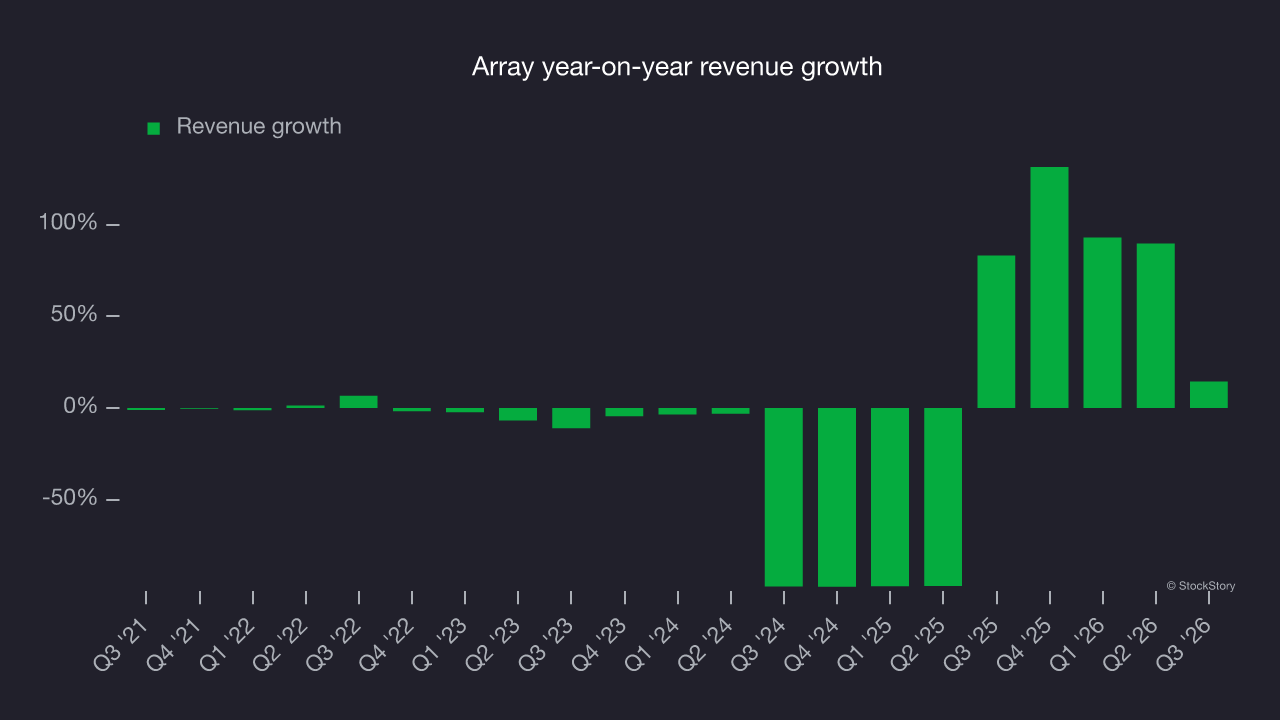
This quarter, Array reported year-on-year revenue growth of 14.3%, and its $53.87 million of revenue exceeded Wall Street’s consensus estimates by 0.7%.
Looking ahead, sell-side analysts expect revenue to decline by 6.9% over the next 12 months, according to S&P. While this projection is better than its two-year trend, the outlook remains uninspiring given the company’s demand struggles.
Adjusted operating margin
Adjusted operating margin is one of the best measures of profitability because it tells us how much money a company takes home after subtracting all core expenses, like marketing and research and development. It also removes various one-time costs to paint a better picture of normalized profits.
Array was profitable over the last five years but held back by its large cost base. Its average adjusted operating margin of 5% was weak for a business services business.
On the positive side, Array’s adjusted operating margin rose significantly over the last five years.
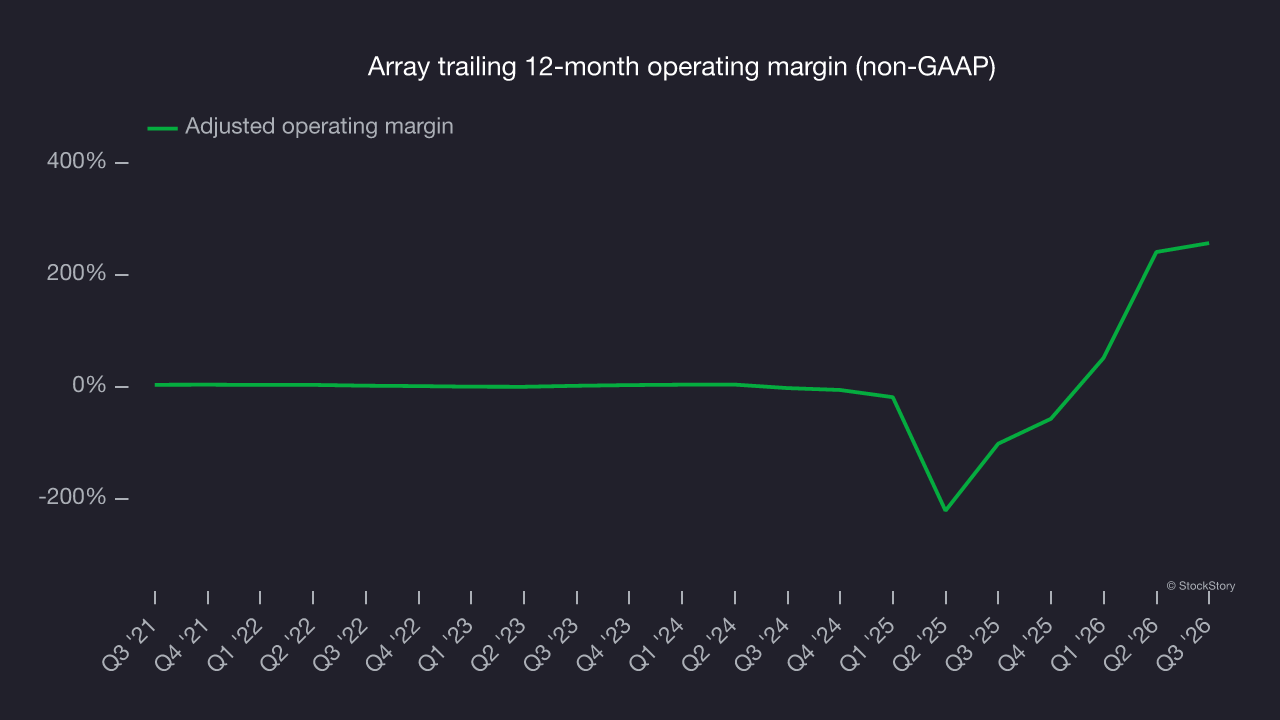
This quarter, Array reported an adjusted operating margin of negative 3.7%, up 109.5 percentage points year on year. This improvement shows it operated more efficiently.
Earnings per share
We track the long-term change in earnings per share (EPS) for the same reason as long-term revenue growth. Compared to revenue, however, EPS highlights whether a company’s growth is profitable.
Array’s EPS grew at a 37.2% compounded annual growth rate over the last five years, higher than its 44.3% annualized revenue declines. This indicates management adapted its cost structure in response to a challenging demand environment.
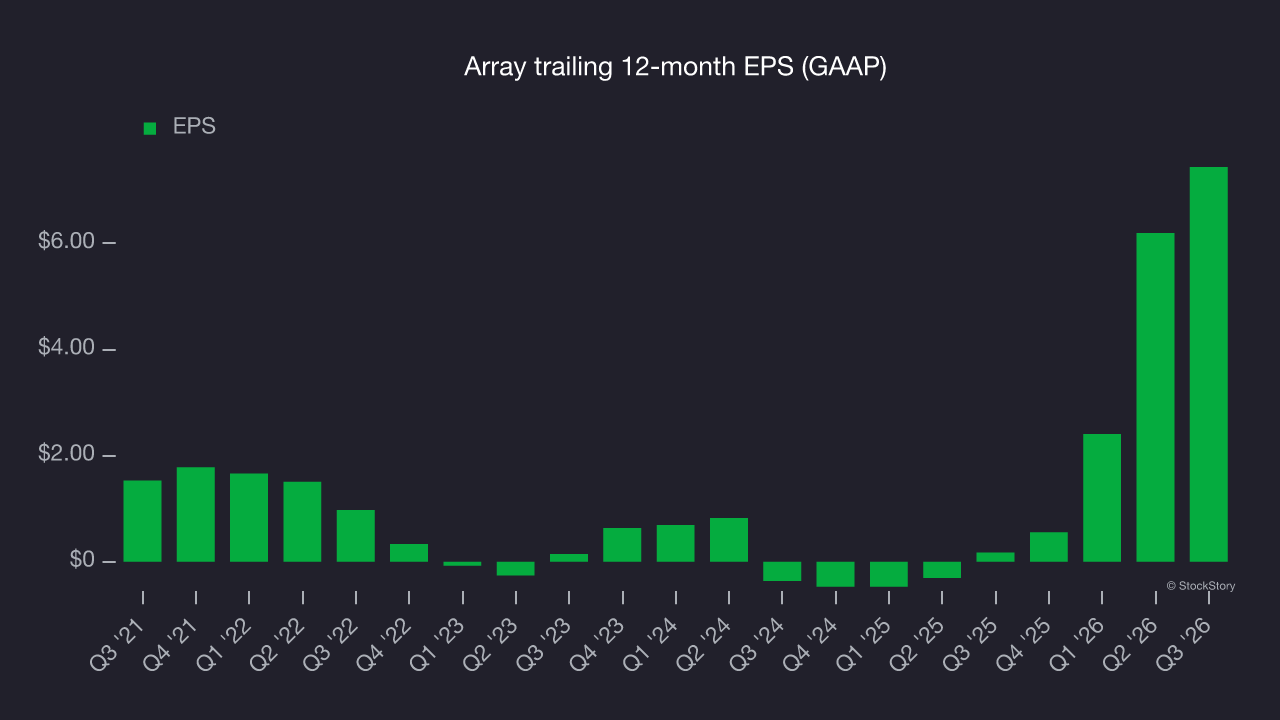
We can take a deeper look into Array’s earnings to better understand the drivers of its performance. As we mentioned earlier, Array’s adjusted operating margin expanded by 254.8 percentage points over the last five years. This was the most relevant factor (aside from the revenue impact) behind its higher earnings; interest expenses and taxes can also affect EPS but don’t tell us as much about a company’s fundamentals.
Like with revenue, we analyze EPS over a shorter period to see if we are missing a change in the business.
For Array, its two-year annual EPS growth of 373% was higher than its five-year trend. That acceleration is a positive sign, especially given the already high earnings base.
In Q3, Array reported EPS of $0.80, up from negative $0.44 in the same quarter last year. This result came in well above analysts’ consensus estimates, a positive outcome for shareholders. Over the next 12 months, Wall Street expects Array’s full-year EPS to shrink by 83.3% from $7.44 to $1.24, according to S&P.
Key takeaways from Array’s Q3 results
Array’s Q3 results had some key positives, with EPS beating analysts’ consensus estimates and revenue narrowly topping Wall Street’s consensus. Investors were likely hoping for more, however, as shares edged lower 1.1% to $31.01 immediately after the results.
When evaluating the stock, consider the bigger picture of valuation, business quality and the latest earnings. Read more in the full research report here (it’s free).