
Energy recovery device manufacturer Energy Recovery (NASDAQ: ERII) beat Wall Street’s revenue expectations in Q1 CY2026, with sales up 20.3% year on year to $9.71 million. Its non-GAAP loss of $0.11 per share was 50% below analysts’ consensus estimates.
Is now the time to buy Energy Recovery? Find out by accessing our full research report, it’s free.
Energy Recovery (ERII) Q1 CY2026 Highlights:
- Revenue: $9.71 million vs analyst estimates of $7.86 million (20.3% year-on-year growth, 23.6% beat)
- Adjusted EPS: -$0.11 vs analyst expectations of -$0.07 (50% miss)
- Adjusted EBITDA: -$7.1 million (-73.2% margin, 18.4% year-on-year growth)
- Adjusted EBITDA Margin: -73.2%, up from -108% in the same quarter last year
- Free Cash Flow Margin: 208%, up from 130% in the same quarter last year
- Market Capitalization: $597.5 million
Company Overview
Having saved far more than a trillion gallons of water, Energy Recovery (NASDAQ: ERII) provides energy recovery devices to the water treatment, oil and gas, and chemical processing sectors.
Revenue Growth
Reviewing a company’s long-term sales performance reveals insights into its quality. Any business can experience short-term success, but top-performing ones enjoy sustained growth for years. Unfortunately, Energy Recovery’s 1.6% annualized revenue growth over the last five years was sluggish. This was below our standards and is a rough starting point for our analysis.
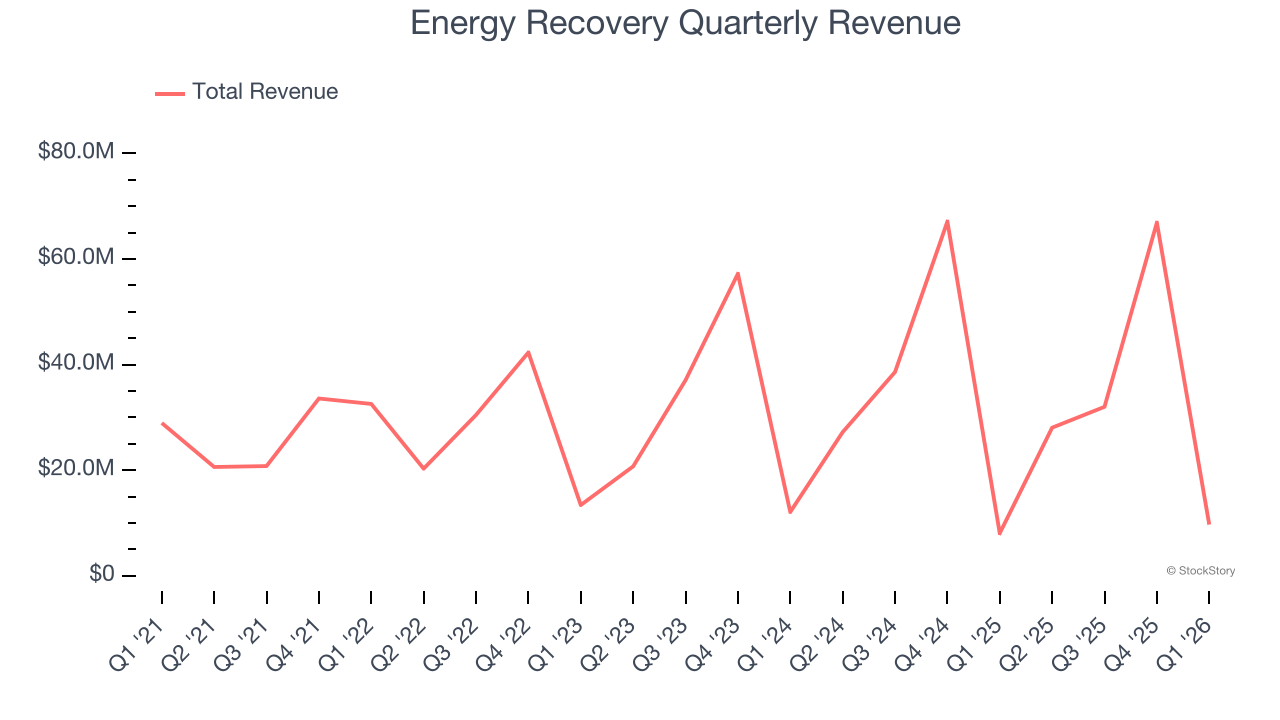
We at StockStory place the most emphasis on long-term growth, but within industrials, a half-decade historical view may miss cycles, industry trends, or a company capitalizing on catalysts such as a new contract win or a successful product line. Energy Recovery’s annualized revenue growth of 3.7% over the last two years is above its five-year trend, which is encouraging. 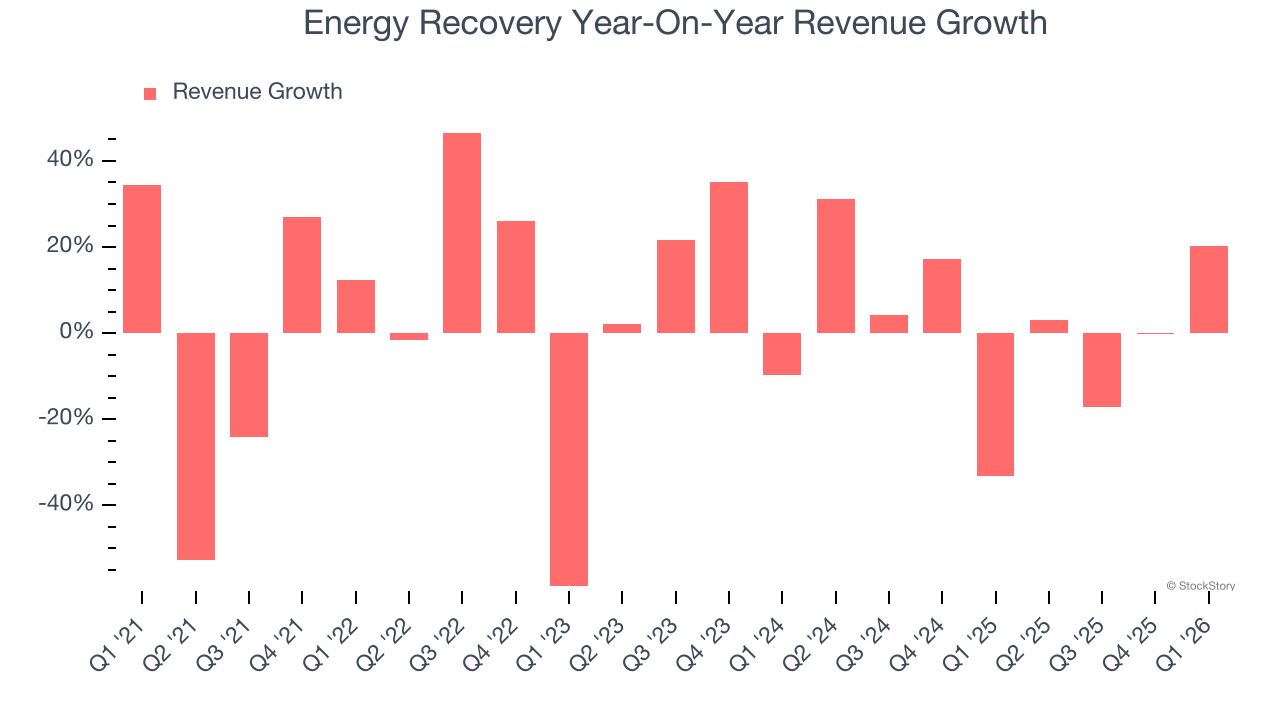
This quarter, Energy Recovery reported robust year-on-year revenue growth of 20.3%, and its $9.71 million of revenue topped Wall Street estimates by 23.6%.
Looking ahead, sell-side analysts expect revenue to decline by 11.3% over the next 12 months, a deceleration versus the last two years. This projection is underwhelming and indicates its products and services will face some demand challenges.
ONE MORE THING: 3 Hidden Platforms Growing 3X Faster than Amazon, Google, and PayPal. Amazon, Google, and Meta all followed the same playbook: Dominate an ignored market. Build an unbeatable moat. Scale until you’re unstoppable.
These three platforms are running that exact playbook right now. The early investors in Amazon made fortunes. The early investors in these could do the same. Get All 3 Stocks Here for FREE.
Operating Margin
Energy Recovery’s operating margin has more or less stayed the same over the last 12 months , averaging 13.4% over the last five years. This profitability was top-notch for an industrials business, showing it’s an well-run company with an efficient cost structure. This result isn’t surprising as its high gross margin gives it a favorable starting point.
Analyzing the trend in its profitability, Energy Recovery’s operating margin might fluctuated slightly but has generally stayed the same over the last five years. This raises questions about the company’s expense base because its revenue growth should have given it leverage on its fixed costs, resulting in better economies of scale and profitability.
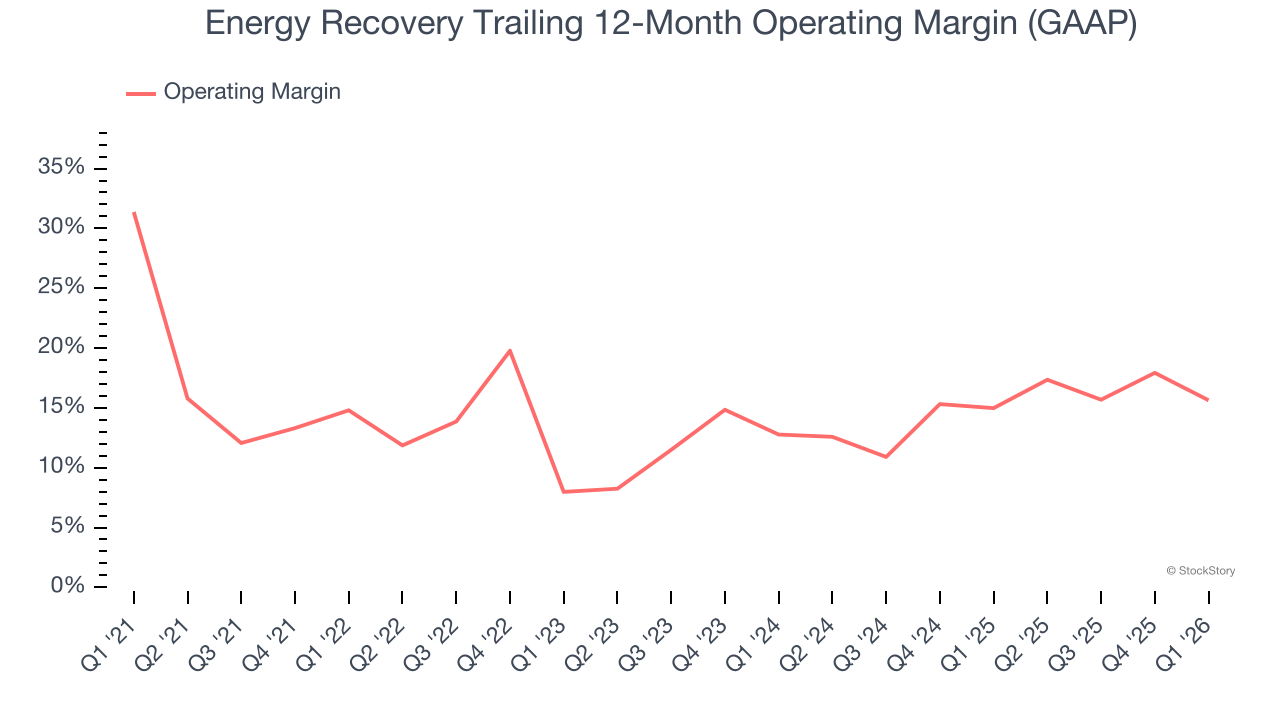
This quarter, Energy Recovery generated an operating margin profit margin of negative 153%, down 4 percentage points year on year. Since Energy Recovery’s gross margin decreased more than its operating margin, we can assume its recent inefficiencies were driven more by weaker leverage on its cost of sales rather than increased marketing, R&D, and administrative overhead expenses.
Earnings Per Share
We track the long-term change in earnings per share (EPS) for the same reason as long-term revenue growth. Compared to revenue, however, EPS highlights whether a company’s growth is profitable.
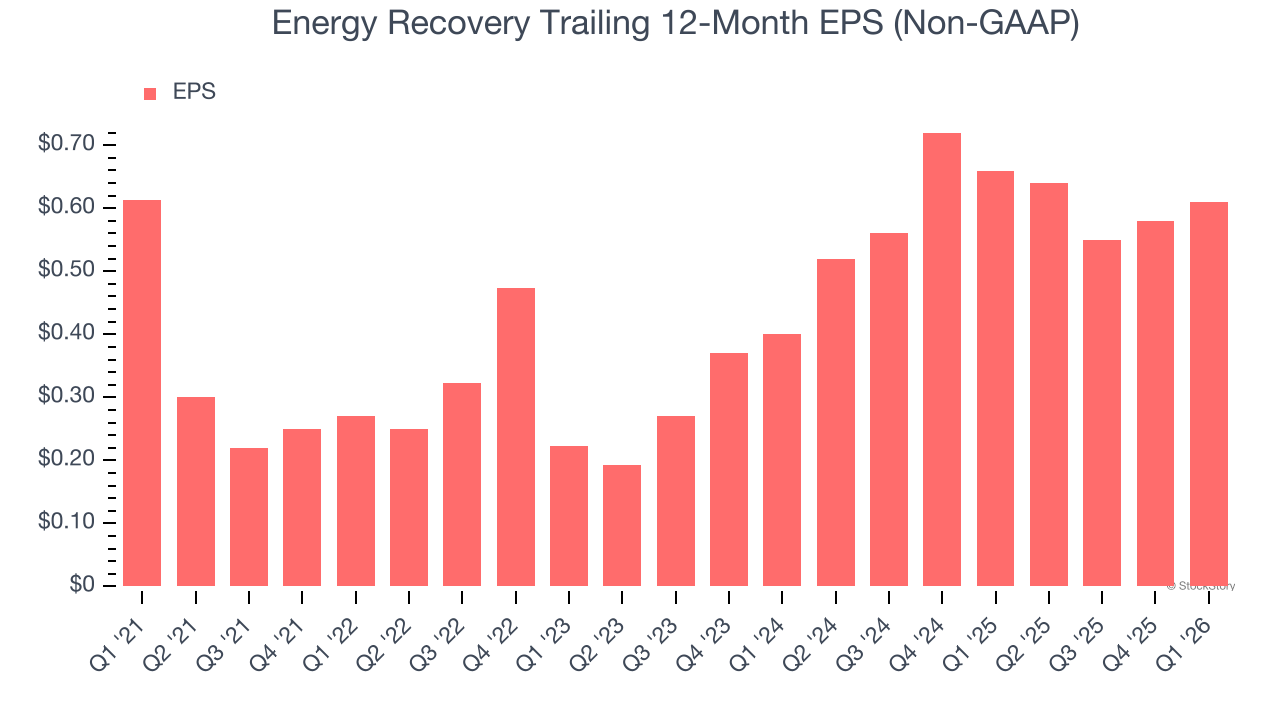
Energy Recovery’s flat EPS over the last five years was below its 1.6% annualized revenue growth. However, its operating margin didn’t change during this time, telling us that non-fundamental factors such as interest and taxes affected its ultimate earnings.
Like with revenue, we analyze EPS over a more recent period because it can provide insight into an emerging theme or development for the business.
Energy Recovery’s two-year annual EPS growth of 23.5% was fantastic and topped its 3.7% two-year revenue growth.
We can take a deeper look into Energy Recovery’s earnings quality to better understand the drivers of its performance. A two-year view shows that Energy Recovery has repurchased its stock, shrinking its share count by 7.8%. This tells us its EPS outperformed its revenue not because of increased operational efficiency but financial engineering, as buybacks boost per share earnings. 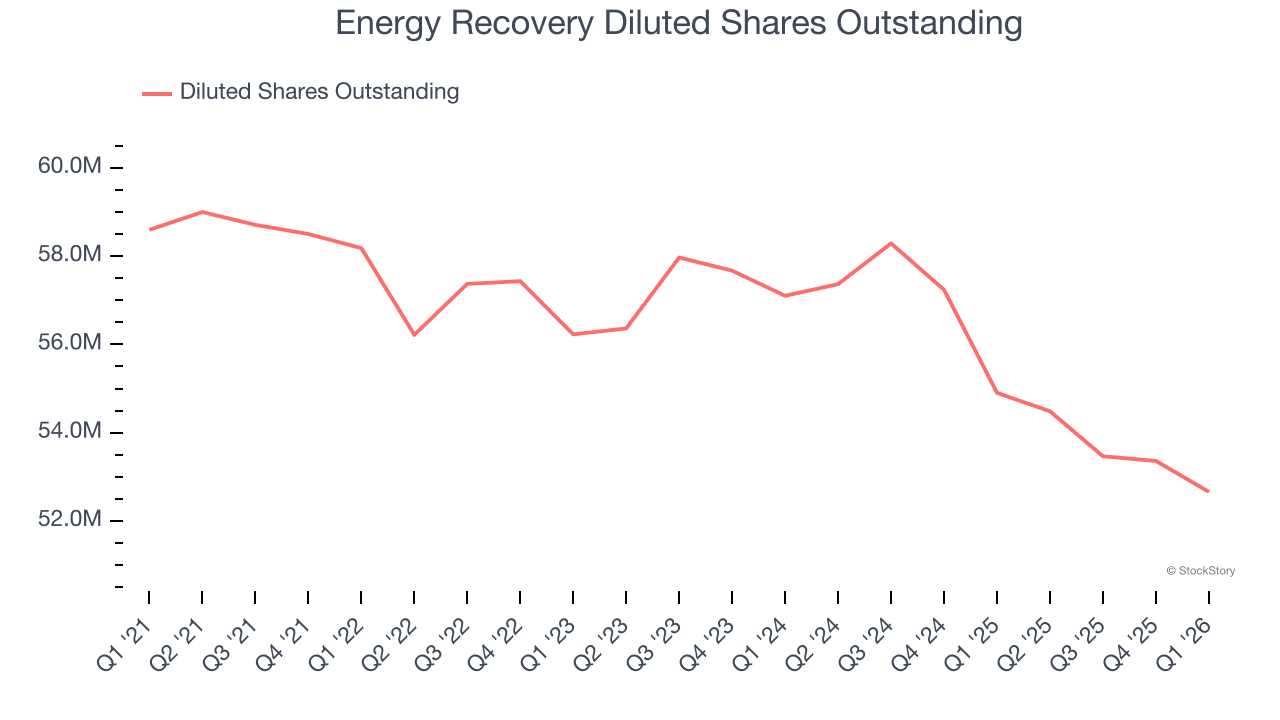
In Q1, Energy Recovery reported adjusted EPS of negative $0.11, up from negative $0.14 in the same quarter last year. Despite growing year on year, this print missed analysts’ estimates. Over the next 12 months, Wall Street expects Energy Recovery’s full-year EPS of $0.61 to grow 14.8%.
Key Takeaways from Energy Recovery’s Q1 Results
We were impressed by how significantly Energy Recovery blew past analysts’ revenue expectations this quarter. On the other hand, its adjusted operating income missed and its EBITDA fell short of Wall Street’s estimates. Overall, this was a softer quarter. The stock traded down 4.7% to $11.07 immediately following the results.
The latest quarter from Energy Recovery’s wasn’t that good. One earnings report doesn’t define a company’s quality, though, so let’s explore whether the stock is a buy at the current price. If you’re making that decision, you should consider the bigger picture of valuation, business qualities, as well as the latest earnings. We cover that in our actionable full research report which you can read here (it’s free).


