
Outpatient physical therapy provider U.S. Physical Therapy (NYSE: USPH) met Wall Street’s revenue expectations in Q1 CY2026, with sales up 7.9% year on year to $198.3 million. Its GAAP loss of $0.12 per share was significantly below analysts’ consensus estimates.
Is now the time to buy U.S. Physical Therapy? Find out by accessing our full research report, it’s free.
U.S. Physical Therapy (USPH) Q1 CY2026 Highlights:
- Revenue: $198.3 million vs analyst estimates of $198.2 million (7.9% year-on-year growth, in line)
- EPS (GAAP): -$0.12 vs analyst estimates of $0.49 (significant miss)
- Adjusted EBITDA: $20.24 million vs analyst estimates of $21.81 million (10.2% margin, 7.2% miss)
- EBITDA guidance for the full year is $104 million at the midpoint, in line with analyst expectations
- Operating Margin: 6.3%, down from 10.7% in the same quarter last year
- Free Cash Flow was -$1.57 million compared to -$7.25 million in the same quarter last year
- Sales Volumes were flat year on year (13.9% in the same quarter last year)
- Market Capitalization: $1.08 billion
Chris Reading, Chairman and Chief Executive Officer commented, “I want to begin by thanking our partners and clinical teams for their tremendous care and their continued efforts on behalf of our patients and across several important initiatives this year. These include a partial virtualization of our front desk; company-wide rollout of ambient-listening technology to improve documentation efficiency and allow for more patient-centric interaction; remote therapeutic monitoring for our traditional Medicare patients to facilitate greater home program adherence positively impacting care and outcomes; and targeted cash-based program expansion across our top partnerships impacting care and outcomes as well as overall margin. These initiatives, along with our very important hospital alliance focus, will bear fruit particularly in the second half of the year.”
Company Overview
With a nationwide footprint spanning 671 clinics across 42 states, U.S. Physical Therapy (NYSE: USPH) operates a network of outpatient physical therapy clinics and provides industrial injury prevention services to employers across the United States.
Revenue Growth
A company’s long-term sales performance can indicate its overall quality. Even a bad business can shine for one or two quarters, but a top-tier one grows for years. Thankfully, U.S. Physical Therapy’s 13.5% annualized revenue growth over the last five years was solid. Its growth beat the average healthcare company and shows its offerings resonate with customers.
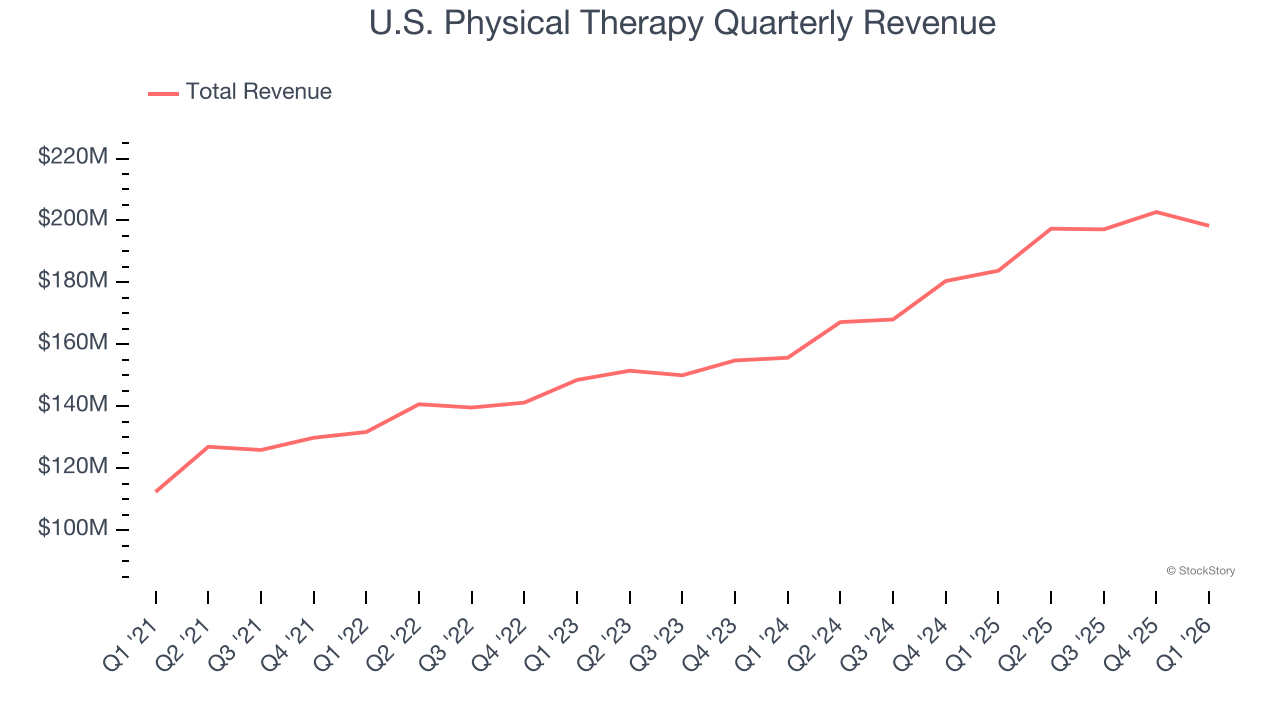
Long-term growth is the most important, but within healthcare, a half-decade historical view may miss new innovations or demand cycles. U.S. Physical Therapy’s annualized revenue growth of 14% over the last two years aligns with its five-year trend, suggesting its demand was predictably strong. 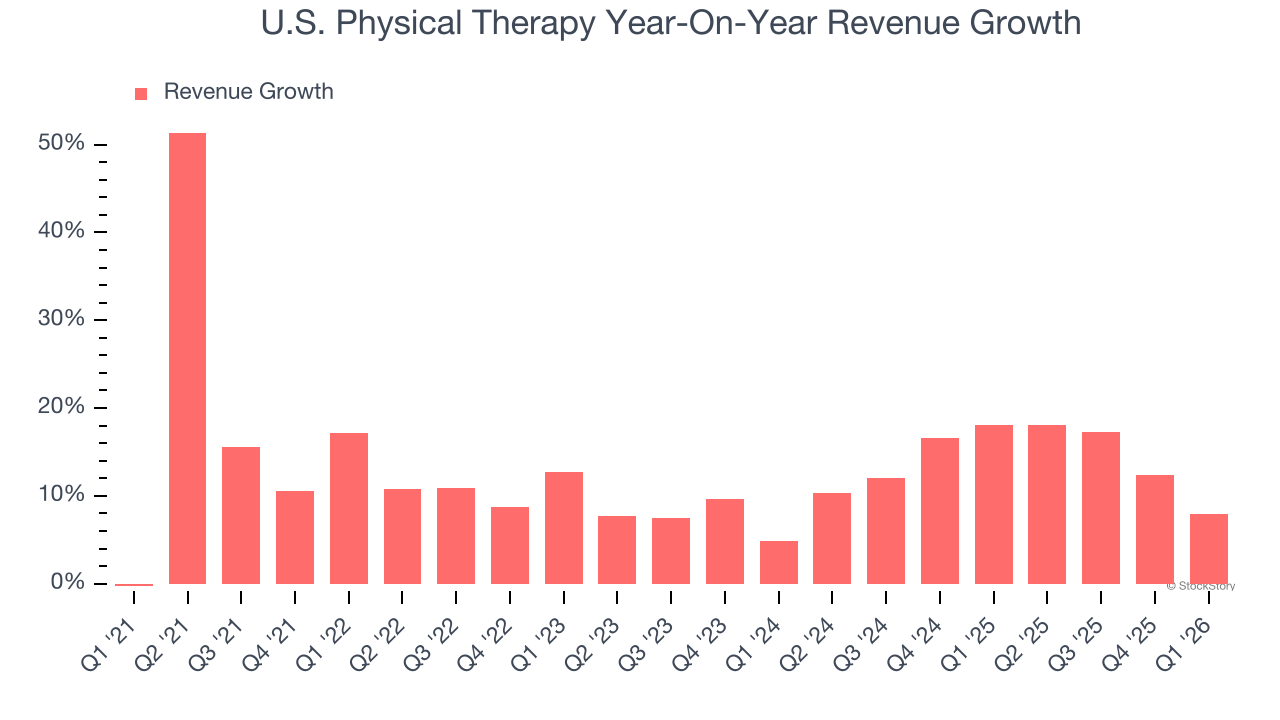
We can better understand the company’s revenue dynamics by analyzing its number of patient visits, which reached 1.44 million in the latest quarter. Over the last two years, U.S. Physical Therapy’s patient visits averaged 10% year-on-year growth. Because this number is lower than its revenue growth, we can see the company benefited from price increases. 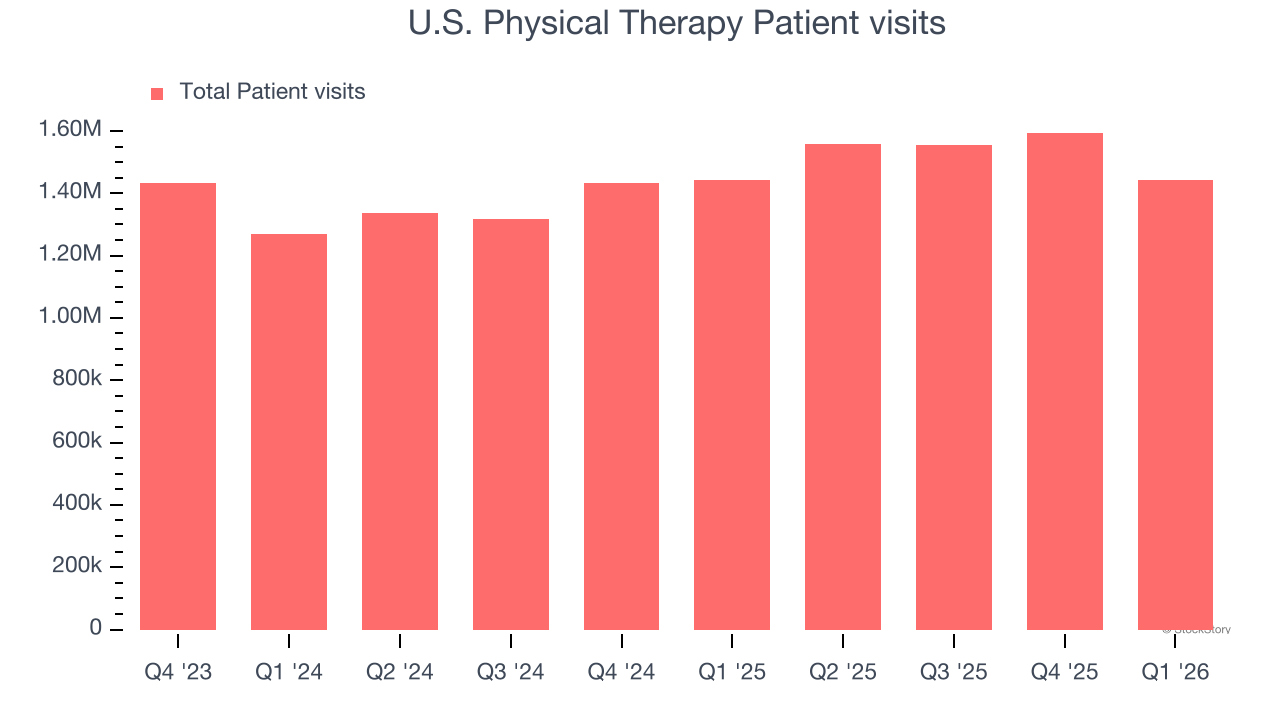
This quarter, U.S. Physical Therapy grew its revenue by 7.9% year on year, and its $198.3 million of revenue was in line with Wall Street’s estimates.
Looking ahead, sell-side analysts expect revenue to grow 6.3% over the next 12 months, a deceleration versus the last two years. Despite the slowdown, this projection is above average for the sector and indicates the market sees some success for its newer products and services.
ONE MORE THING: The $21 AI Application Stock Wall Street Forgot. While Wall Street obsesses over who’s building AI, one company is already using it to print money. And nobody’s paying attention.
AI chip stocks trade at ridiculous valuations. This company processes a trillion consumer signals monthly using AI and trades at a third of the price. The gap won’t last. The institutions will figure it out. You need to see this first. Read the FREE Report Before They Notice.
Adjusted Operating Margin
U.S. Physical Therapy has done a decent job managing its cost base over the last five years. The company has produced an average adjusted operating margin of 10.4%, higher than the broader healthcare sector.
Analyzing the trend in its profitability, U.S. Physical Therapy’s adjusted operating margin decreased by 3.7 percentage points over the last five years, but it rose by 1.8 percentage points on a two-year basis. Still, shareholders will want to see U.S. Physical Therapy become more profitable in the future.
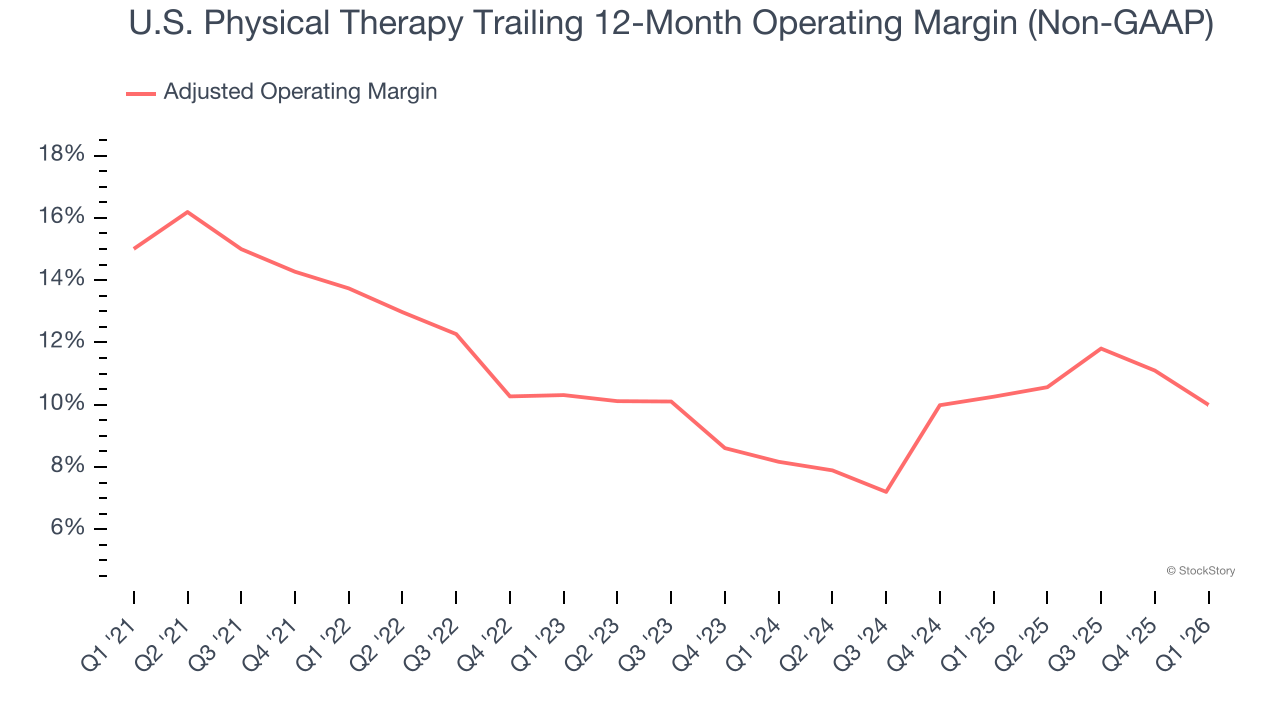
This quarter, U.S. Physical Therapy generated an adjusted operating margin profit margin of 6.3%, down 4.4 percentage points year on year. This contraction shows it was less efficient because its expenses grew faster than its revenue.
Earnings Per Share
Revenue trends explain a company’s historical growth, but the long-term change in earnings per share (EPS) points to the profitability of that growth – for example, a company could inflate its sales through excessive spending on advertising and promotions.
Sadly for U.S. Physical Therapy, its EPS declined by 11.1% annually over the last five years while its revenue grew by 13.5%. This tells us the company became less profitable on a per-share basis as it expanded.
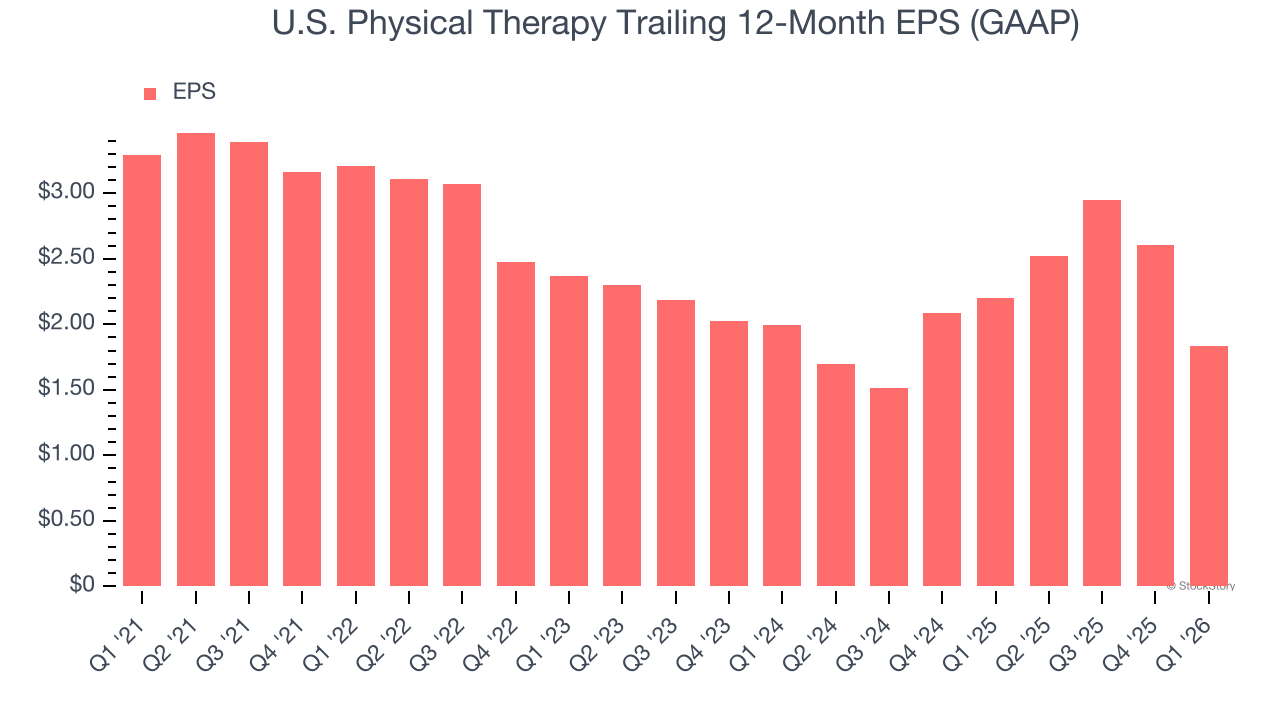
We can take a deeper look into U.S. Physical Therapy’s earnings to better understand the drivers of its performance. As we mentioned earlier, U.S. Physical Therapy’s adjusted operating margin declined by 3.7 percentage points over the last five years. Its share count also grew by 17.8%, meaning the company not only became less efficient with its operating expenses but also diluted its shareholders. 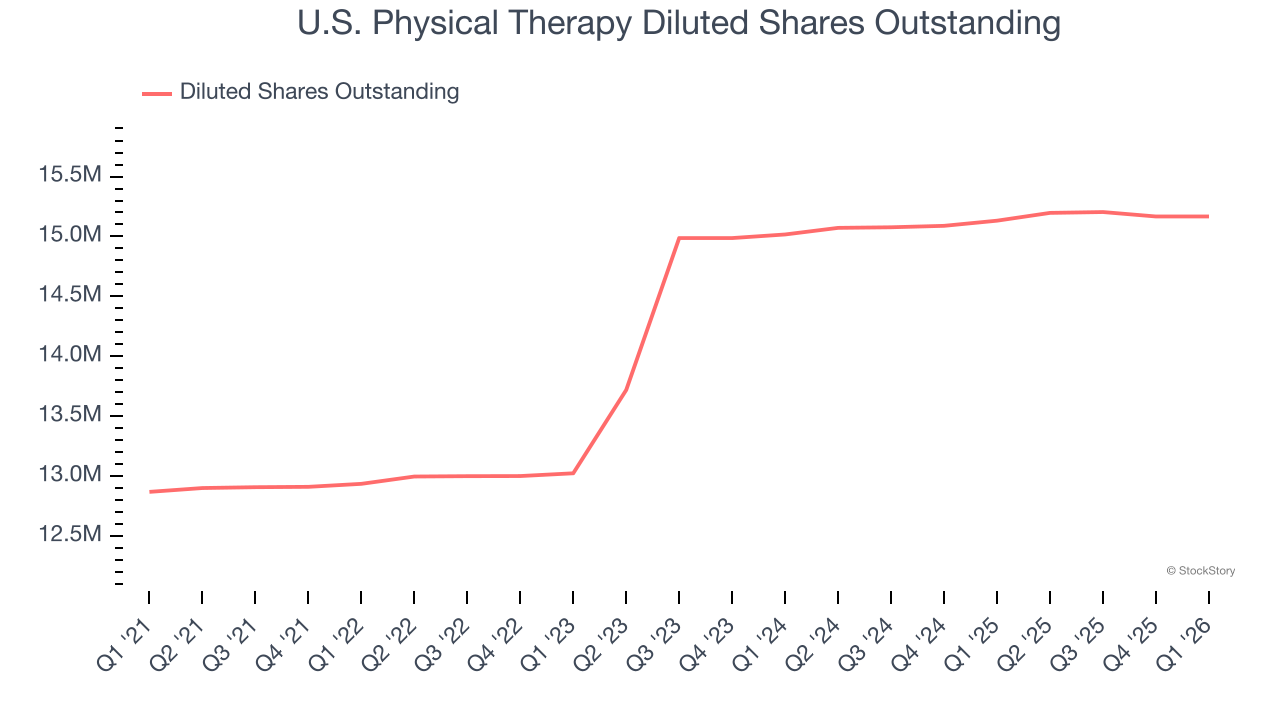
In Q1, U.S. Physical Therapy reported EPS of negative $0.12, down from $0.65 in the same quarter last year. This print missed analysts’ estimates. Over the next 12 months, Wall Street expects U.S. Physical Therapy’s full-year EPS of $1.83 to grow 69.1%.
Key Takeaways from U.S. Physical Therapy’s Q1 Results
We struggled to find many resounding positives in these results. Revenue was in line but EBITDA missed. Furthermore, EBITDA guidance was just in line. The stock remained flat at $73.18 immediately after reporting.
U.S. Physical Therapy may have had a tough quarter, but does that actually create an opportunity to invest right now? When making that decision, it’s important to consider its valuation, business qualities, as well as what has happened in the latest quarter. We cover that in our actionable full research report which you can read here (it’s free).


