
Real estate services firm Cushman & Wakefield (NYSE: CWK) reported Q1 CY2026 results topping the market’s revenue expectations, with sales up 11% year on year to $2.54 billion. Its non-GAAP profit of $0.15 per share was 12.6% above analysts’ consensus estimates.
Is now the time to buy Cushman & Wakefield? Find out by accessing our full research report, it’s free.
Cushman & Wakefield (CWK) Q1 CY2026 Highlights:
- Revenue: $2.54 billion vs analyst estimates of $2.42 billion (11% year-on-year growth, 4.7% beat)
- Adjusted EPS: $0.15 vs analyst estimates of $0.13 (12.6% beat)
- Adjusted EBITDA: $111.3 million vs analyst estimates of $111.4 million (4.4% margin, in line)
- Operating Margin: 2.3%, in line with the same quarter last year
- Free Cash Flow was -$255.7 million compared to -$179 million in the same quarter last year
- Market Capitalization: $3.39 billion
Company Overview
With expertise in the commercial real estate sector, Cushman & Wakefield (NYSE: CWK) is a global Chicago-based real estate firm offering a comprehensive range of services to clients.
Revenue Growth
Reviewing a company’s long-term sales performance reveals insights into its quality. Even a bad business can shine for one or two quarters, but a top-tier one grows for years. Over the last five years, Cushman & Wakefield grew its sales at a weak 6% compounded annual growth rate. This was below our standard for the consumer discretionary sector and is a poor baseline for our analysis.
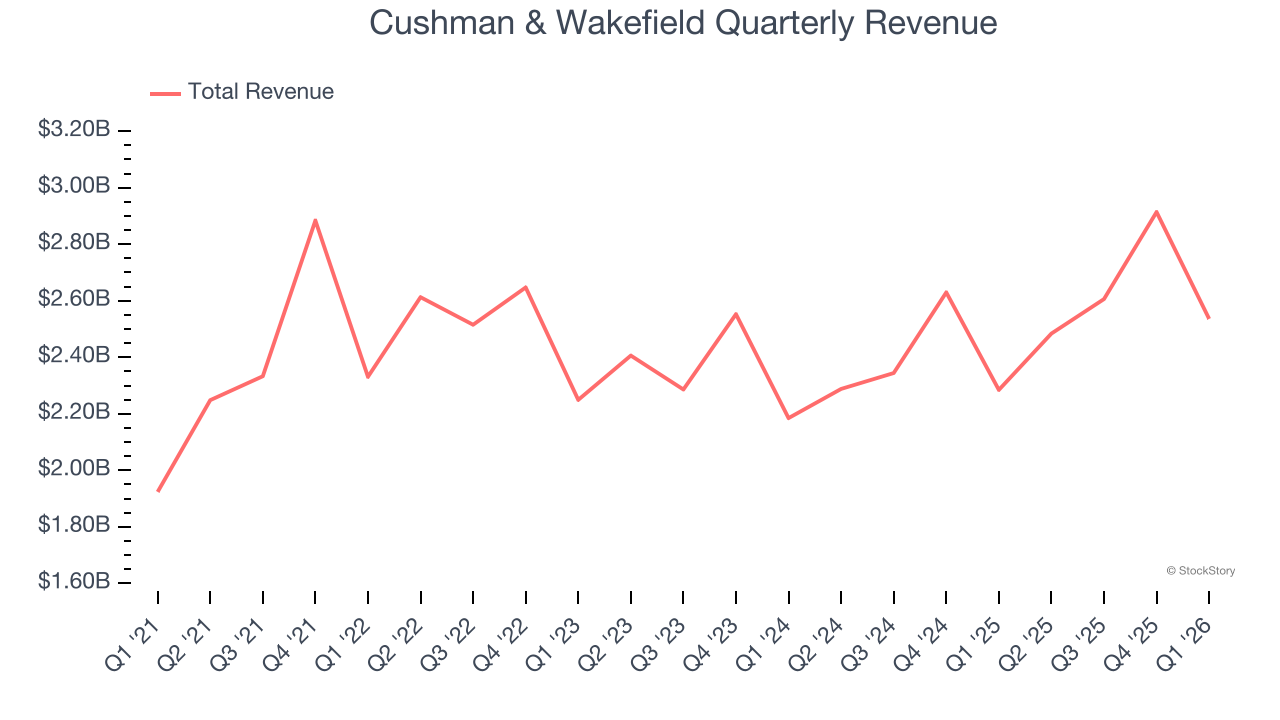
Long-term growth is the most important, but within consumer discretionary, product cycles are short and revenue can be hit-driven due to rapidly changing trends and consumer preferences. Cushman & Wakefield’s annualized revenue growth of 5.7% over the last two years aligns with its five-year trend, suggesting its demand was consistently weak. 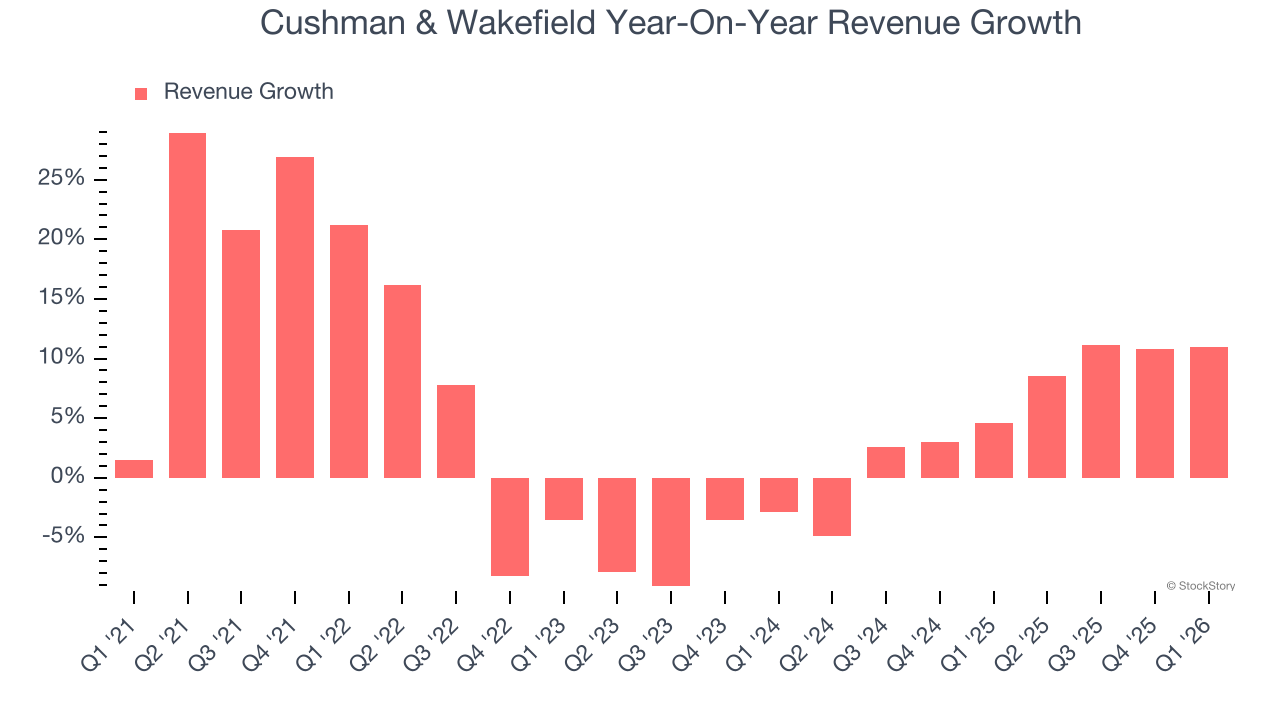
We can better understand the company’s revenue dynamics by analyzing its three most important segments: Management, Leasing, and Capital Markets, which are 68.7%, 19.6%, and 7.2% of revenue. Over the last two years, Cushman & Wakefield’s revenues in all three segments increased. Its Management revenue (property management) averaged year-on-year growth of 16.8% while its Leasing (sourcing tenants) and Capital Markets (financial advisory) revenues averaged 6.4% and 13%. 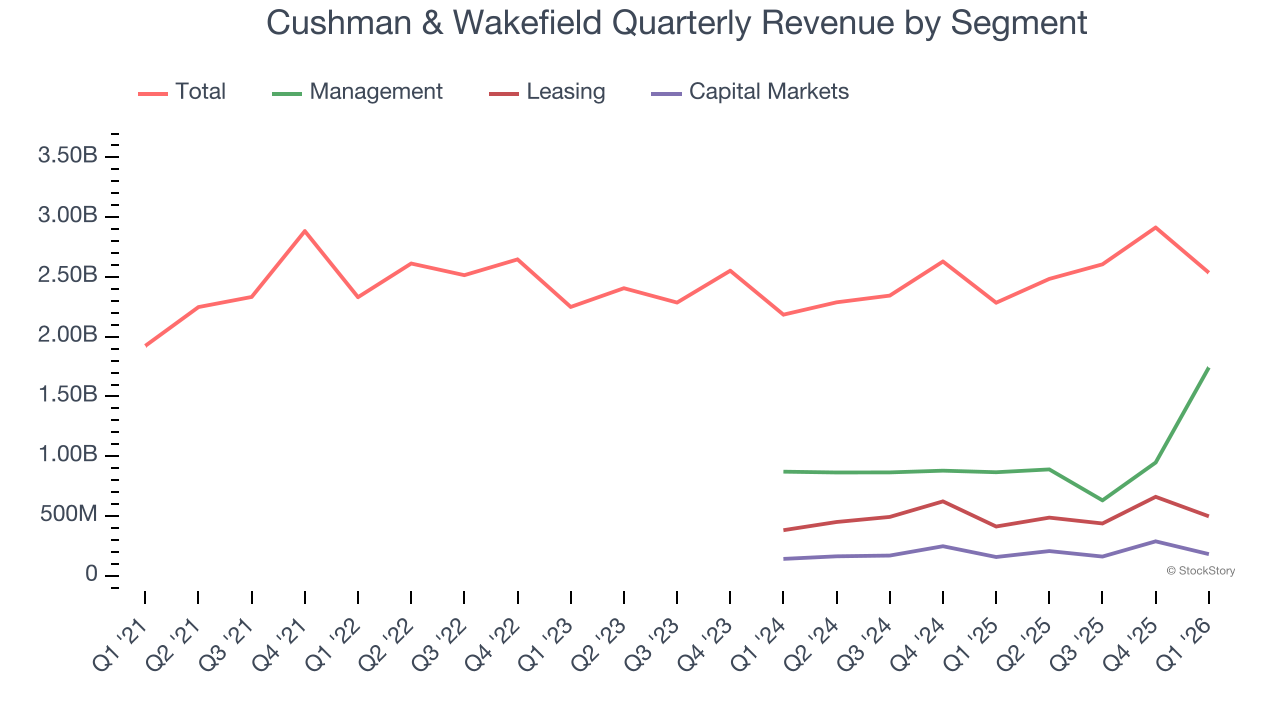
This quarter, Cushman & Wakefield reported year-on-year revenue growth of 11%, and its $2.54 billion of revenue exceeded Wall Street’s estimates by 4.7%.
Looking ahead, sell-side analysts expect revenue to grow 4.5% over the next 12 months, similar to its two-year rate. This projection is underwhelming and indicates its products and services will face some demand challenges.
ALSO WORTH WATCHING: Nvidia’s Quiet Partner. Nvidia’s chips cost a hundred grand. The connectors that make them work cost even more. One company makes them all.
Every AI server needs specialized infrastructure the chip companies don’t make. High-speed cables. Power connectors. Thermal sensors. This 90-year-old company built a monopoly on it. The AI boom just started. This stock is still flying under the radar. Claim The Stock Ticker Here for FREE.
Operating Margin
Operating margin is an important measure of profitability as it shows the portion of revenue left after accounting for all core expenses – everything from the cost of goods sold to advertising and wages. It’s also useful for comparing profitability across companies with different levels of debt and tax rates because it excludes interest and taxes.
Cushman & Wakefield’s operating margin has more or less stayed the same over the last 12 months , and we generally like to see margin increases due to economies of scale and cost efficiency over time.
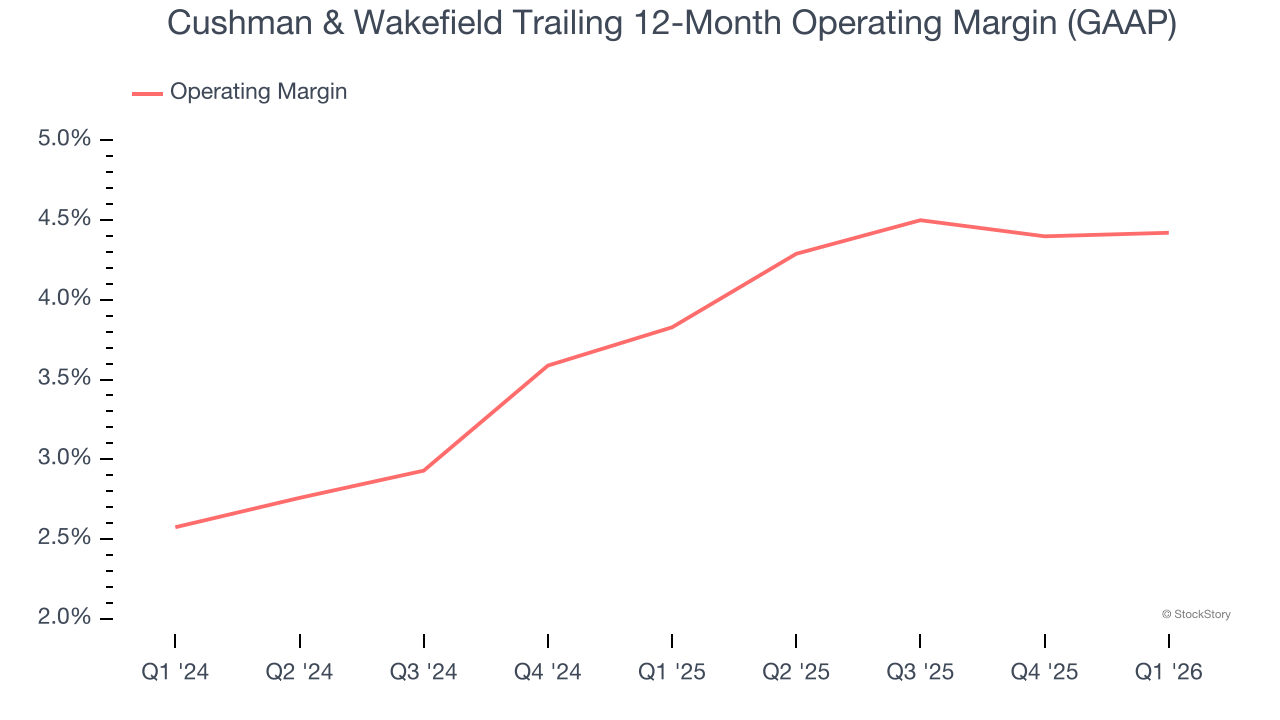
In Q1, Cushman & Wakefield generated an operating margin profit margin of 2.3%, in line with the same quarter last year. This indicates the company’s overall cost structure has been relatively stable.
Earnings Per Share
Revenue trends explain a company’s historical growth, but the long-term change in earnings per share (EPS) points to the profitability of that growth – for example, a company could inflate its sales through excessive spending on advertising and promotions.
Cushman & Wakefield’s weak 7.5% annual EPS growth over the last five years aligns with its revenue performance. On the bright side, this tells us its incremental sales were profitable.
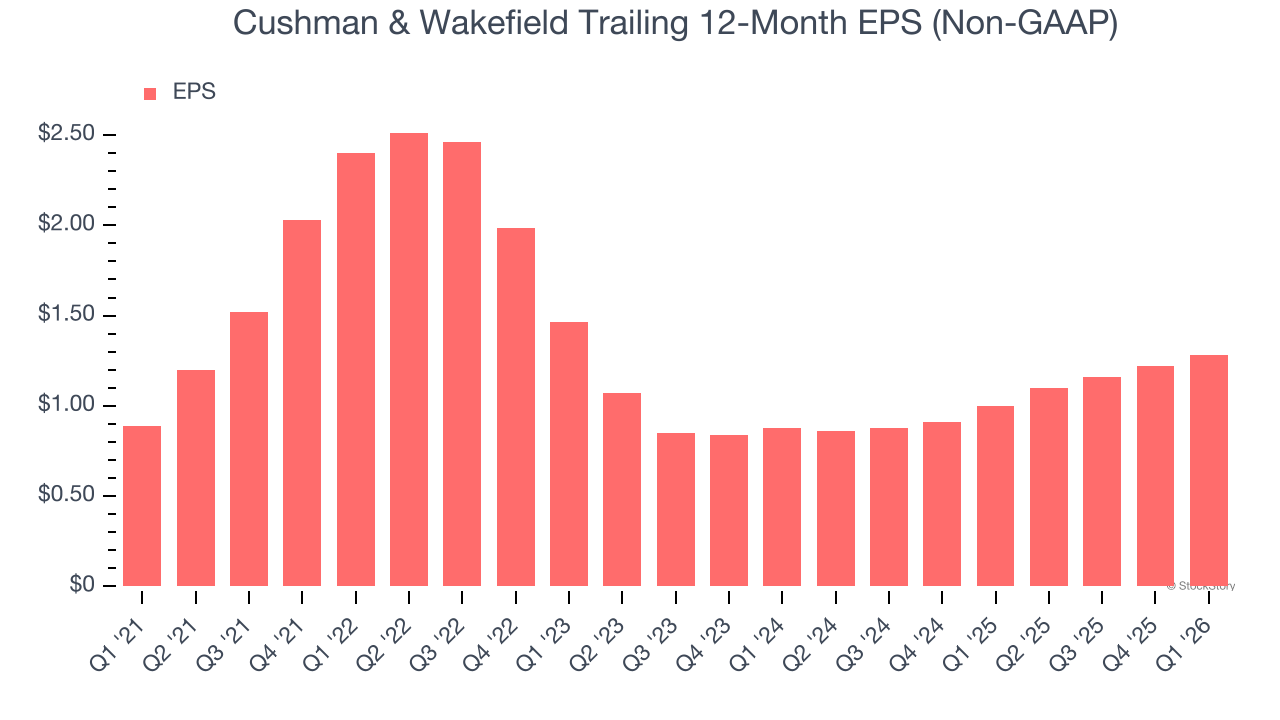
In Q1, Cushman & Wakefield reported adjusted EPS of $0.15, up from $0.09 in the same quarter last year. This print easily cleared analysts’ estimates, and shareholders should be content with the results. Over the next 12 months, Wall Street expects Cushman & Wakefield’s full-year EPS of $1.28 to grow 16.4%.
Key Takeaways from Cushman & Wakefield’s Q1 Results
We enjoyed seeing Cushman & Wakefield beat analysts’ revenue expectations this quarter. We were also glad its EPS outperformed Wall Street’s estimates. On the other hand, its adjusted operating income missed. Zooming out, we think this was a mixed quarter. The stock remained flat at $14.46 immediately following the results.
So do we think Cushman & Wakefield is an attractive buy at the current price? When making that decision, it’s important to consider its valuation, business qualities, as well as what has happened in the latest quarter. We cover that in our actionable full research report which you can read here (it’s free).


