
Energy and industrial distributor DNOW (NYSE: DNOW) reported Q1 CY2026 results topping the market’s revenue expectations, with sales up 97.5% year on year to $1.18 billion. Its non-GAAP profit of $0.01 per share was 83.3% below analysts’ consensus estimates.
Is now the time to buy DNOW? Find out by accessing our full research report, it’s free.
DNOW (DNOW) Q1 CY2026 Highlights:
- Revenue: $1.18 billion vs analyst estimates of $1.05 billion (97.5% year-on-year growth, 12.7% beat)
- Adjusted EPS: $0.01 vs analyst expectations of $0.06 (83.3% miss)
- Adjusted EBITDA: $39 million vs analyst estimates of $49.45 million (3.3% margin, 21.1% miss)
- Operating Margin: -4.2%, down from 5% in the same quarter last year
- Market Capitalization: $2.52 billion
Company Overview
Spun off from National Oilwell Varco, DNOW (NYSE: DNOW) provides distribution and supply chain solutions for the energy and industrial end markets.
Revenue Growth
Examining a company’s long-term performance can provide clues about its quality. Any business can experience short-term success, but top-performing ones enjoy sustained growth for years. Thankfully, DNOW’s 19.9% annualized revenue growth over the last five years was incredible. Its growth beat the average industrials company and shows its offerings resonate with customers.
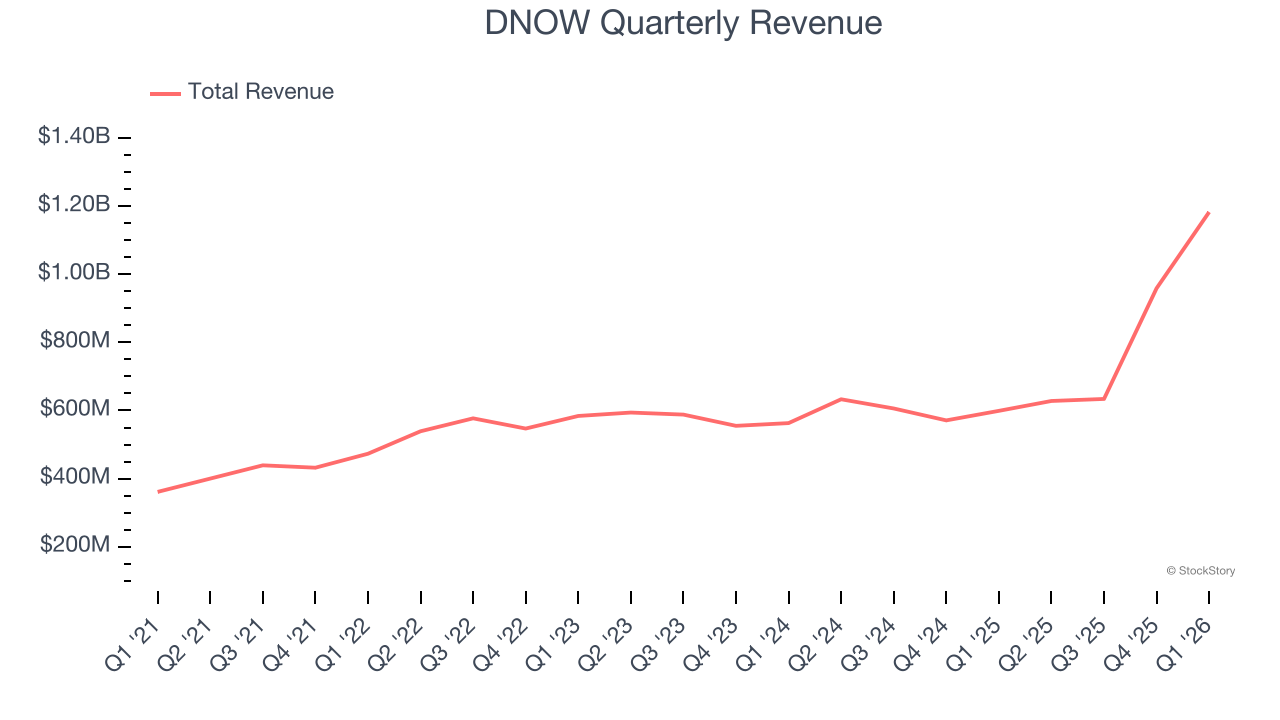
Long-term growth is the most important, but within industrials, a half-decade historical view may miss new industry trends or demand cycles. DNOW’s annualized revenue growth of 21.7% over the last two years is above its five-year trend, suggesting its demand was strong and recently accelerated. 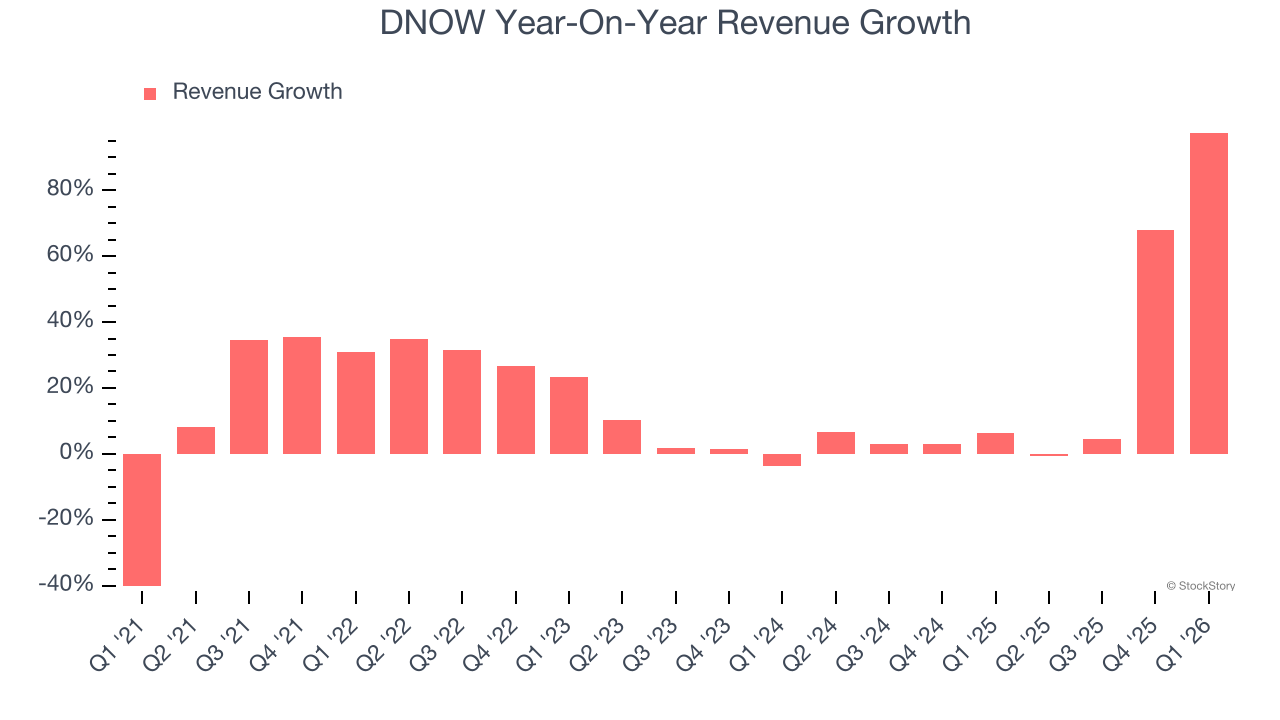
This quarter, DNOW reported magnificent year-on-year revenue growth of 97.5%, and its $1.18 billion of revenue beat Wall Street’s estimates by 12.7%.
Looking ahead, sell-side analysts expect revenue to grow 36.7% over the next 12 months, an improvement versus the last two years. This projection is eye-popping and suggests its newer products and services will spur better top-line performance.
WHILE YOU’RE HERE: The Next Palantir? One satellite company captures images of every point on Earth. Every single day. The Pentagon wants it. Hedge funds are using it to beat earnings. You’ve probably never heard of it.
This is what the early days of Palantir looked like before it became a $437 billion giant. Same playbook. Different technology. If you missed Palantir, you need to see this. Claim The Stock Ticker for Free HERE.
Operating Margin
Operating margin is a key measure of profitability. Think of it as net income - the bottom line - excluding the impact of taxes and interest on debt, which are less connected to business fundamentals.
DNOW was profitable over the last five years but held back by its large cost base. Its average operating margin of 2.3% was weak for an industrials business. This result isn’t too surprising given its low gross margin as a starting point.
Analyzing the trend in its profitability, DNOW’s operating margin decreased by 6.9 percentage points over the last five years. This raises questions about the company’s expense base because its revenue growth should have given it leverage on its fixed costs, resulting in better economies of scale and profitability. DNOW’s performance was poor no matter how you look at it - it shows that costs were rising and it couldn’t pass them onto its customers.
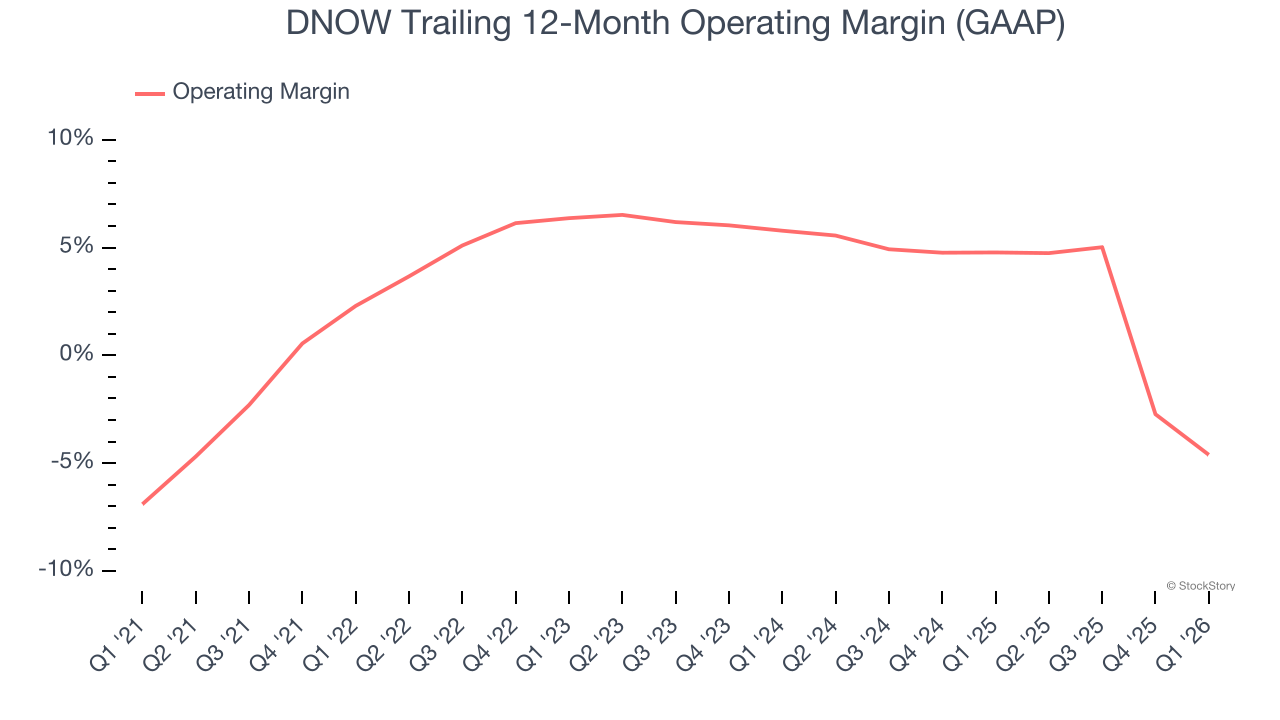
This quarter, DNOW generated an operating margin profit margin of negative 4.2%, down 9.2 percentage points year on year. Since DNOW’s operating margin decreased more than its gross margin, we can assume it was less efficient because expenses such as marketing, R&D, and administrative overhead increased.
Earnings Per Share
Revenue trends explain a company’s historical growth, but the long-term change in earnings per share (EPS) points to the profitability of that growth – for example, a company could inflate its sales through excessive spending on advertising and promotions.
DNOW’s full-year EPS flipped from negative to positive over the last five years. This is encouraging and shows it’s at a critical moment in its life.
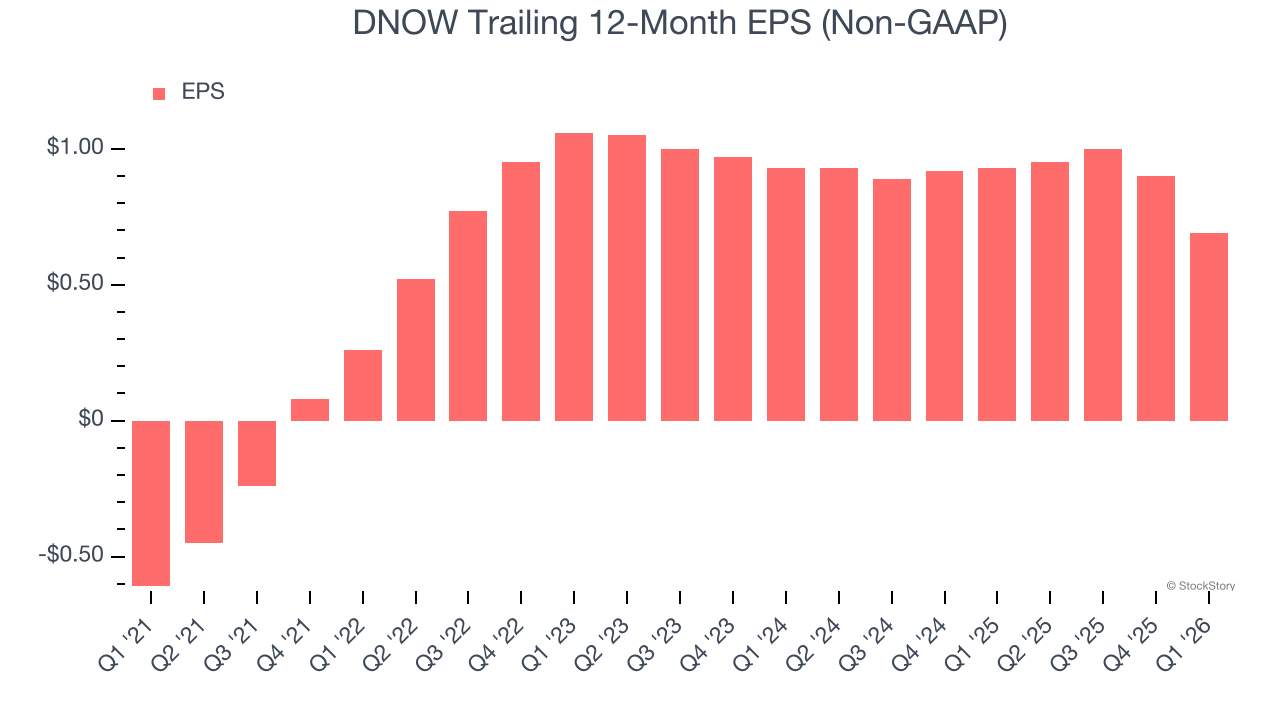
Like with revenue, we analyze EPS over a more recent period because it can provide insight into an emerging theme or development for the business.
Sadly for DNOW, its EPS declined by 13.9% annually over the last two years while its revenue grew by 21.7%. This tells us the company became less profitable on a per-share basis as it expanded.
We can take a deeper look into DNOW’s earnings to better understand the drivers of its performance. DNOW’s operating margin has declined over the last two yearswhile its share count has grown 73.3%. This means the company not only became less efficient with its operating expenses but also diluted its shareholders. 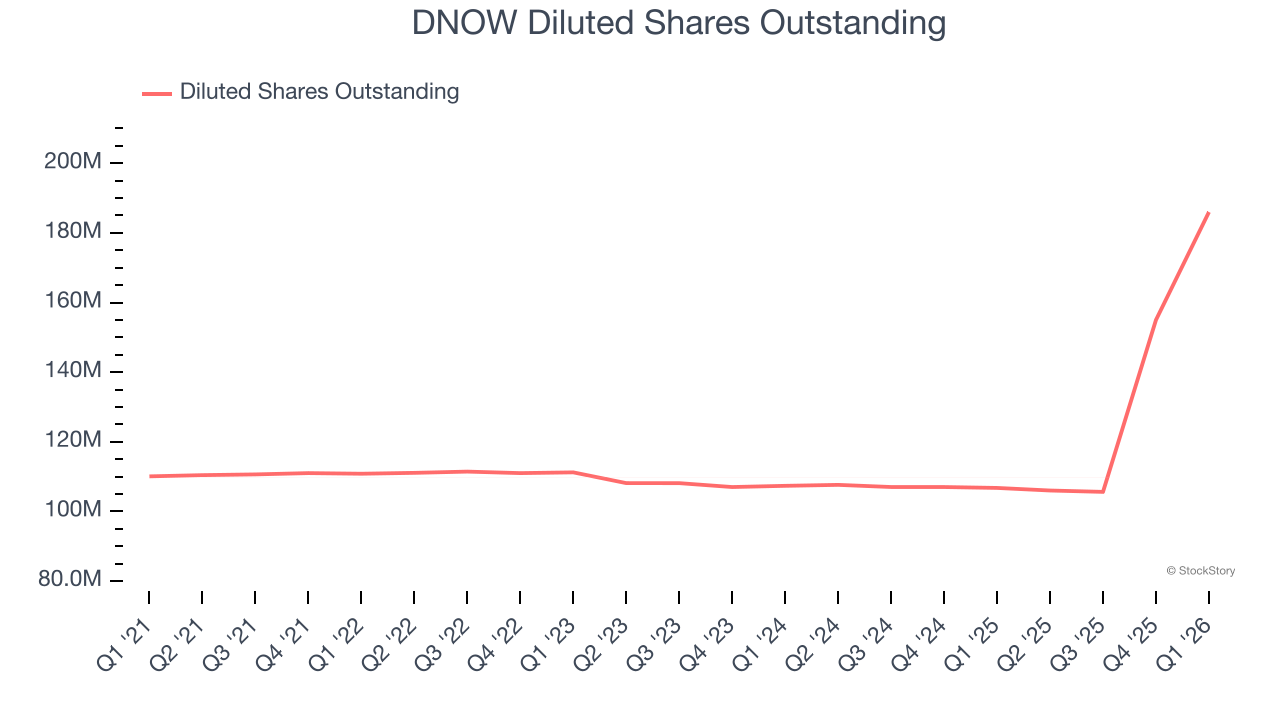
In Q1, DNOW reported adjusted EPS of $0.01, down from $0.22 in the same quarter last year. This print missed analysts’ estimates, but we care more about long-term adjusted EPS growth than short-term movements. We also like to analyze expected EPS growth based on Wall Street analysts’ consensus projections, but there is insufficient data.
Key Takeaways from DNOW’s Q1 Results
We were impressed by how significantly DNOW blew past analysts’ revenue expectations this quarter. On the other hand, its adjusted operating income missed and its EBITDA fell short of Wall Street’s estimates. Overall, this was a weaker quarter. The stock traded down 3.9% to $12.97 immediately following the results.
DNOW may have had a tough quarter, but does that actually create an opportunity to invest right now? The latest quarter does matter, but not nearly as much as longer-term fundamentals and valuation, when deciding if the stock is a buy. We cover that in our actionable full research report which you can read here (it’s free).


