Multi-industry consumer and professional products manufacturer Griffon Corporation (NYSE: GFF) reported Q1 CY2026 results beating Wall Street’s revenue expectations, but sales fell by 31% year on year to $421.9 million. On the other hand, the company’s full-year revenue guidance of $1.8 billion at the midpoint came in 9.8% below analysts’ estimates. Its non-GAAP profit of $1.05 per share was 6.3% above analysts’ consensus estimates.
Is now the time to buy Griffon? Find out by accessing our full research report, it’s free.
Griffon (GFF) Q1 CY2026 Highlights:
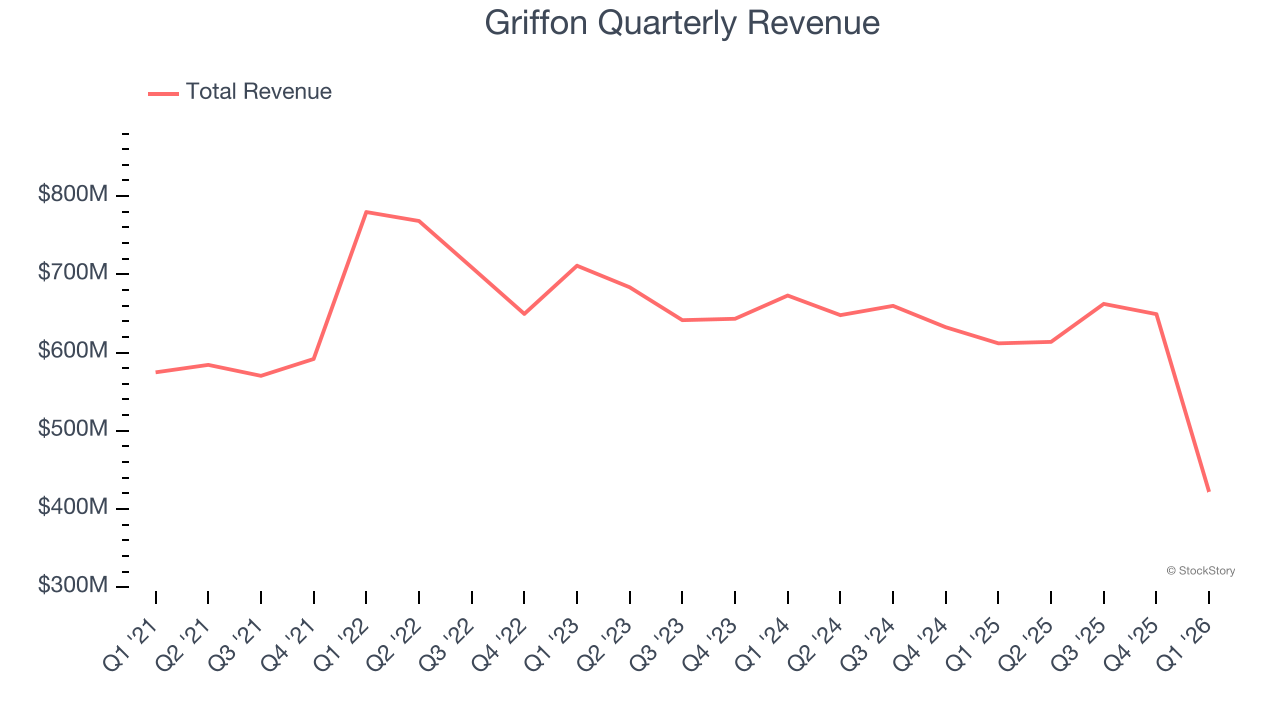
- Revenue: $421.9 million vs analyst estimates of $414.6 million (31% year-on-year decline, 1.8% beat)
- Adjusted EPS: $1.05 vs analyst estimates of $0.99 (6.3% beat)
- Adjusted EBITDA: $97.78 million vs analyst estimates of $96.48 million (23.2% margin, 1.3% beat)
- The company reconfirmed its revenue guidance for the full year of $1.8 billion at the midpoint
- EBITDA guidance for the full year is $458 million at the midpoint, below analyst estimates of $466.5 million
- Operating Margin: 20.7%, up from 16.6% in the same quarter last year
- Free Cash Flow Margin: 0.3%, similar to the same quarter last year
- Market Capitalization: $4.31 billion
Company Overview
Initially in the defense industry, Griffon (NYSE: GFF) is a now diversified company specializing in home improvement, professional equipment, and building products.
Revenue Growth
A company’s long-term performance is an indicator of its overall quality. Any business can put up a good quarter or two, but many enduring ones grow for years. Unfortunately, Griffon struggled to consistently increase demand as its $2.35 billion of sales for the trailing 12 months was close to its revenue five years ago. This was below our standards and is a rough starting point for our analysis.
Long-term growth is the most important, but within industrials, a half-decade historical view may miss new industry trends or demand cycles. Griffon’s recent performance shows its demand remained suppressed as its revenue has declined by 5.7% annually over the last two years. 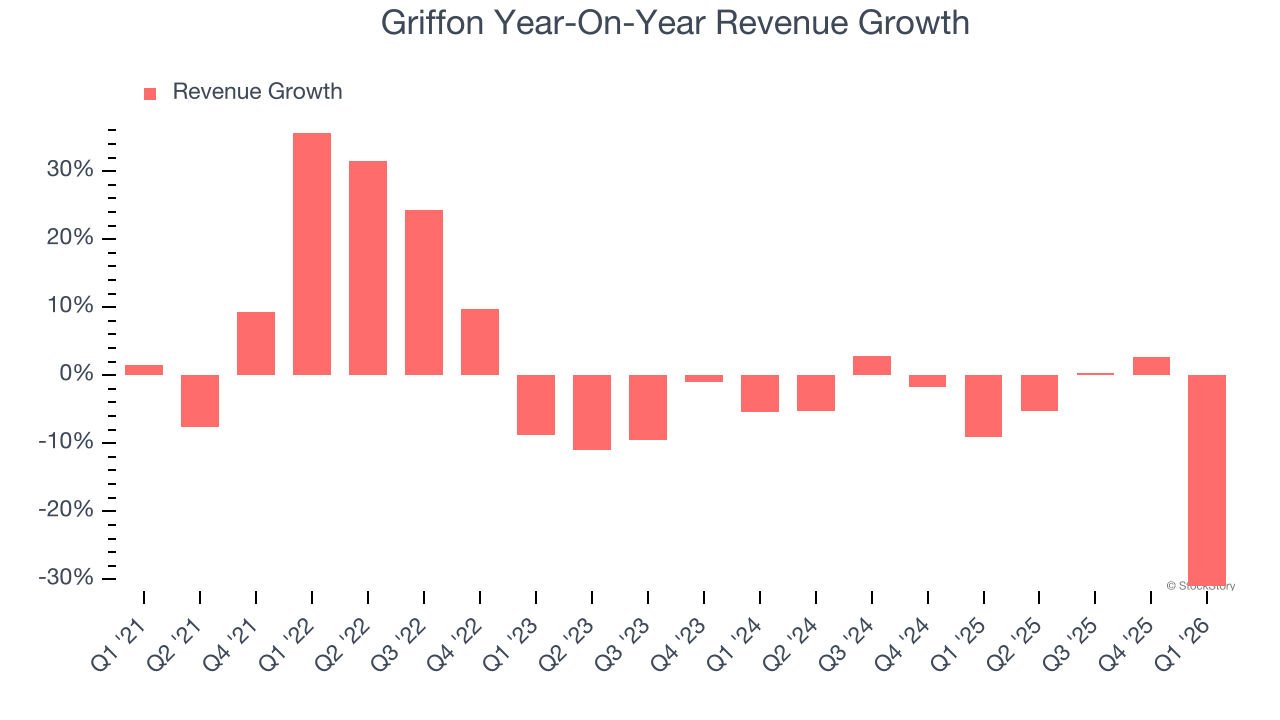
This quarter, Griffon’s revenue fell by 31% year on year to $421.9 million but beat Wall Street’s estimates by 1.8%.
Looking ahead, sell-side analysts expect revenue to decline by 22.5% over the next 12 months, a deceleration versus the last two years. This projection is underwhelming and indicates its products and services will face some demand challenges.
ONE MORE THING: 3 Hidden Platforms Growing 3X Faster than Amazon, Google, and PayPal. Amazon, Google, and Meta all followed the same playbook: Dominate an ignored market. Build an unbeatable moat. Scale until you’re unstoppable.
These three platforms are running that exact playbook right now. The early investors in Amazon made fortunes. The early investors in these could do the same. Get All 3 Stocks Here for FREE.
Operating Margin
Operating margin is an important measure of profitability as it shows the portion of revenue left after accounting for all core expenses – everything from the cost of goods sold to advertising and wages. It’s also useful for comparing profitability across companies with different levels of debt and tax rates because it excludes interest and taxes.
Griffon has been an efficient company over the last five years. It was one of the more profitable businesses in the industrials sector, boasting an average operating margin of 15.3%. This result isn’t surprising as its high gross margin gives it a favorable starting point.
Looking at the trend in its profitability, Griffon’s operating margin rose by 9.4 percentage points over the last five years, showing its efficiency has meaningfully improved.
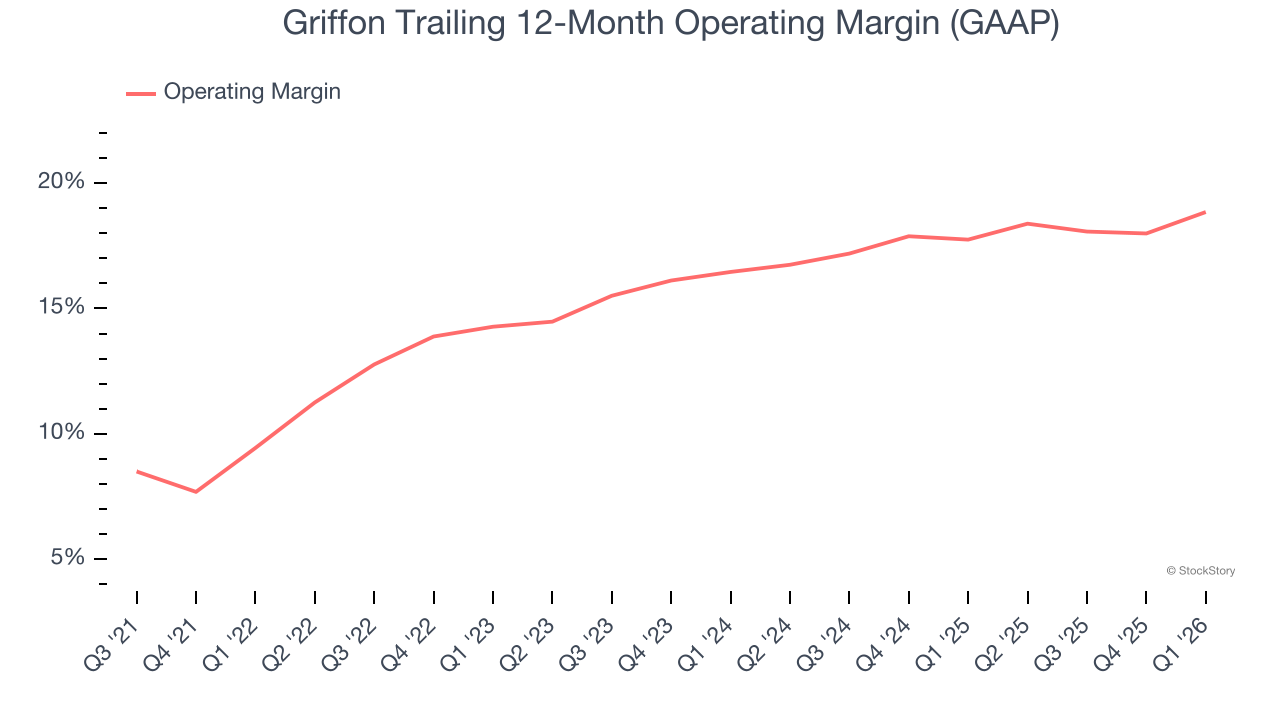
In Q1, Griffon generated an operating margin profit margin of 20.7%, up 4.1 percentage points year on year. Since its gross margin expanded more than its operating margin, we can infer that leverage on its cost of sales was the primary driver behind the recently higher efficiency.
Earnings Per Share
Revenue trends explain a company’s historical growth, but the long-term change in earnings per share (EPS) points to the profitability of that growth – for example, a company could inflate its sales through excessive spending on advertising and promotions.
Griffon’s EPS grew at 21.8% compounded annual growth rate over the last five years, higher than its flat revenue. This tells us management responded to softer demand by adapting its cost structure.
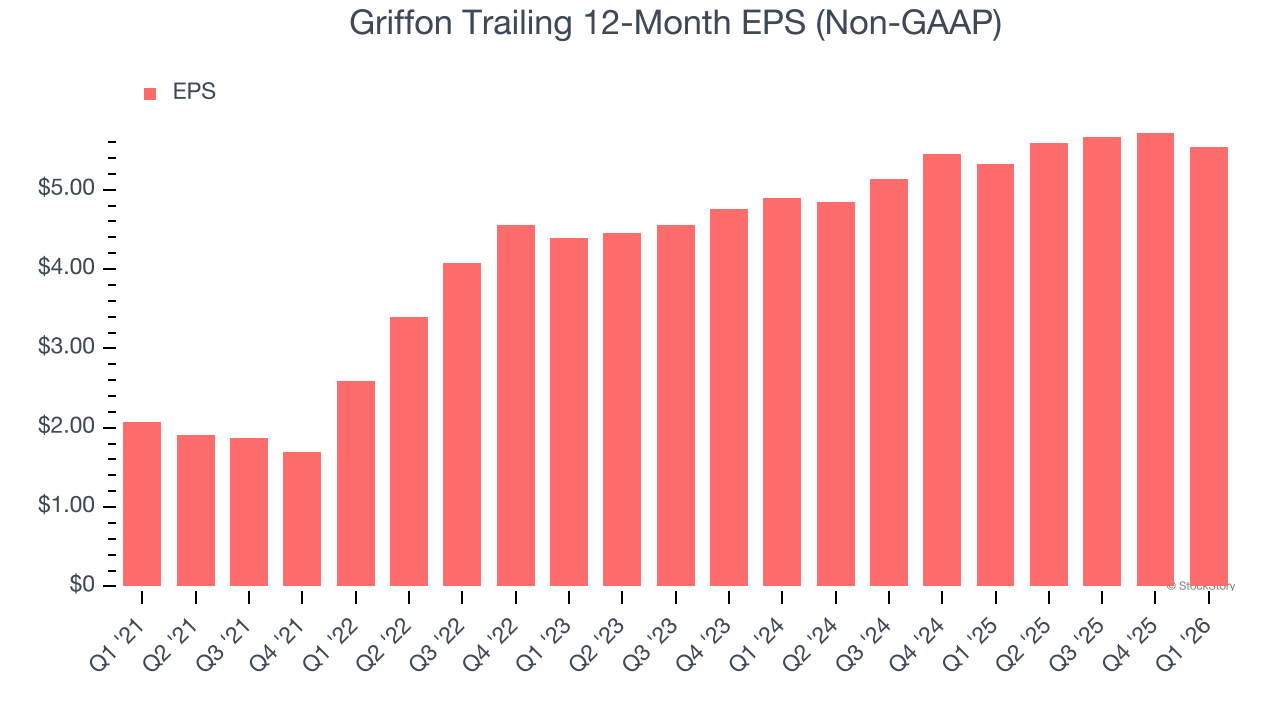
We can take a deeper look into Griffon’s earnings quality to better understand the drivers of its performance. As we mentioned earlier, Griffon’s operating margin expanded by 9.4 percentage points over the last five years. On top of that, its share count shrank by 14.2%. These are positive signs for shareholders because improving profitability and share buybacks turbocharge EPS growth relative to revenue growth. 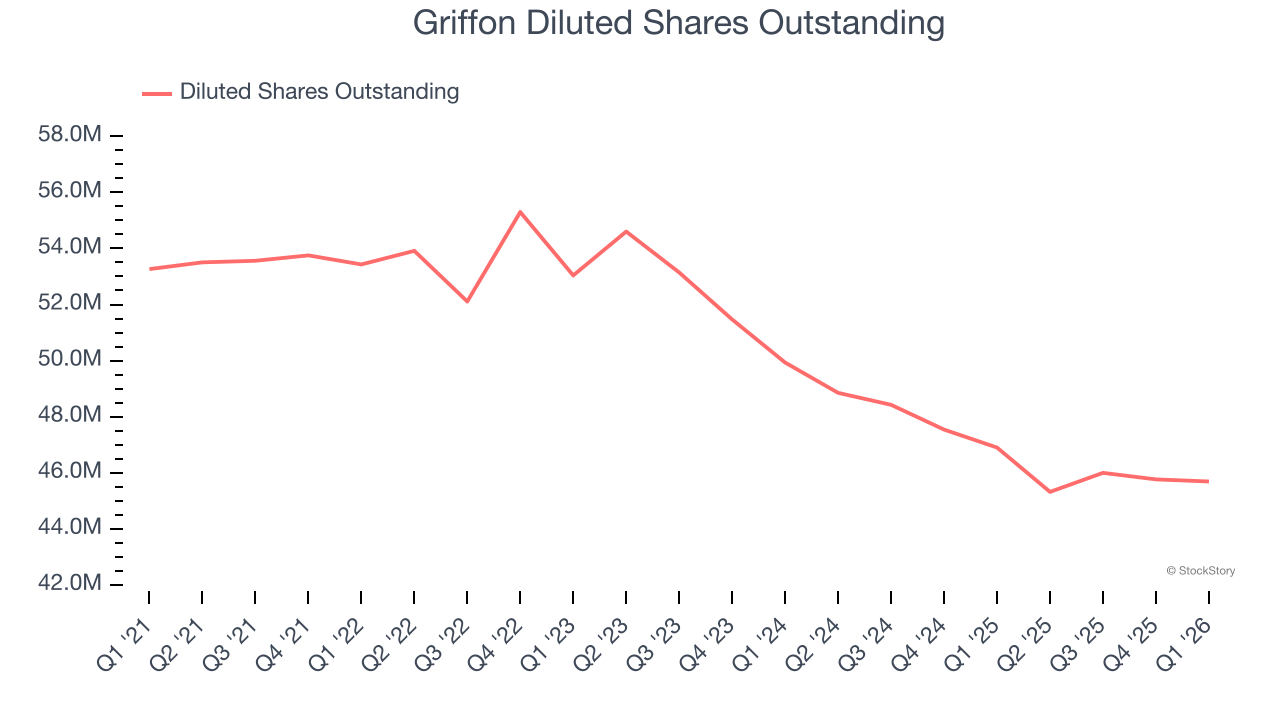
Like with revenue, we analyze EPS over a more recent period because it can provide insight into an emerging theme or development for the business.
For Griffon, its two-year annual EPS growth of 6.3% was lower than its five-year trend. We hope its growth can accelerate in the future.
In Q1, Griffon reported adjusted EPS of $1.05, down from $1.23 in the same quarter last year. Despite falling year on year, this print beat analysts’ estimates by 6.3%. Over the next 12 months, Wall Street expects Griffon’s full-year EPS of $5.54 to shrink by 2.3%.
Key Takeaways from Griffon’s Q1 Results
We enjoyed seeing Griffon beat analysts’ revenue expectations this quarter. We were also glad its EPS outperformed Wall Street’s estimates. On the other hand, its full-year revenue guidance missed and its full-year EBITDA guidance fell short of Wall Street’s estimates. Overall, this was a weaker quarter. The stock traded down 2.7% to $90.07 immediately following the results.
Griffon underperformed this quarter, but does that create an opportunity to invest right now? If you’re making that decision, you should consider the bigger picture of valuation, business qualities, as well as the latest earnings. We cover that in our actionable full research report which you can read here (it’s free).