Tax preparation company H&R Block (NYSE: HRB) reported revenue ahead of Wall Street’s expectations in Q2 CY2026, with sales up 3% year on year to $1.14 billion. The company’s full-year revenue guidance of $4.14 billion at the midpoint came in 2% above analysts’ estimates. Its non-GAAP profit of $2.38 per share was 7.7% above analysts’ consensus estimates.
Is now the time to buy H&R Block? Find out by accessing our full research report, it’s free.
H&R Block (HRB) Q2 CY2026 Highlights:
- Revenue: $1.14 billion vs analyst estimates of $1.12 billion (3% year-on-year growth, 2.5% beat)
- Adjusted EPS: $2.38 vs analyst estimates of $2.21 (7.7% beat)
- Adjusted EBITDA: $420.5 million vs analyst estimates of $394.6 million (36.7% margin, 6.6% beat)
- Adjusted EPS guidance for the upcoming financial year 2027 is $6.14 at the midpoint, beating analyst estimates by 4.8%
- EBITDA guidance for the upcoming financial year 2027 is $1.13 billion at the midpoint, above analyst estimates of $1.07 billion
- Free Cash Flow Margin: 20.7%, down from 21.7% in the same quarter last year
- Market Capitalization: $5.82 billion
"Fiscal 2026 provided meaningful evidence that the strategic choices we are making are strengthening H&R Block," said Curtis Campbell, president and chief executive officer.
Company Overview
Founded in 1955 by brothers Henry W. Bloch and Richard A. Bloch, H&R Block (NYSE: HRB) is a tax preparation company offering professional tax assistance and financial solutions to individuals and small businesses.
Revenue Growth
A company’s long-term sales performance is one signal of its overall quality. Even a bad business can shine for one or two quarters, but a top-tier one grows for years. Over the last five years, H&R Block grew its sales at a weak 1.9% compounded annual growth rate. This was below our standards and is a tough starting point for our analysis. We note H&R Block is a seasonal business because it generates most of its revenue during tax season, so the charts in our report will look a bit lumpy.
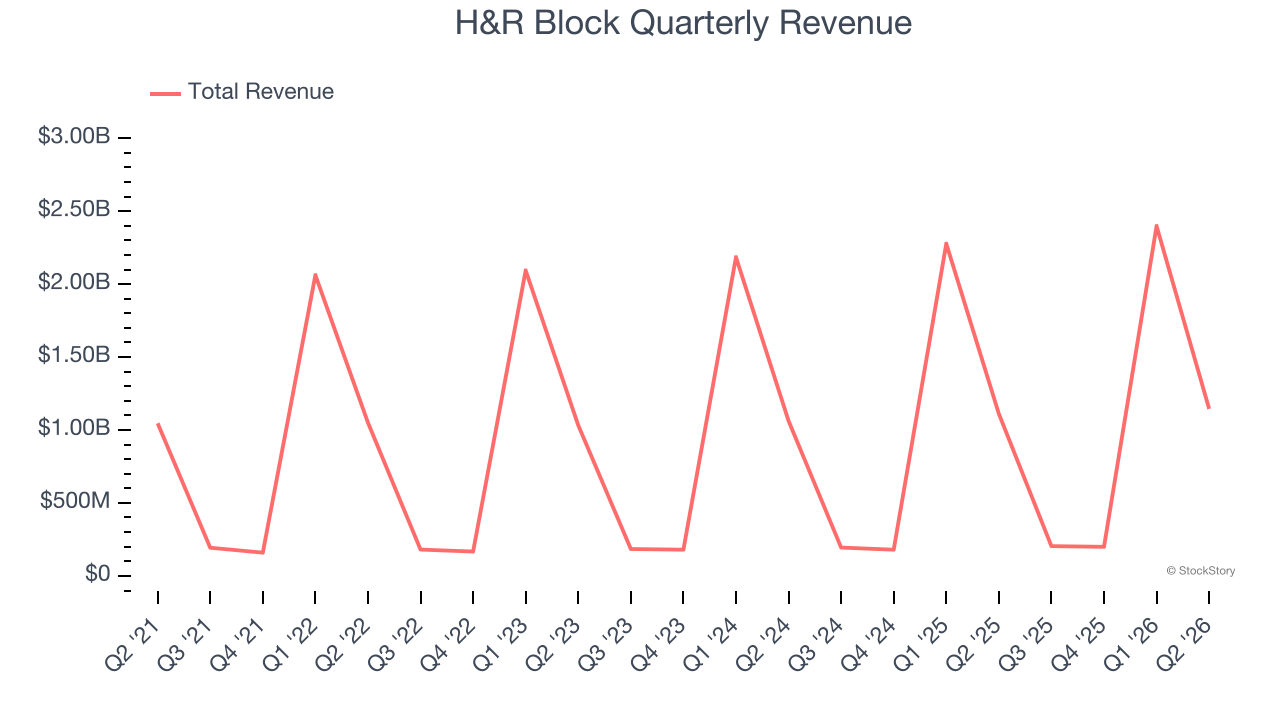
Long-term growth is the most important, but within consumer discretionary, product cycles are short and revenue can be hit-driven due to rapidly changing trends and consumer preferences. H&R Block’s annualized revenue growth of 4.5% over the last two years is above its five-year trend, which is encouraging. 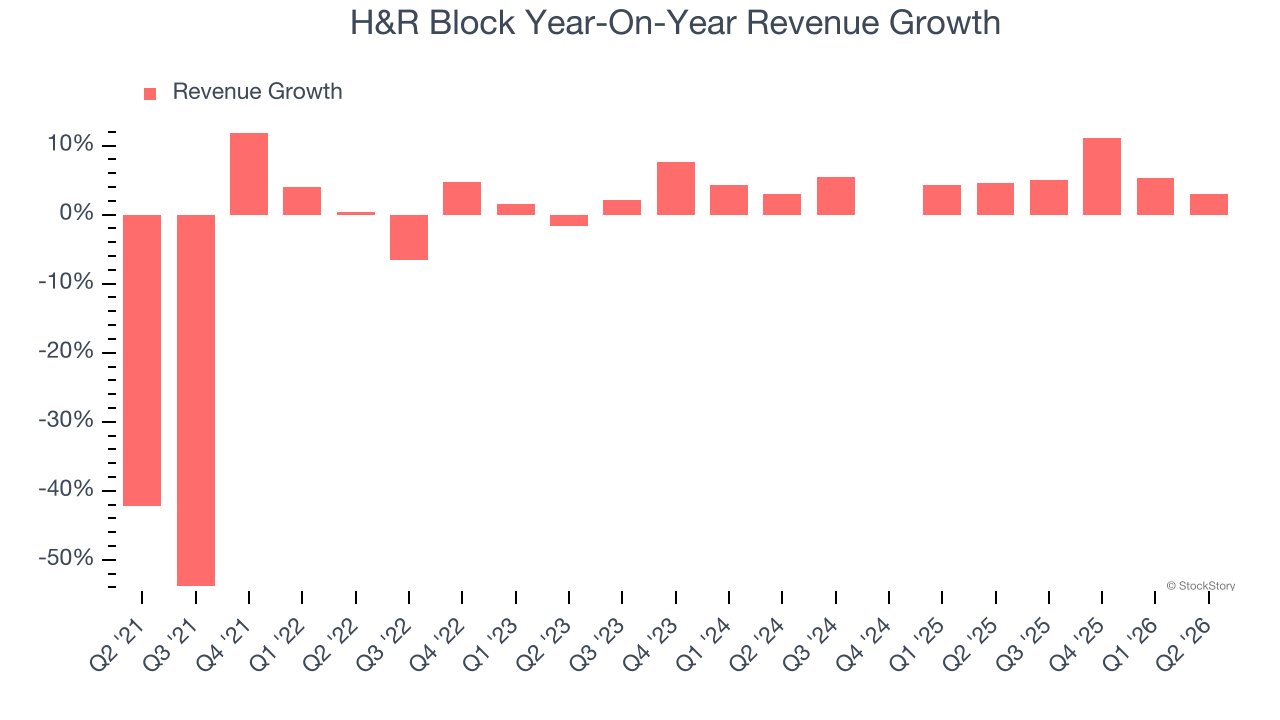
We can better understand the company’s revenue dynamics by analyzing its three most important segments: Tax Preparation, Financial Services, and Wave Financial, which are 87.6%, 8.3%, and 2.9% of revenue. Over the last two years, H&R Block’s revenues in all three segments increased. Its Tax Preparation revenue (DIY, assisted, add-on services) averaged year-on-year growth of 6.1% while its Financial Services (Emerald Card, Spruce, interest income) and Wave Financial (business software) revenues averaged 170% and 12.5%. 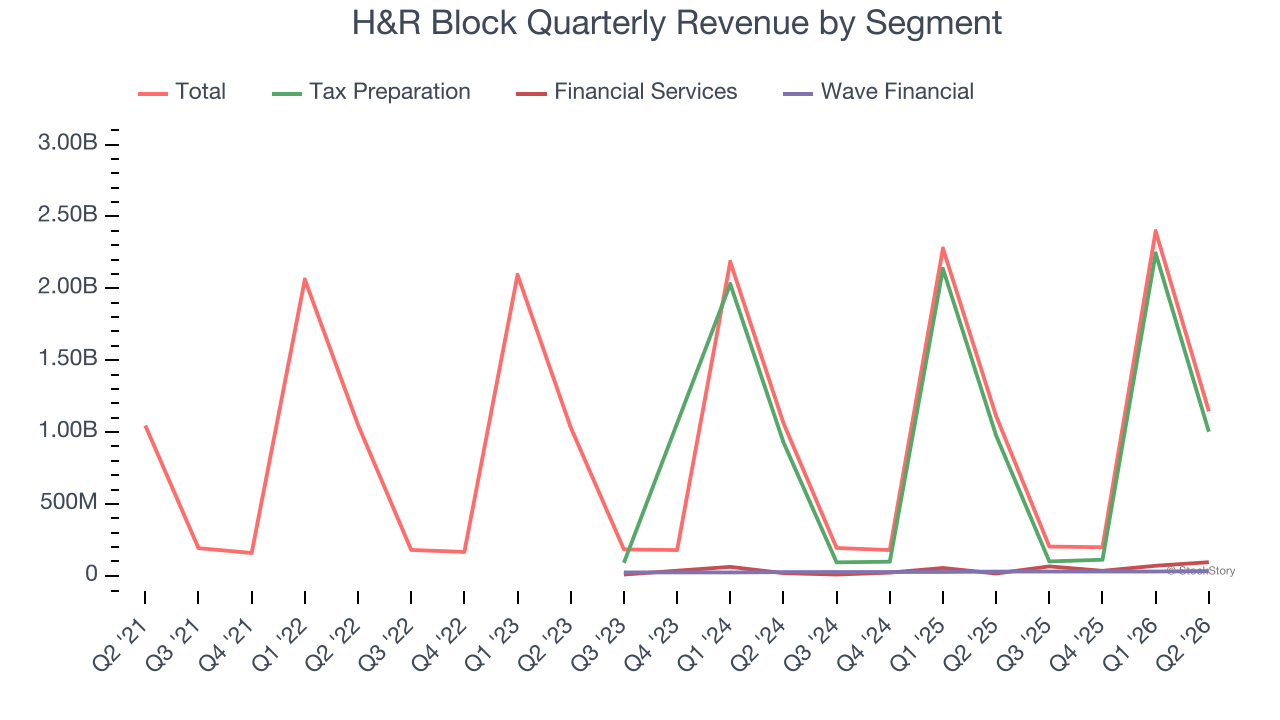
This quarter, H&R Block reported modest year-on-year revenue growth of 3% but beat Wall Street’s estimates by 2.5%.
Looking ahead, sell-side analysts expect revenue to grow 2.8% over the next 12 months, a slight deceleration versus the last two years. This projection is underwhelming and implies its products and services will see some demand headwinds.
ALSO WORTH WATCHING: Nvidia’s Quiet Partner. Nvidia’s chips cost a hundred grand. The connectors that make them work cost even more. One company makes them all.
Every AI server needs specialized infrastructure the chip companies don’t make. High-speed cables. Power connectors. Thermal sensors. This 90-year-old company built a monopoly on it. The AI boom just started. This stock is still flying under the radar. Claim The Stock Ticker Here for FREE.
Operating Margin
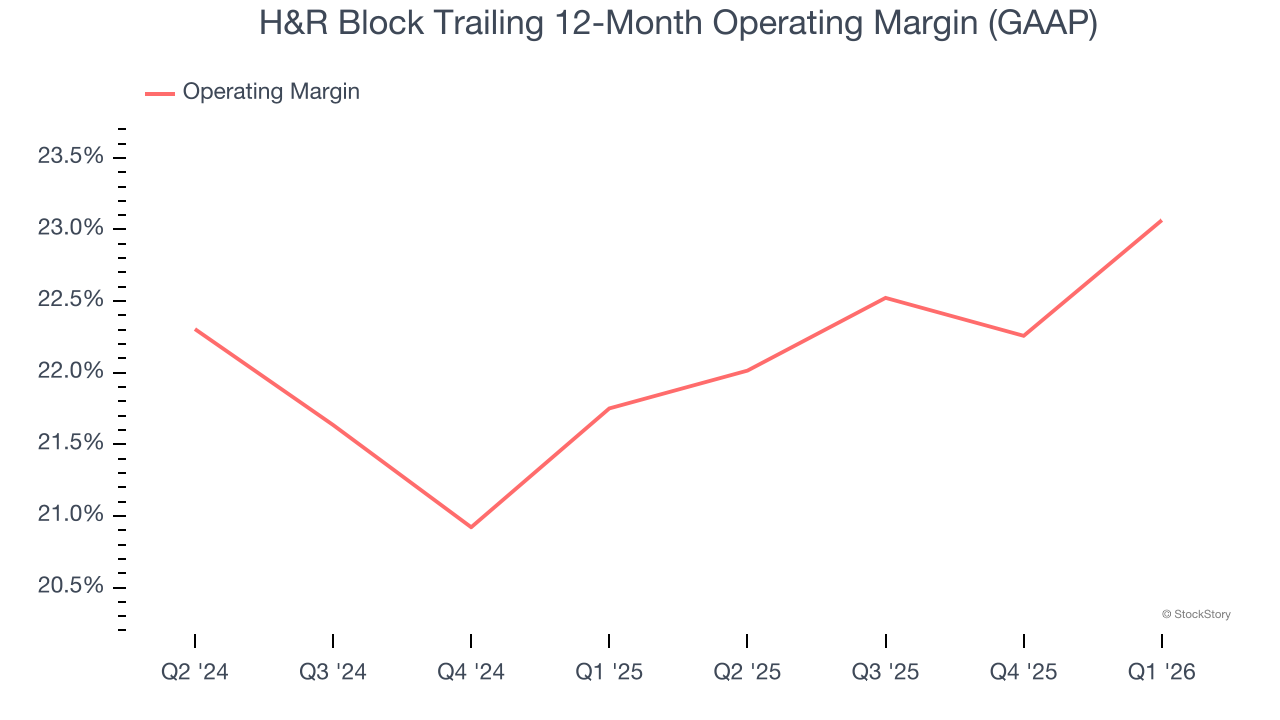
in line with the same quarter last year. Because H&R Block is a seasonal business, we prefer to analyze longer-term performance rather than one quarter.
Earnings Per Share
We track the long-term change in earnings per share (EPS) for the same reason as long-term revenue growth. Compared to revenue, however, EPS highlights whether a company’s growth is profitable.
H&R Block’s EPS grew at 4.6% compounded annual growth rate over the last five years. This performance was better than its revenue growth but doesn’t tell us much about its business quality because its operating margin improvement was less than peers.
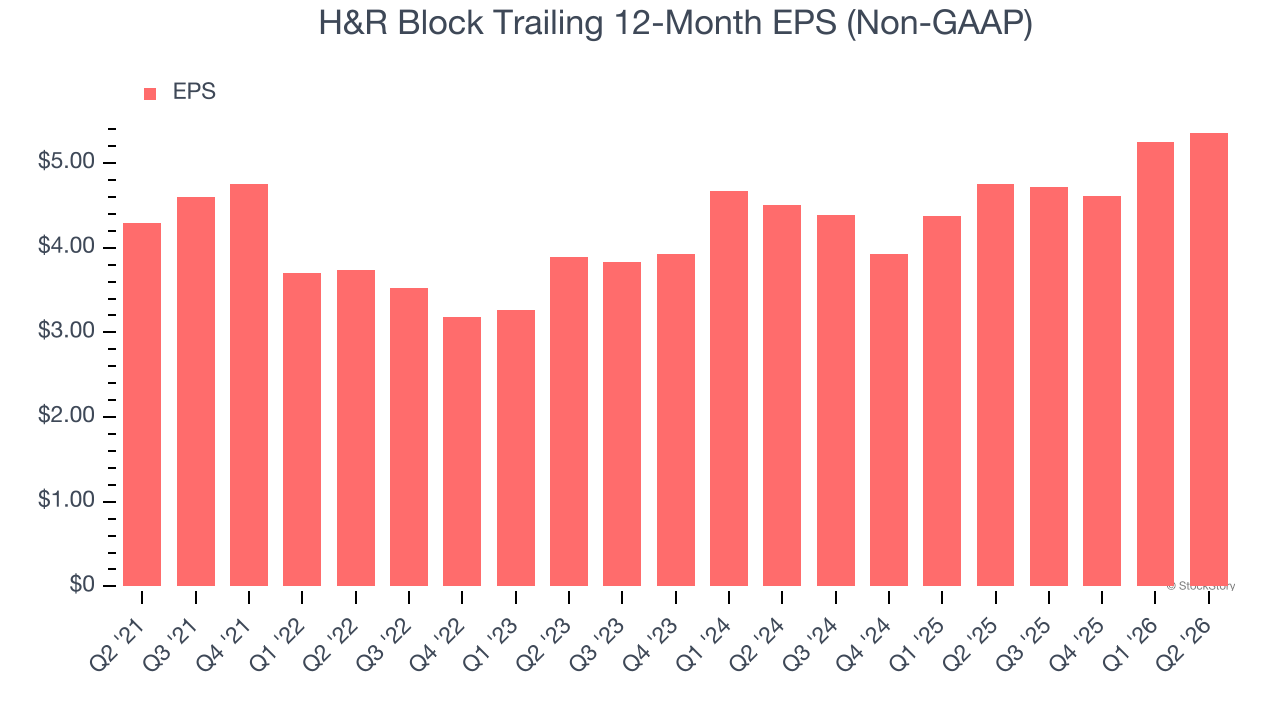
In Q2, H&R Block reported adjusted EPS of $2.38, up from $2.27 in the same quarter last year. This print beat analysts’ estimates by 7.7%. Over the next 12 months, Wall Street expects H&R Block’s full-year EPS to grow 15.3% from $5.36 to $6.18.
Key Takeaways from H&R Block’s Q2 Results
It was great to see H&R Block’s full-year revenue guidance top analysts’ expectations. We were also glad its full-year EBITDA guidance exceeded Wall Street’s estimates. Overall, we think this was a decent quarter with some key metrics above expectations. The stock traded up 12.2% to $52.38 immediately following the results.
Indeed, H&R Block had a rock-solid quarterly earnings result, but is this stock a good investment here? We think that the latest quarter is only one piece of the longer-term business quality puzzle. Quality, when combined with valuation, can help determine if the stock is a buy. We cover that in our actionable full research report which you can read here (it’s free).