Old National Bank trades at $26.83 per share and has stayed right on track with the overall market, gaining 10.1% over the last six months. At the same time, the S&P 500 has returned 13.5%.
Is now a good time to buy ONB? Find out in our full research report, it’s free.
Why Does Old National Bank Spark Debate?
Tracing its roots back to 1834 when Andrew Jackson was president, Old National Bancorp (NASDAQ: ONB) is a bank holding company that provides commercial and consumer loans, deposit services, wealth management, and treasury solutions primarily throughout the Midwest region.
Two Things to Like:
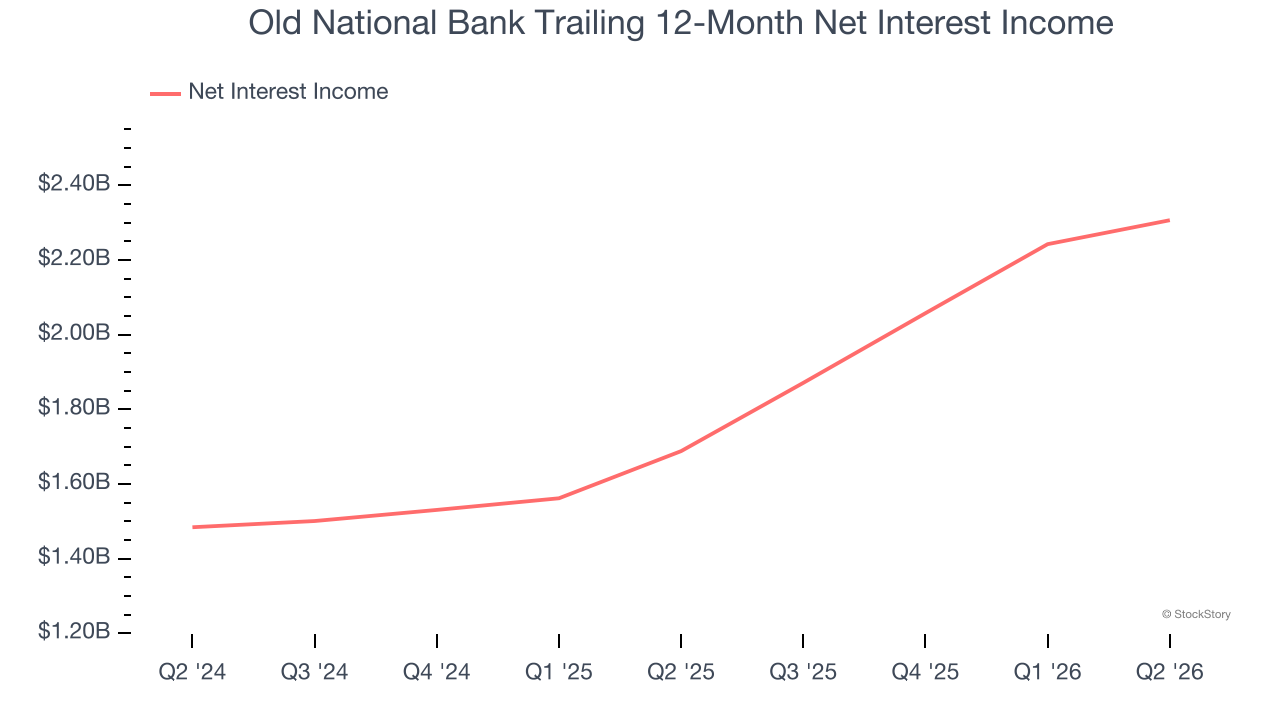
1. Net Interest Income Skyrockets, Fueling Growth Opportunities
While banks generate revenue from multiple sources, investors view net interest income as a cornerstone — its predictable, recurring characteristics stand in sharp contrast to the volatility of one-time fees.
Old National Bank’s net interest income has grown at a 30.7% annualized rate over the last five years, much better than the broader banking industry and faster than its total revenue. Its growth was driven by both an increase in its outstanding loans and net interest margin, which represents how much a bank earns in relation to its outstanding loan book.
2. Forecasted Efficiency Ratio Shows Stronger Profits Ahead
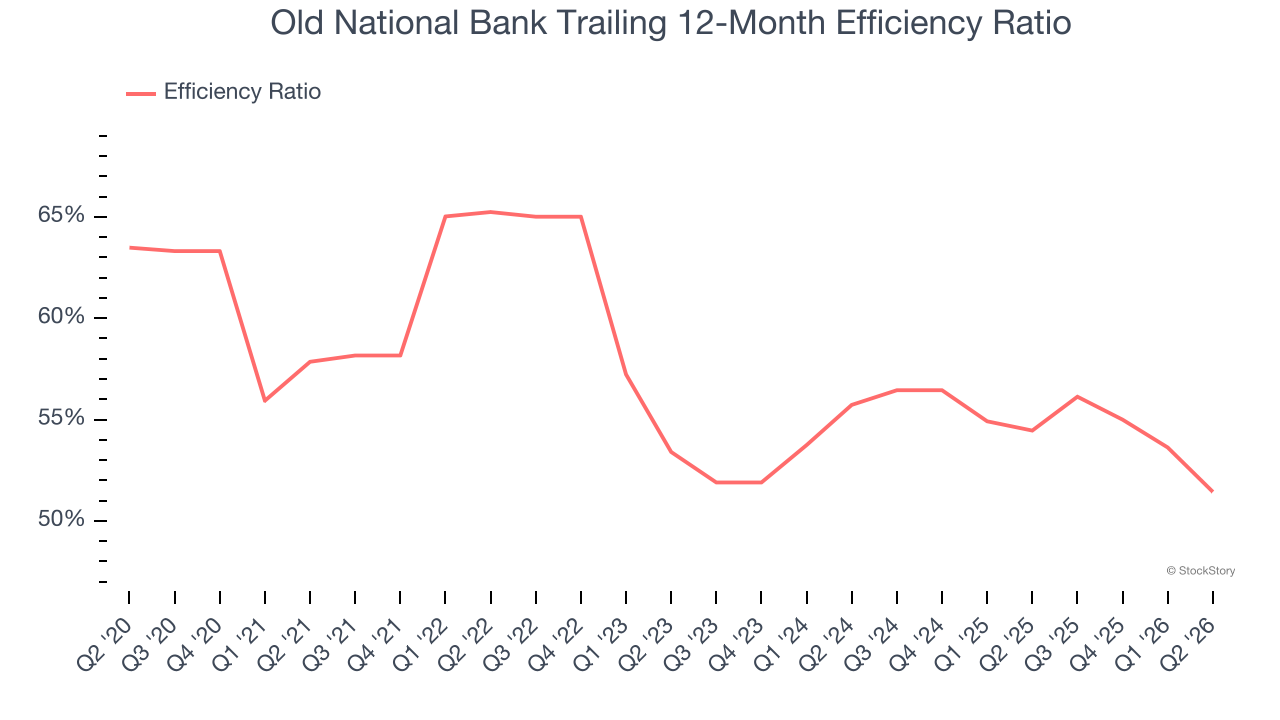
Topline growth carries importance, but the overall profitability behind this expansion determines true value creation. For banks, the efficiency ratio captures this relationship by measuring non-interest expenses, including salaries, facilities, technology, and marketing, against total revenue.
Investors focus on efficiency ratio changes rather than absolute levels, understanding that expense structures vary by revenue mix. Counterintuitively, lower efficiency ratios indicate better performance since they represent lower costs relative to revenue.
For the next 12 months, Wall Street expects Old National Bank to rein in some of its expenses as it anticipates an efficiency ratio of 46.1% compared to 51.4% over the past year.
One Reason to Be Careful:
EPS Barely Growing
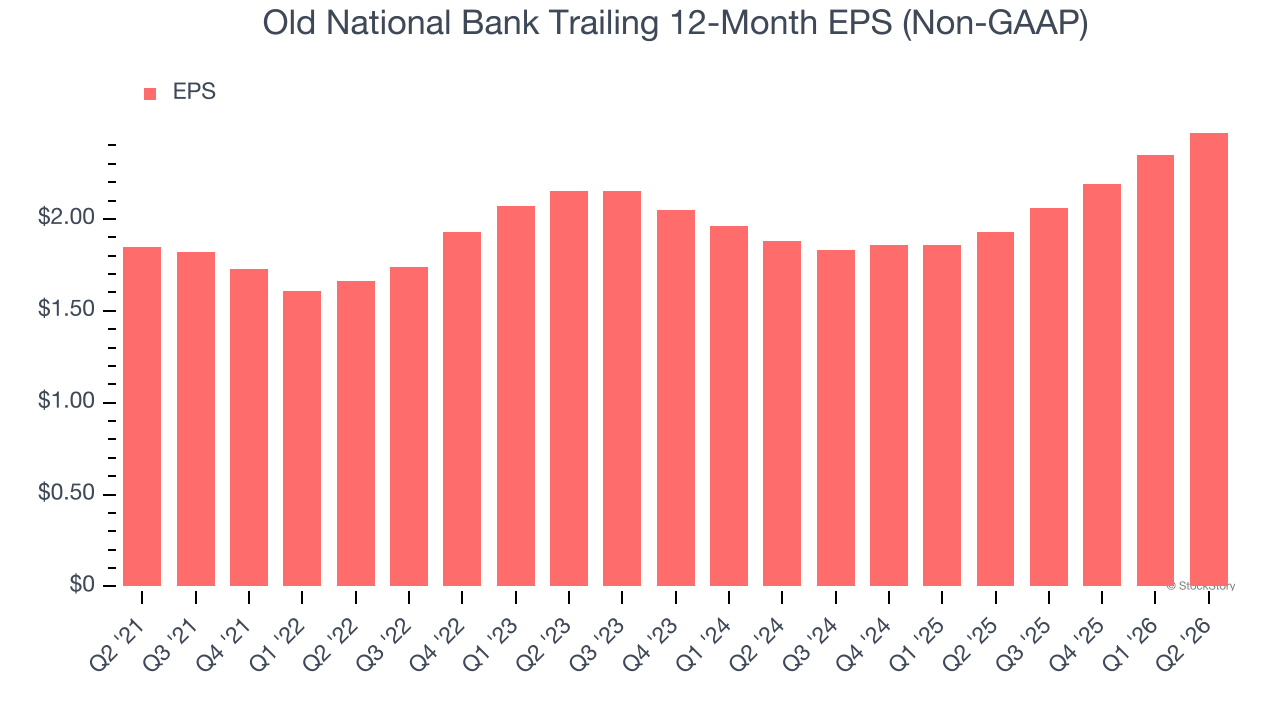
Analyzing the long-term change in earnings per share (EPS) shows whether a company’s incremental sales were profitable — for example, revenue could be inflated through excessive spending on advertising and promotions.
Old National Bank’s EPS grew at a weak 6% compounded annual growth rate over the last five years, lower than its 27.7% annualized revenue growth. This tells us the company became less profitable on a per-share basis as it expanded.
Final Judgment
Old National Bank has huge potential even though it has some open questions. At $26.83 per share (or 1.2× forward P/B), is now the right time to buy the stock? See for yourself in our full research report, it’s free.
Stocks We Like Even More Than Old National Bank
WHILE YOU’RE HERE: Top 9 Market-Beating Stocks. The best stocks don’t just beat the market once. They do it again. And again. Robust revenue growth, rising free cash flow, returns on capital that leave their competition in the dust. The market has already rewarded these businesses.
But our AI platform says the party isn’t over. Find out which 9 stocks made the cut this week — FREE. Get Our Top 9 Market-Beating Stocks for Free HERE.
Stocks that have made our list include now familiar names such as Nvidia (+1,460% between June 2020 and June 2025) as well as under-the-radar businesses like the once-small-cap company Exlservice (+271% between June 2020 and June 2025). Find your next big winner with StockStory today.