Supplemental insurance provider Aflac (NYSE: AFL) missed Wall Street’s revenue expectations in Q2 CY2026, with sales falling 9.2% year on year to $4.12 billion. Its non-GAAP profit of $1.75 per share was in line with analysts’ consensus estimates.
Is now the time to buy Aflac? Find out by accessing our full research report, it’s free.
Aflac (AFL) Q2 CY2026 Highlights:
- Revenue: $4.12 billion vs analyst estimates of $4.23 billion (9.2% year-on-year decline, 2.7% miss)
- Pre-tax Profit: $995 million (24.2% margin)
- Adjusted EPS: $1.75 vs analyst estimates of $1.76 (in line)
- Book Value per Share: $60.35 vs analyst estimates of $55.23 (18.7% year-on-year growth, 9.3% beat)
- Market Capitalization: $63.91 billion
Commenting on the company's results, Aflac Incorporated Chairman and Chief Executive Officer Daniel P. Amos stated: "Aflac delivered solid earnings for the quarter and for the first six months. These results reflect execution of our strategy, driving long-term value for shareholders. In Japan, we have secured new opportunities through successful product initiatives including Anshin Palette (medical insurance), Miraito (cancer insurance) and Tsumitasu (life insurance). In the U.S., our focus is on meeting the evolving needs of employers and their employees with supplemental health products and related benefits.
Company Overview
Known for its iconic duck mascot that has quacked "Aflac!" in commercials since 2000, Aflac (NYSE: AFL) provides supplemental health and life insurance policies that pay cash benefits directly to policyholders for expenses not covered by their primary insurance.
Revenue Growth
Big picture, insurers generate revenue from three key sources. The first is the core business of underwriting policies. The second source is income from investing the “float” (premiums collected upfront not yet paid out as claims) in assets such as fixed-income assets and equities. The third is fees from various sources such as policy administration, annuities, or other value-added services. Aflac struggled to consistently generate demand over the last five years as its revenue dropped at a 5.1% annual rate. This was below our standards and is a sign of poor business quality.
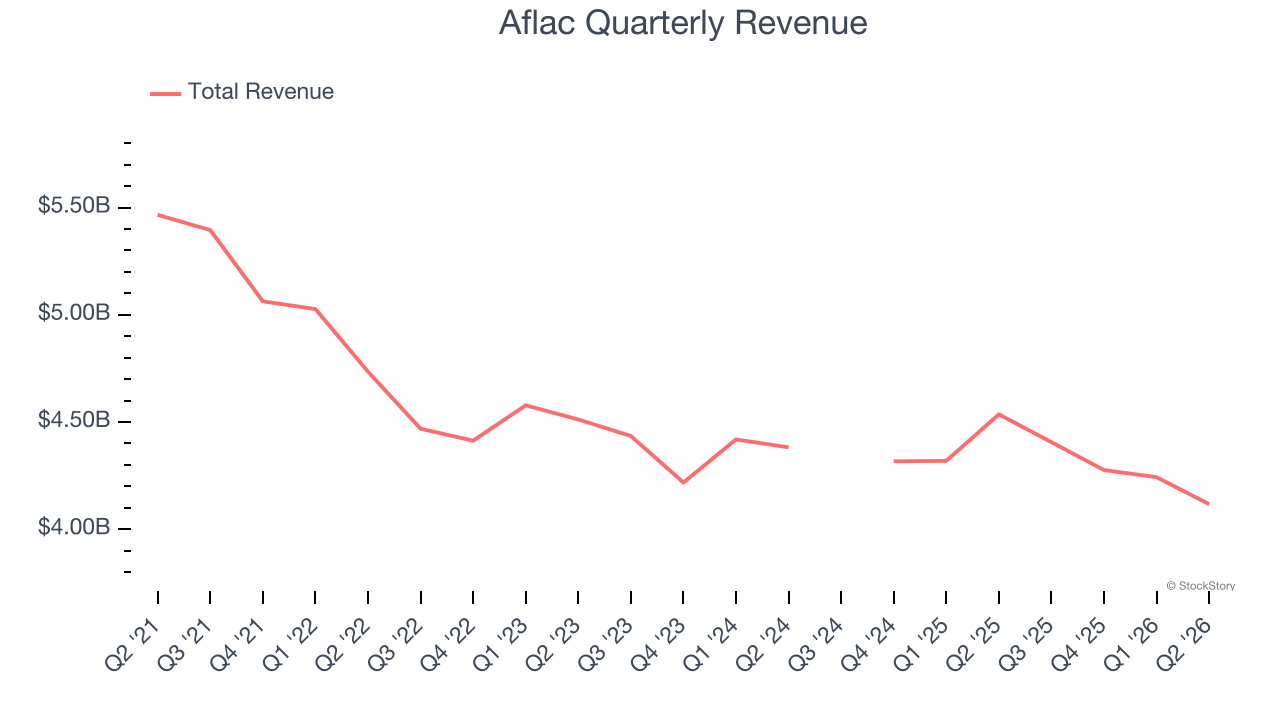 Note: Quarters not shown were determined to be outliers because they were impacted by outsized investment gains/losses that are not indicative of the recurring fundamentals of the business.
Long-term growth is the most important, but within financials, a half-decade historical view may miss recent interest rate changes and market returns. Aflac’s annualized revenue declines of 1.2% over the last two years suggest its demand continued shrinking. 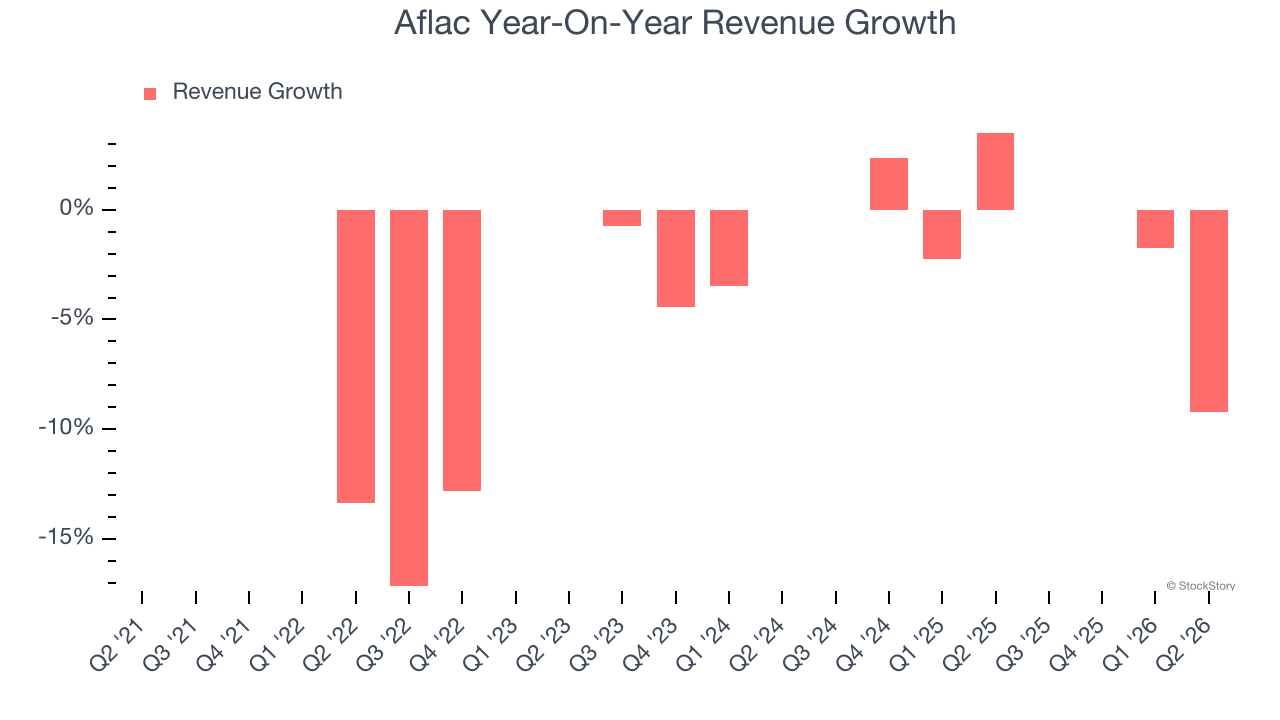 Note: Quarters not shown were determined to be outliers because they were impacted by outsized investment gains/losses that are not indicative of the recurring fundamentals of the business.
This quarter, Aflac missed Wall Street’s estimates and reported a rather uninspiring 9.2% year-on-year revenue decline, generating $4.12 billion of revenue.
Net premiums earned made up 82.1% of the company’s total revenue during the last five years, meaning Aflac barely relies on non-insurance activities to drive its overall growth.
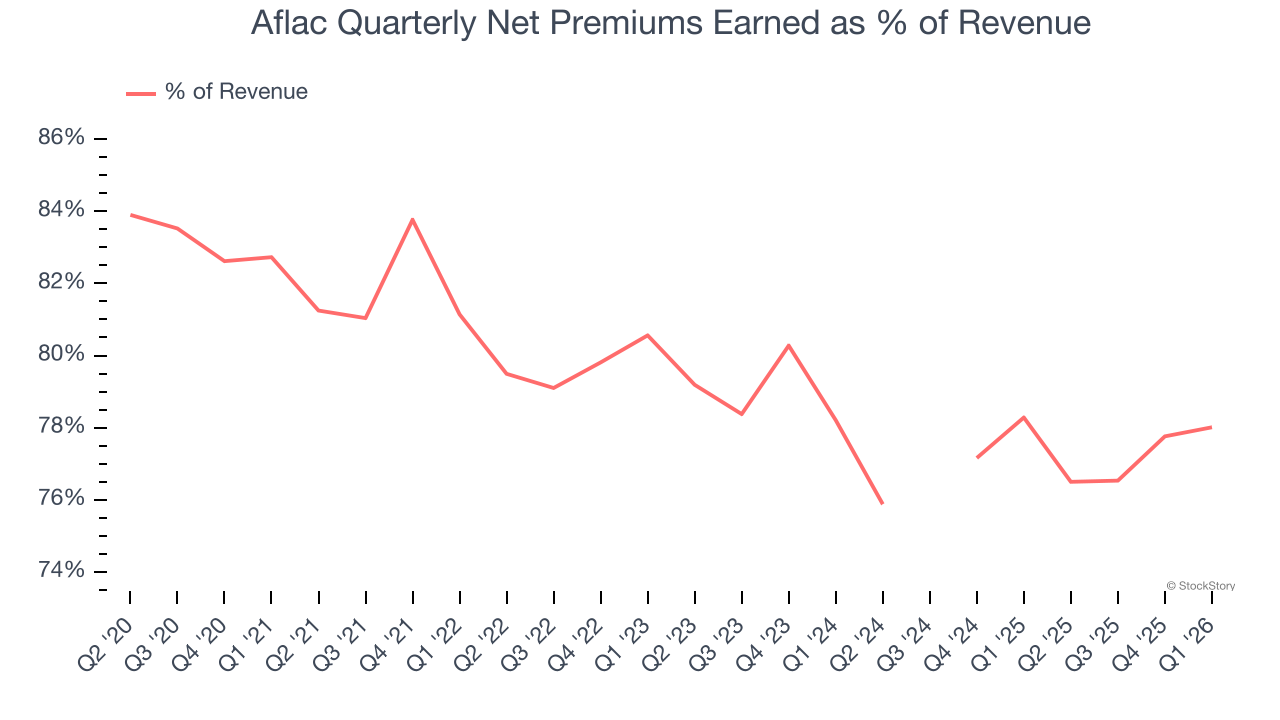 Note: Quarters not shown were determined to be outliers because they were impacted by outsized investment gains/losses that are not indicative of the recurring fundamentals of the business.
Markets consistently prioritize net premiums earned growth over investment and fee income, recognizing its superior quality as a core indicator of the company’s underwriting success and market penetration.
WHILE YOU’RE HERE: The Next Palantir? One satellite company captures images of every point on Earth. Every single day. The Pentagon wants it. Hedge funds are using it to beat earnings. You’ve probably never heard of it.
This is what the early days of Palantir looked like before it became a giant. Same playbook. Different technology. If you missed Palantir, you need to see this. Claim The Stock Ticker for Free HERE.
Book Value Per Share (BVPS)
Insurance companies are balance sheet businesses, collecting premiums upfront and paying out claims over time. The float (premiums collected but not yet paid out) is invested, creating an asset base supported by a liability structure. Book value per share (BVPS) captures this dynamic by measuring these assets (investment portfolio, cash, reinsurance recoverables) less liabilities (claim reserves, debt, future policy benefits). BVPS is essentially the residual value for shareholders.
We therefore consider BVPS very important to track for insurers and a metric that sheds light on business quality. While other (and more commonly known) per-share metrics like EPS can sometimes be lumpy due to reserve releases or one-time items and can be managed or skewed while still following accounting rules, BVPS reflects long-term capital growth and is harder to manipulate.
Aflac’s BVPS grew at a sluggish 3.8% annual clip over the last five years. However, BVPS growth has accelerated recently, growing by 14% annually over the last two years from $46.40 to $60.35 per share.
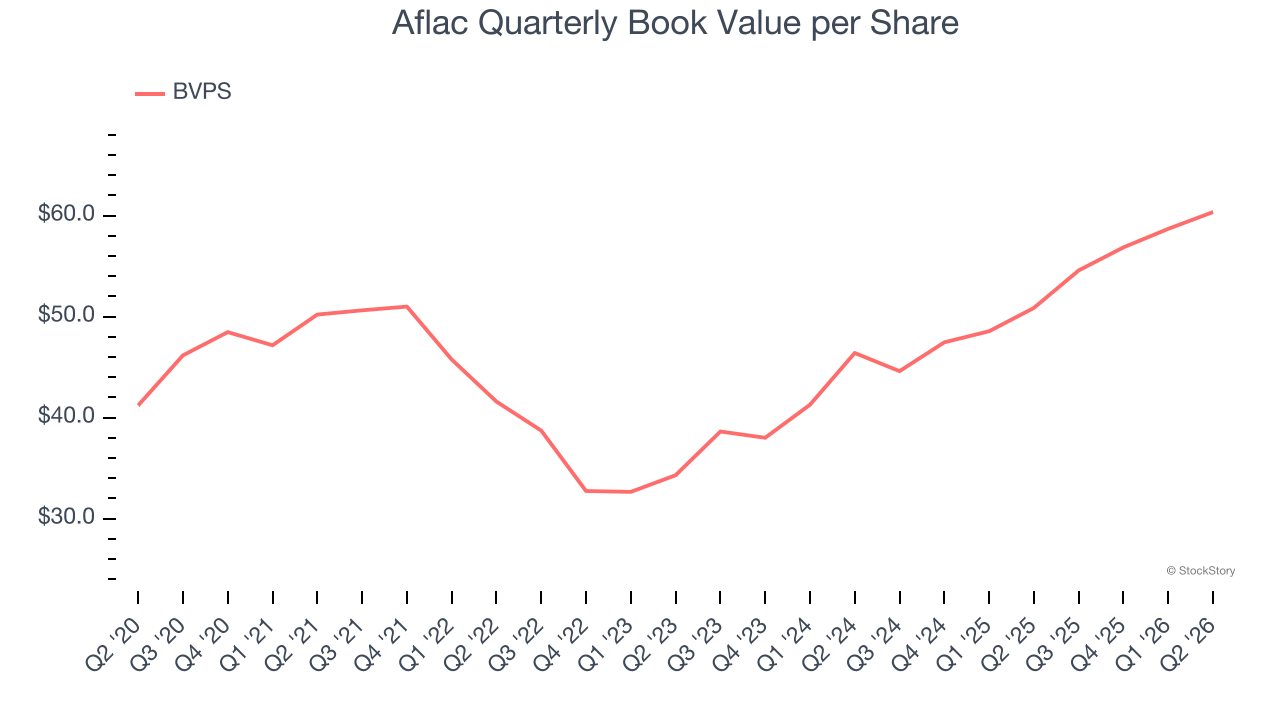
Over the next 12 months, Consensus estimates call for Aflac’s BVPS to shrink by 7% to $55.23, a sour projection.
Key Takeaways from Aflac’s Q2 Results
We were impressed by how significantly Aflac blew past analysts’ book value per share expectations this quarter. On the other hand, its revenue missed and its EPS was in line with Wall Street’s estimates. Overall, this was a softer quarter. The stock traded down 1.4% to $124.92 immediately following the results.
Big picture, is Aflac a buy here and now? If you’re making that decision, you should consider the bigger picture of valuation, business qualities, as well as the latest earnings. We cover that in our actionable full research report which you can read here (it’s free).