
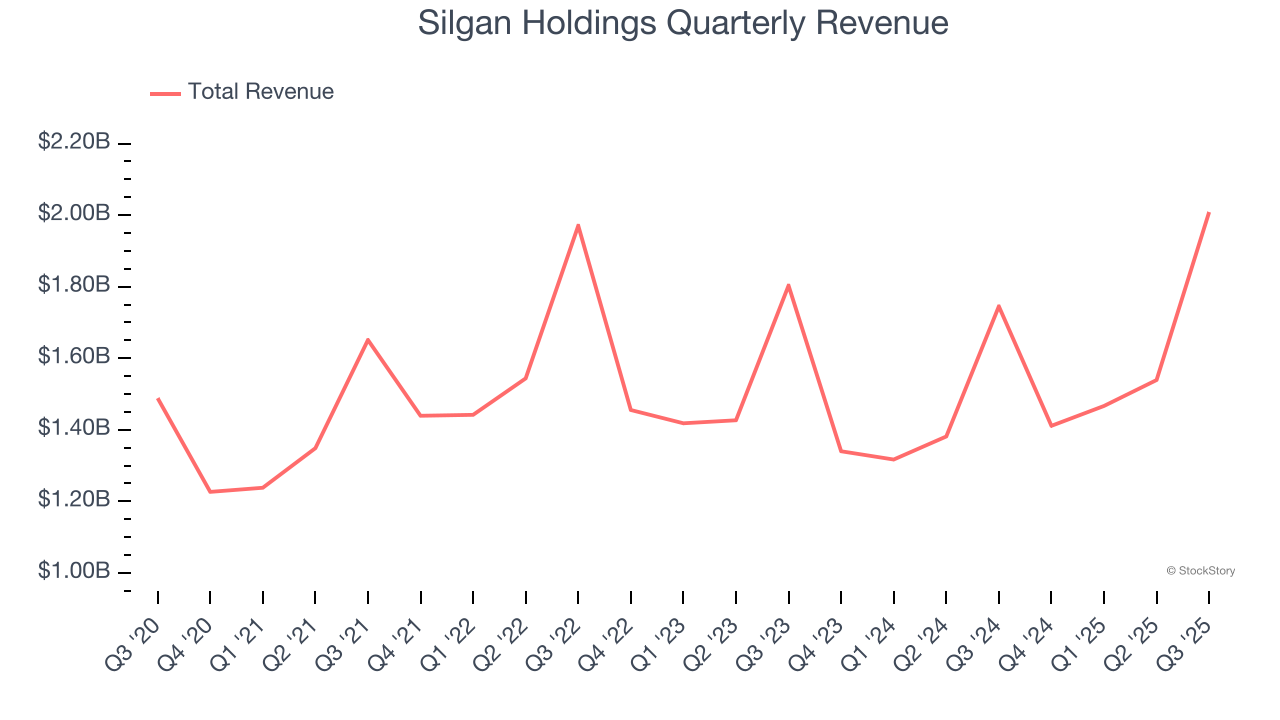
Rigid packaging solutions manufacturer Silgan Holdings (NYSE: SLGN) reported Q3 CY2025 results beating Wall Street’s revenue expectations, with sales up 15.1% year on year to $2.01 billion. Its non-GAAP profit of $1.22 per share was in line with analysts’ consensus estimates.
Is now the time to buy Silgan Holdings? Find out by accessing our full research report, it’s free for active Edge members.
Silgan Holdings (SLGN) Q3 CY2025 Highlights:
- Revenue: $2.01 billion vs analyst estimates of $1.92 billion (15.1% year-on-year growth, 4.4% beat)
- Adjusted EPS: $1.22 vs analyst estimates of $1.22 (in line)
- Adjusted EBITDA: $281.6 million vs analyst estimates of $284.5 million (14% margin, 1% miss)
- Management lowered its full-year Adjusted EPS guidance to $3.71 at the midpoint, a 6.1% decrease
- Operating Margin: 9.9%, in line with the same quarter last year
- Free Cash Flow Margin: 13%, down from 14.2% in the same quarter last year
- Market Capitalization: $4.79 billion
"Our third quarter results continued to exhibit the success of our strategic growth initiatives, the resilience of our business through dynamic customer and end market conditions and the benefits of our disciplined capital deployment model, as we delivered 11% Adjusted EBITDA growth in the quarter. The strength and focus of our teams, our market leading innovation and the power of our diverse portfolio continue to set us apart in the markets we serve, and our long-term customer partnerships continue to strengthen as we expand our capabilities across consumer packaging," said Adam Greenlee, President and CEO.
Company Overview
Established in 1987, Silgan Holdings (NYSE: SLGN) is a supplier of rigid packaging for consumer goods products, specializing in metal containers, closures, and plastic packaging.
Revenue Growth
A company’s long-term sales performance is one signal of its overall quality. Any business can put up a good quarter or two, but many enduring ones grow for years. Unfortunately, Silgan Holdings’s 6.3% annualized revenue growth over the last five years was mediocre. This was below our standard for the industrials sector and is a tough starting point for our analysis.
We at StockStory place the most emphasis on long-term growth, but within industrials, a half-decade historical view may miss cycles, industry trends, or a company capitalizing on catalysts such as a new contract win or a successful product line. Silgan Holdings’s recent performance shows its demand has slowed as its annualized revenue growth of 2.6% over the last two years was below its five-year trend. 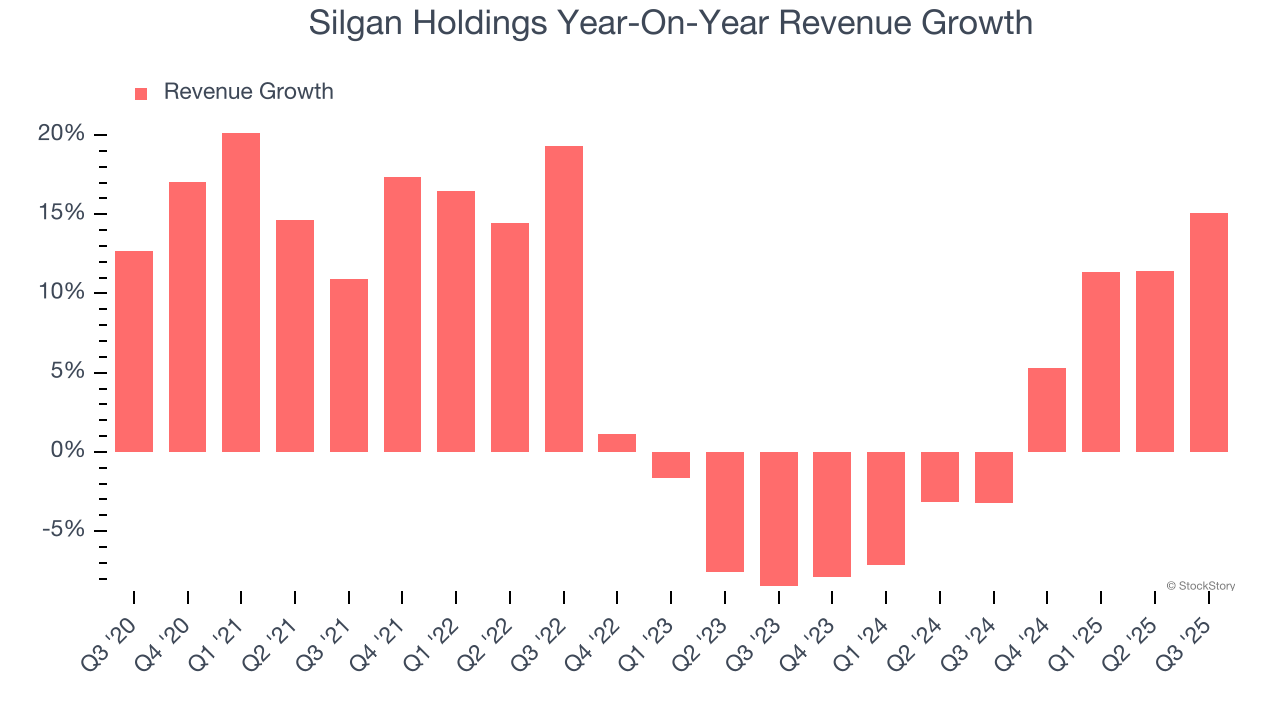
This quarter, Silgan Holdings reported year-on-year revenue growth of 15.1%, and its $2.01 billion of revenue exceeded Wall Street’s estimates by 4.4%.
Looking ahead, sell-side analysts expect revenue to grow 2.2% over the next 12 months, similar to its two-year rate. This projection doesn't excite us and suggests its newer products and services will not catalyze better top-line performance yet.
Unless you’ve been living under a rock, it should be obvious by now that generative AI is going to have a huge impact on how large corporations do business. While Nvidia and AMD are trading close to all-time highs, we prefer a lesser-known (but still profitable) stock benefiting from the rise of AI. Click here to access our free report one of our favorites growth stories.
Operating Margin
Operating margin is an important measure of profitability as it shows the portion of revenue left after accounting for all core expenses – everything from the cost of goods sold to advertising and wages. It’s also useful for comparing profitability across companies with different levels of debt and tax rates because it excludes interest and taxes.
Silgan Holdings’s operating margin might fluctuated slightly over the last 12 months but has generally stayed the same, averaging 9.6% over the last five years. This profitability was higher than the broader industrials sector, showing it did a decent job managing its expenses.
Looking at the trend in its profitability, Silgan Holdings’s operating margin might fluctuated slightly but has generally stayed the same over the last five years. We like to see margin expansion, but we’re still happy with Silgan Holdings’s performance considering most Industrial Packaging companies saw their margins plummet.
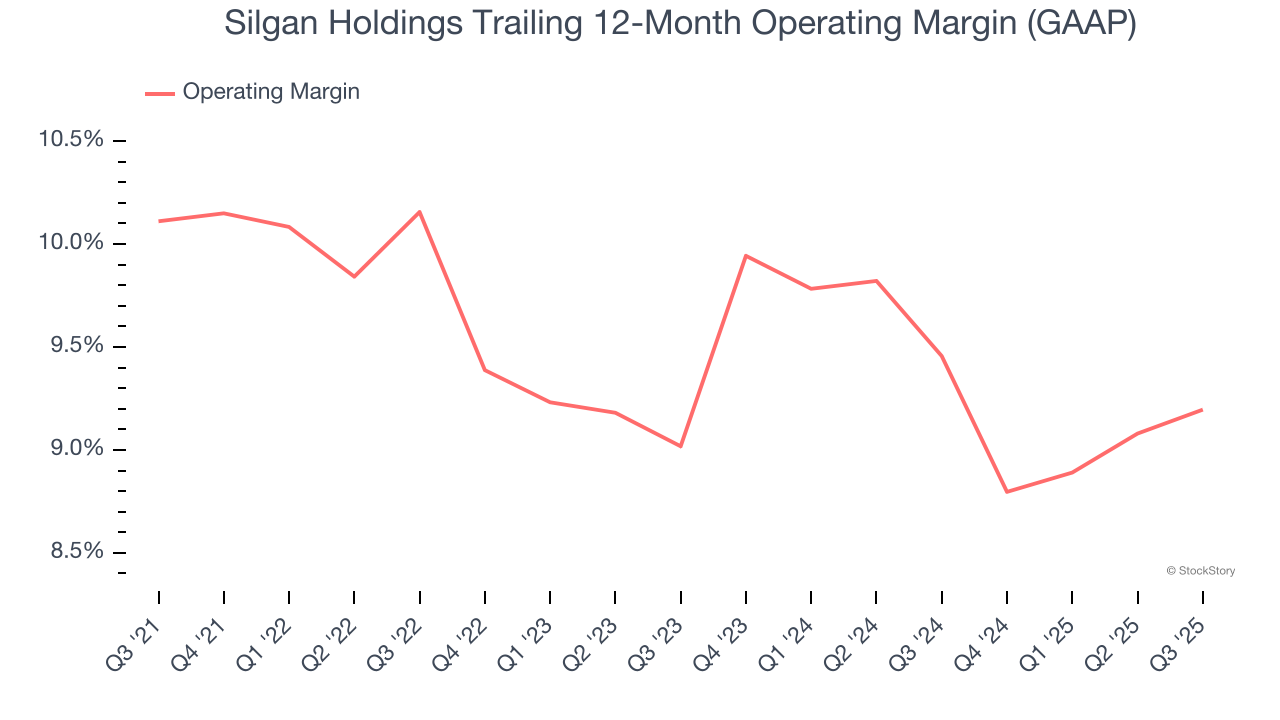
This quarter, Silgan Holdings generated an operating margin profit margin of 9.9%, in line with the same quarter last year. This indicates the company’s cost structure has recently been stable.
Earnings Per Share
We track the long-term change in earnings per share (EPS) for the same reason as long-term revenue growth. Compared to revenue, however, EPS highlights whether a company’s growth is profitable.
Silgan Holdings’s unimpressive 6.5% annual EPS growth over the last five years aligns with its revenue performance. This tells us it maintained its per-share profitability as it expanded.
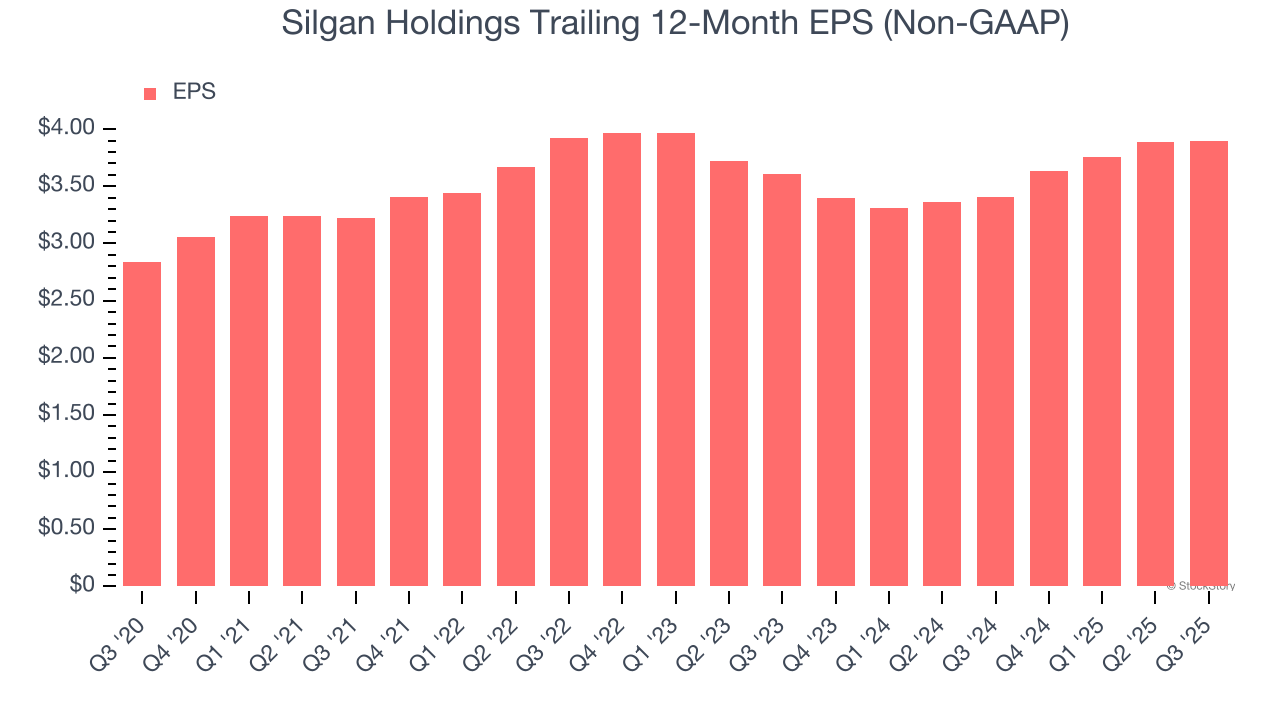
Like with revenue, we analyze EPS over a more recent period because it can provide insight into an emerging theme or development for the business.
For Silgan Holdings, its two-year annual EPS growth of 3.9% was lower than its five-year trend. We hope its growth can accelerate in the future.
In Q3, Silgan Holdings reported adjusted EPS of $1.22, up from $1.21 in the same quarter last year. This print was close to analysts’ estimates. Over the next 12 months, Wall Street expects Silgan Holdings’s full-year EPS of $3.90 to grow 6.3%.
Key Takeaways from Silgan Holdings’s Q3 Results
We were impressed by how significantly Silgan Holdings beat analysts’ revenue expectations this quarter. On the other hand, its full-year EPS guidance missed and its EPS guidance for next quarter fell short of Wall Street’s estimates. Overall, this was a weaker quarter. The stock traded down 10.6% to $40 immediately after reporting.
Silgan Holdings’s earnings report left more to be desired. Let’s look forward to see if this quarter has created an opportunity to buy the stock. If you’re making that decision, you should consider the bigger picture of valuation, business qualities, as well as the latest earnings. We cover that in our actionable full research report which you can read here, it’s free for active Edge members.


