
What a time it’s been for ThredUp. In the past six months alone, the company’s stock price has increased by a massive 285%, reaching $10.28 per share. This was partly due to its solid quarterly results, and the run-up might have investors contemplating their next move.
Is there a buying opportunity in ThredUp, or does it present a risk to your portfolio? Check out our in-depth research report to see what our analysts have to say, it’s free.
Why Do We Think ThredUp Will Underperform?
We’re happy investors have made money, but we don't have much confidence in ThredUp. Here are three reasons why we avoid TDUP and a stock we'd rather own.
1. Inability to Grow Orders Points to Weak Demand
Revenue growth can be broken down into changes in price and volume (for companies like ThredUp, our preferred volume metric is orders). While both are important, the latter is the most critical to analyze because prices have a ceiling.
Over the last two years, ThredUp failed to grow its orders, which came in at 1.54 million in the latest quarter. This performance was underwhelming and implies there may be increasing competition or market saturation. It also suggests ThredUp might have to lower prices or invest in product improvements to accelerate growth, factors that can hinder near-term profitability. 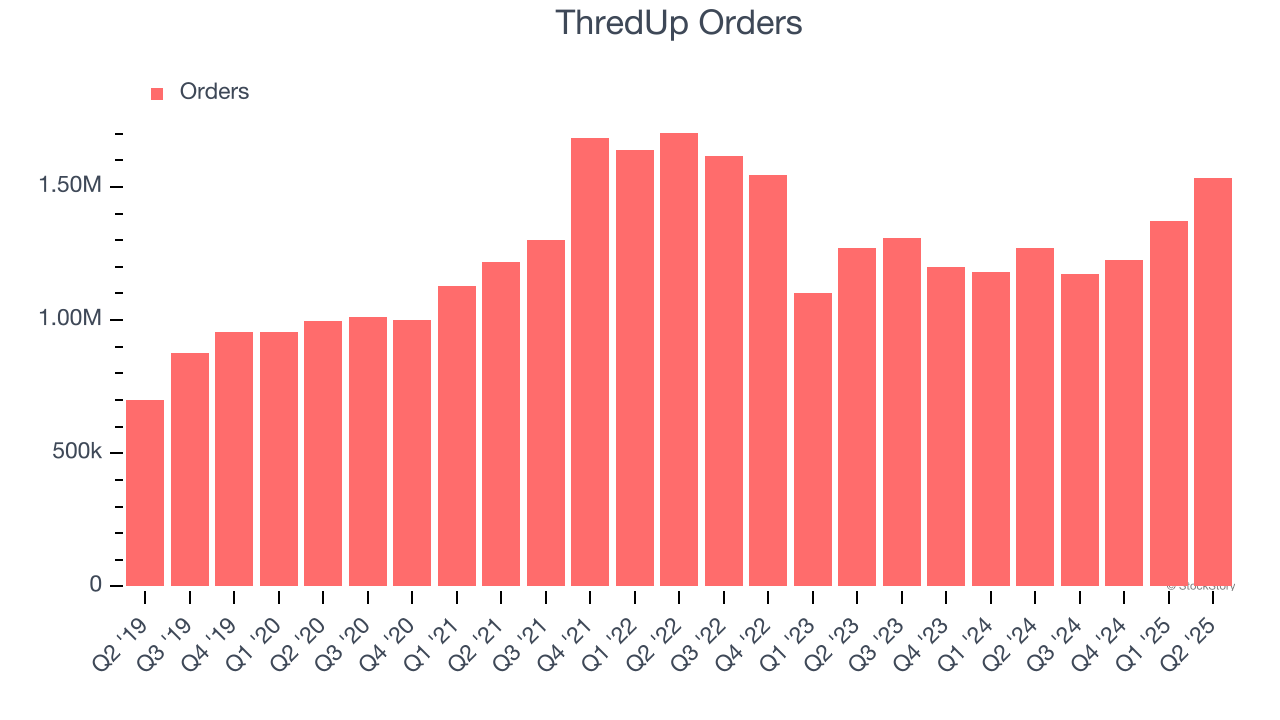
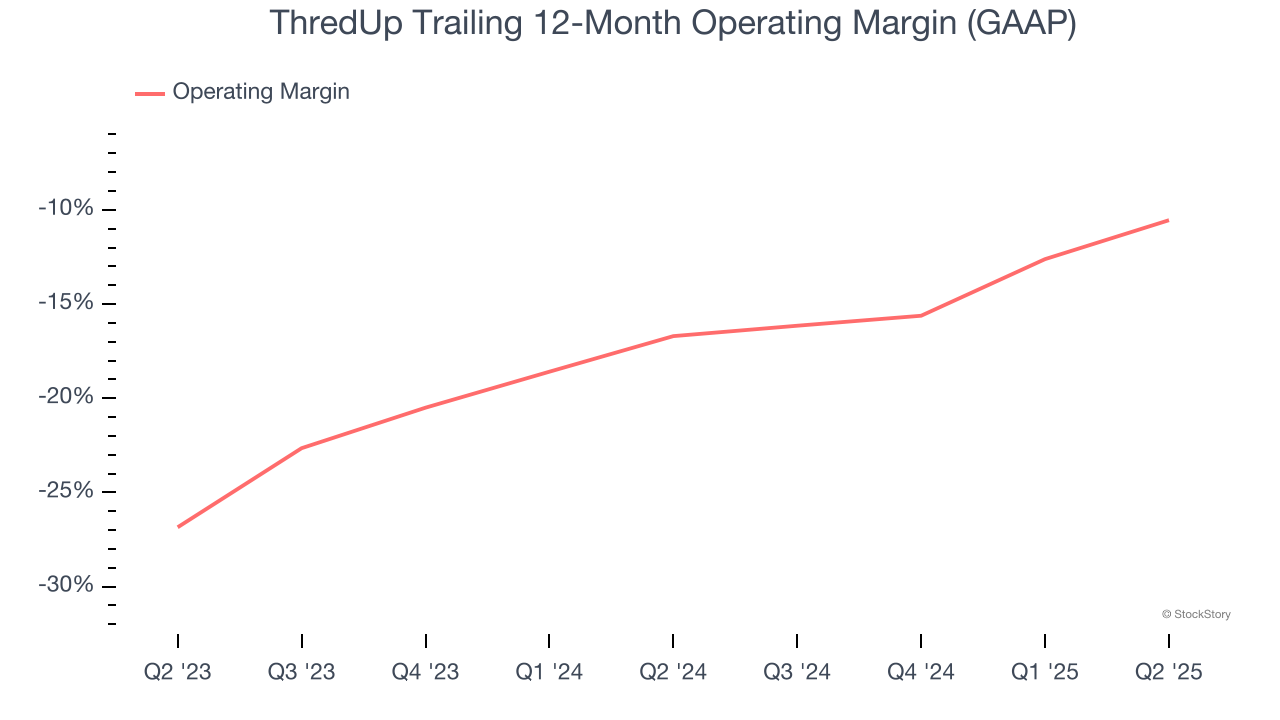
2. Operating Losses Sound the Alarms
Operating margin is a key measure of profitability. Think of it as net income - the bottom line - excluding the impact of taxes and interest on debt, which are less connected to business fundamentals.
ThredUp’s operating margin has risen over the last 12 months, but it still averaged negative 13.5% over the last two years. This is due to its large expense base and inefficient cost structure.
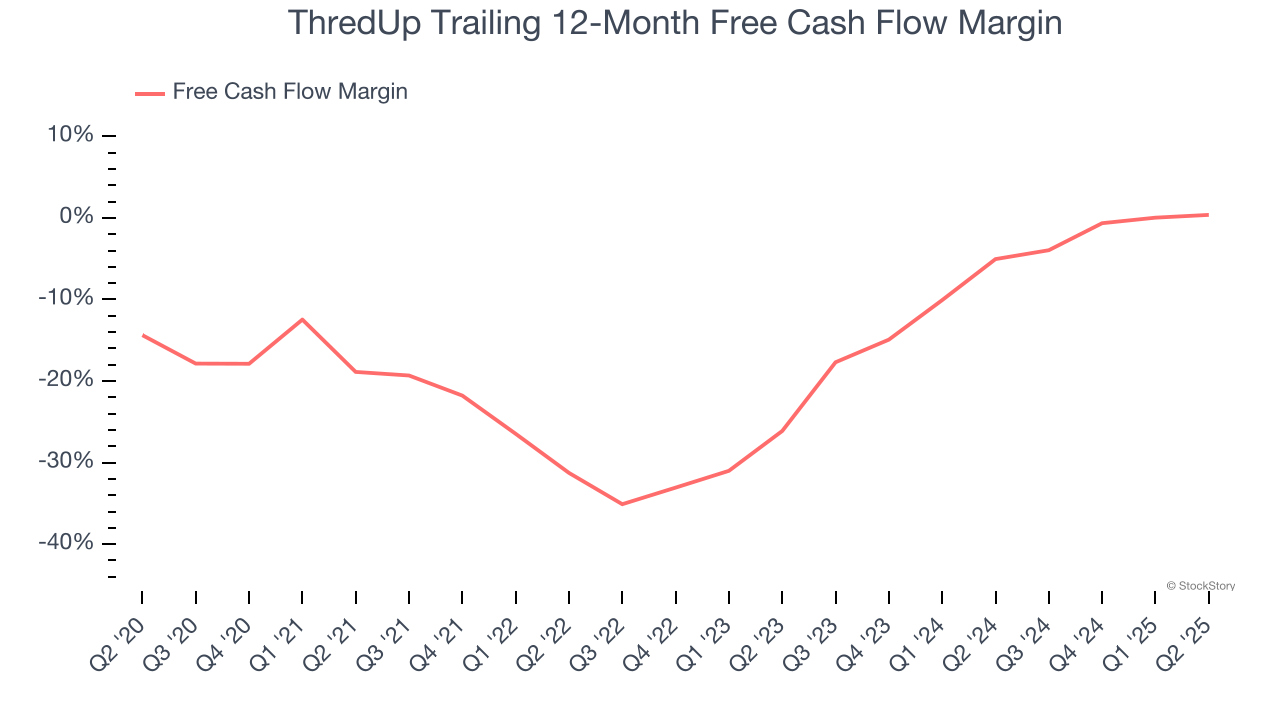
3. Cash Burn Ignites Concerns
Free cash flow isn't a prominently featured metric in company financials and earnings releases, but we think it's telling because it accounts for all operating and capital expenses, making it tough to manipulate. Cash is king.
Over the last two years, ThredUp’s demanding reinvestments to stay relevant have drained its resources, putting it in a pinch and limiting its ability to return capital to investors. Its free cash flow margin averaged negative 2.3%, meaning it lit $2.25 of cash on fire for every $100 in revenue.
Final Judgment
We see the value of companies helping consumers, but in the case of ThredUp, we’re out. Following the recent surge, the stock trades at 98.3× forward EV-to-EBITDA (or $10.28 per share). This multiple tells us a lot of good news is priced in - we think other companies feature superior fundamentals at the moment. We’d suggest looking at an all-weather company that owns household favorite Taco Bell.
Stocks We Would Buy Instead of ThredUp
Donald Trump’s April 2025 "Liberation Day" tariffs sent markets into a tailspin, but stocks have since rebounded strongly, proving that knee-jerk reactions often create the best buying opportunities.
The smart money is already positioning for the next leg up. Don’t miss out on the recovery - check out our Top 9 Market-Beating Stocks. This is a curated list of our High Quality stocks that have generated a market-beating return of 183% over the last five years (as of March 31st 2025).
Stocks that made our list in 2020 include now familiar names such as Nvidia (+1,545% between March 2020 and March 2025) as well as under-the-radar businesses like the once-small-cap company Comfort Systems (+782% five-year return). Find your next big winner with StockStory today.
StockStory is growing and hiring equity analyst and marketing roles. Are you a 0 to 1 builder passionate about the markets and AI? See the open roles here.


