Hotel company Hilton (NYSE: HLT) beat Wall Street’s revenue expectations in Q4 CY2025, with sales up 10.9% year on year to $3.09 billion. Its non-GAAP profit of $2.08 per share was 3.2% above analysts’ consensus estimates.
Is now the time to buy Hilton? Find out by accessing our full research report, it’s free.
Hilton (HLT) Q4 CY2025 Highlights:
- Revenue: $3.09 billion vs analyst estimates of $2.99 billion (10.9% year-on-year growth, 3.3% beat)
- Adjusted EPS: $2.08 vs analyst estimates of $2.02 (3.2% beat)
- Adjusted EBITDA: $946 million vs analyst estimates of $925.1 million (30.6% margin, 2.3% beat)
- Adjusted EPS guidance for the upcoming financial year 2026 is $8.71 at the midpoint, missing analyst estimates by 4.8%
- EBITDA guidance for the upcoming financial year 2026 is $4.02 billion at the midpoint, in line with analyst expectations
- Operating Margin: 19.5%, up from 17.6% in the same quarter last year
- RevPAR: $110.89 at quarter end, in line with the same quarter last year
- Market Capitalization: $75.24 billion
Company Overview
Founded in 1919, Hilton Worldwide (NYSE: HLT) is a global hospitality company with a portfolio of hotel brands.
Revenue Growth
A company’s long-term performance is an indicator of its overall quality. Any business can put up a good quarter or two, but the best consistently grow over the long haul. Over the last five years, Hilton grew its sales at a 22.8% annual rate. Although this growth is acceptable on an absolute basis, it fell slightly short of our standards for the consumer discretionary sector, which enjoys a number of secular tailwinds.
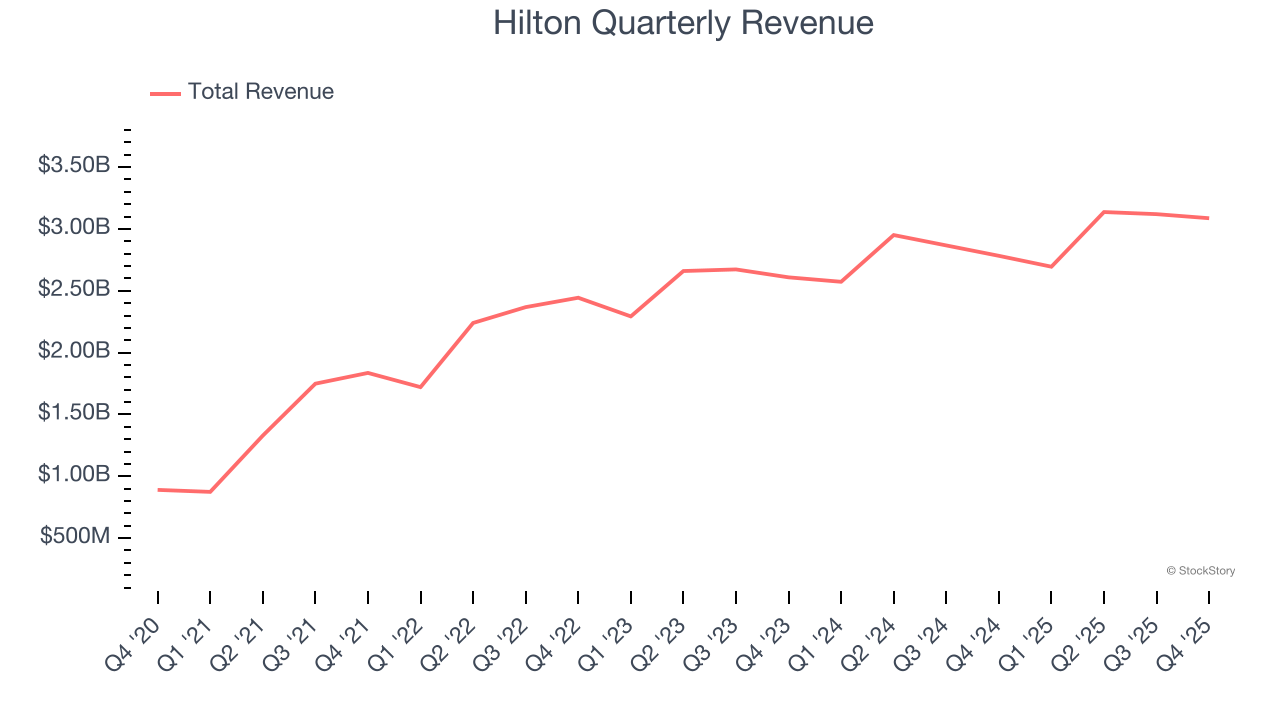
We at StockStory place the most emphasis on long-term growth, but within consumer discretionary, a stretched historical view may miss a company riding a successful new property or trend. Hilton’s recent performance shows its demand has slowed as its annualized revenue growth of 8.5% over the last two years was below its five-year trend. 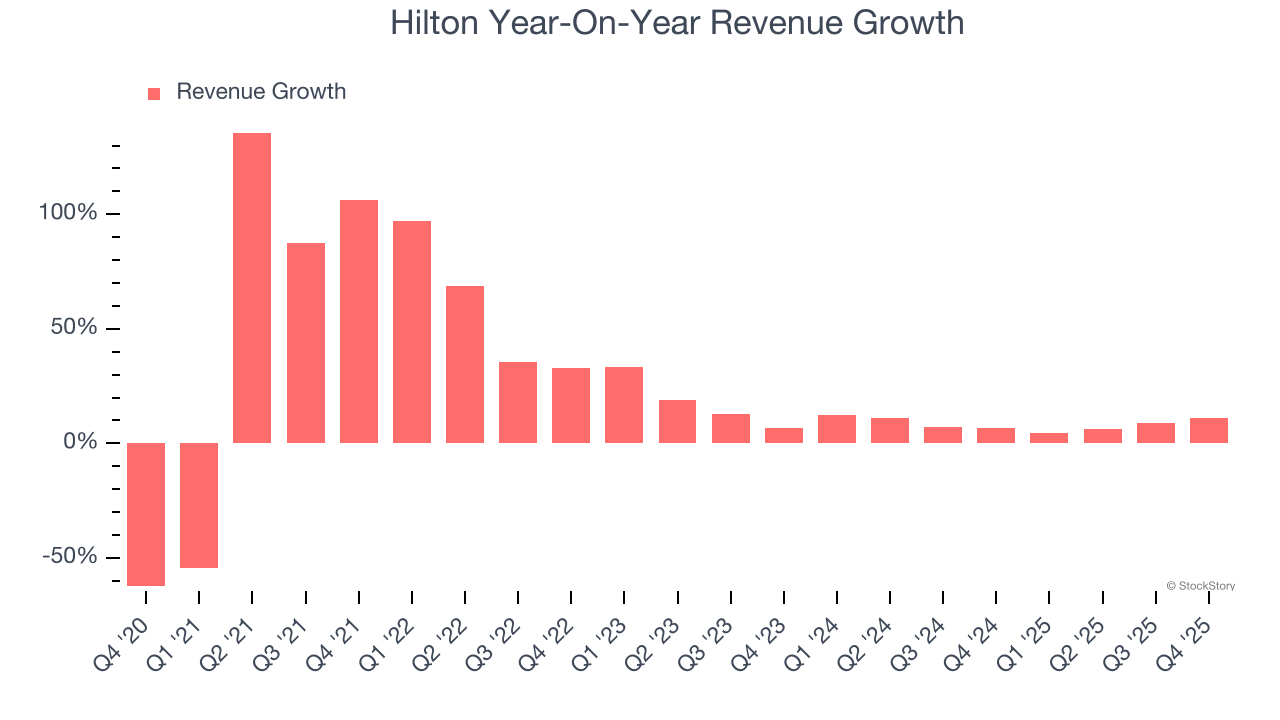
Hilton also reports revenue per available room, which clocked in at $110.89 this quarter and is a key metric accounting for daily rates and occupancy levels. Over the last two years, Hilton’s revenue per room was flat. Because this number is lower than its revenue growth, we can see its sales from other areas like restaurants, bars, and amenities outperformed its room bookings. 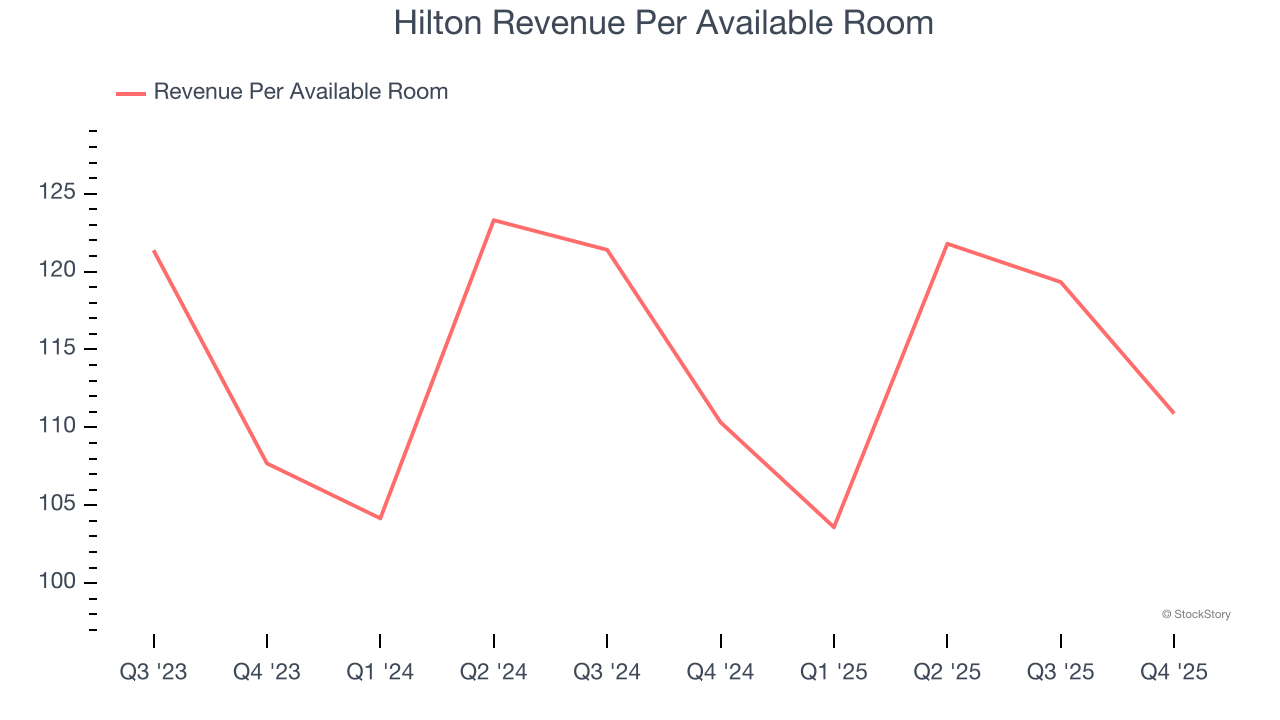
This quarter, Hilton reported year-on-year revenue growth of 10.9%, and its $3.09 billion of revenue exceeded Wall Street’s estimates by 3.3%.
Looking ahead, sell-side analysts expect revenue to grow 7.2% over the next 12 months, similar to its two-year rate. This projection doesn't excite us and indicates its products and services will face some demand challenges.
Microsoft, Alphabet, Coca-Cola, Monster Beverage—all began as under-the-radar growth stories riding a massive trend. We’ve identified the next one: a profitable AI semiconductor play Wall Street is still overlooking. Go here for access to our full report.
Operating Margin
Hilton’s operating margin has been trending up over the last 12 months and averaged 21.8% over the last two years. The company’s higher efficiency is a breath of fresh air, but its suboptimal cost structure means it still sports lousy profitability for a consumer discretionary business.
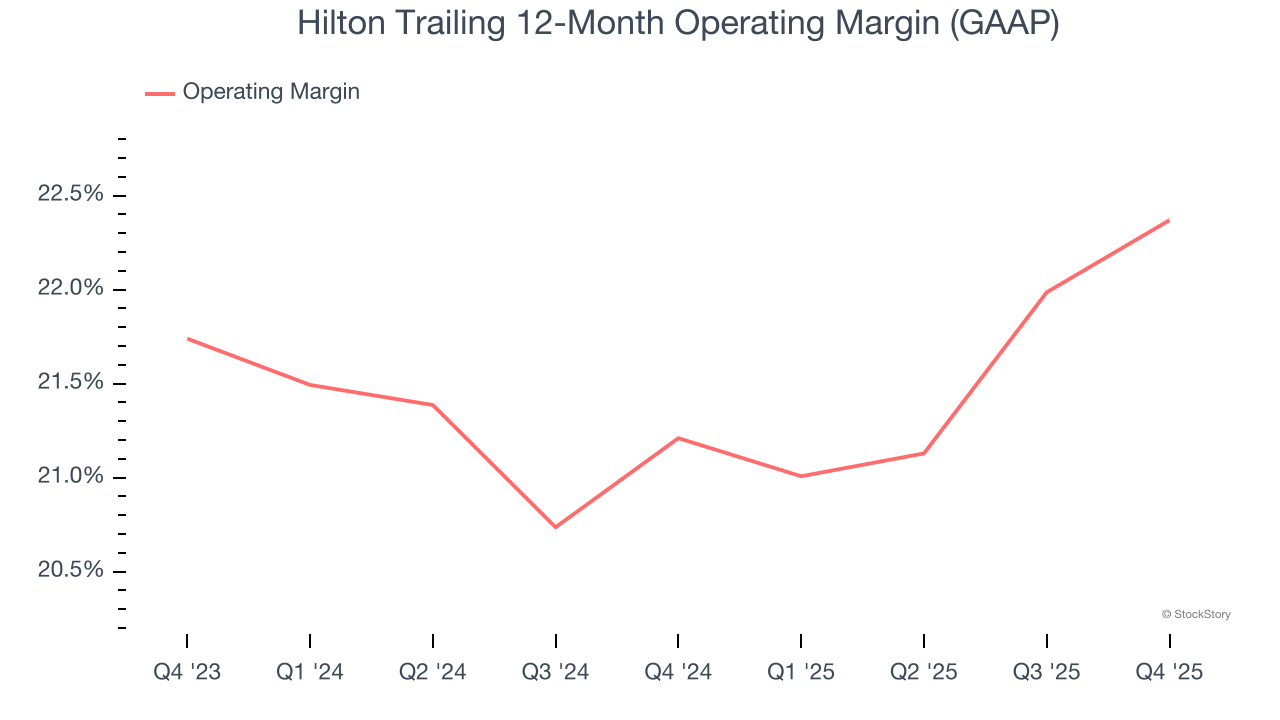
This quarter, Hilton generated an operating margin profit margin of 19.5%, up 1.9 percentage points year on year. This increase was a welcome development and shows it was more efficient.
Earnings Per Share
We track the long-term change in earnings per share (EPS) for the same reason as long-term revenue growth. Compared to revenue, however, EPS highlights whether a company’s growth is profitable.
Hilton’s EPS grew at an astounding 146% compounded annual growth rate over the last five years, higher than its 22.8% annualized revenue growth. This tells us the company became more profitable on a per-share basis as it expanded.
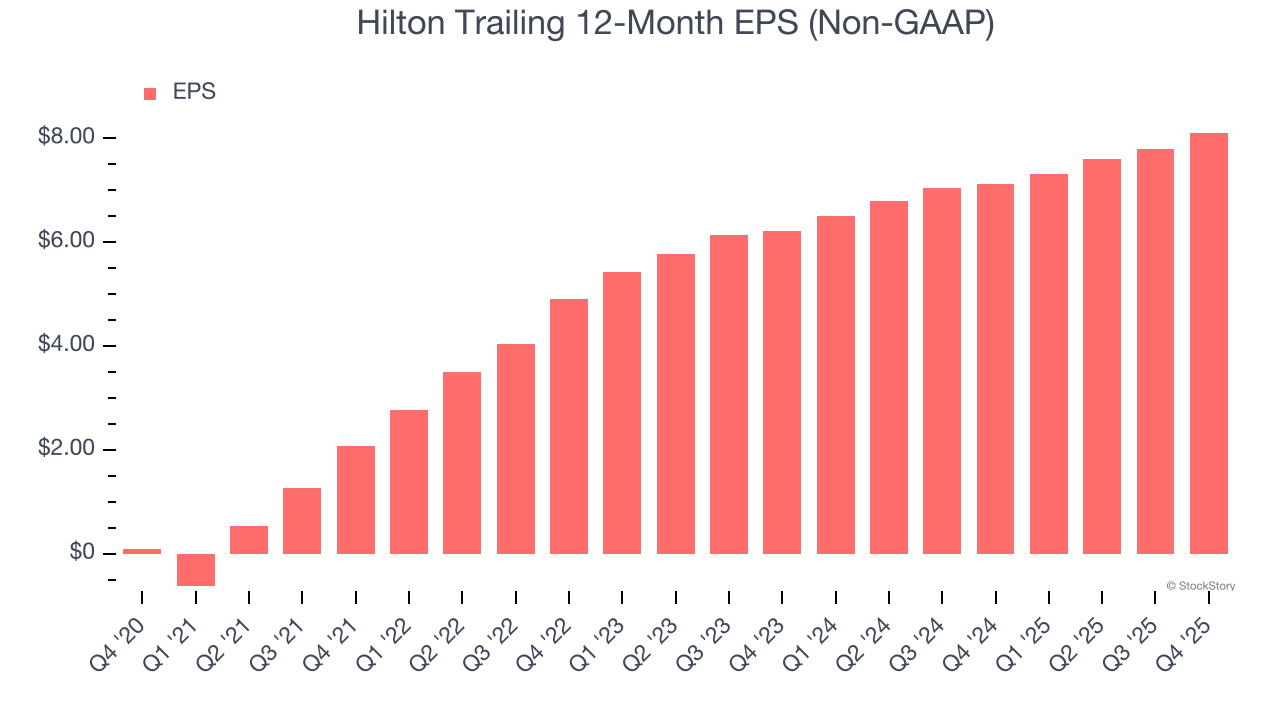
In Q4, Hilton reported adjusted EPS of $2.08, up from $1.76 in the same quarter last year. This print beat analysts’ estimates by 3.2%. Over the next 12 months, Wall Street expects Hilton’s full-year EPS of $8.11 to grow 12.7%.
Key Takeaways from Hilton’s Q4 Results
It was great to see Hilton’s revenue and EPS top analysts’ expectations. We were also happy its EBITDA guidance for next quarter outperformed Wall Street’s estimates. On the other hand, EPS guidance missed. Still , this print had some key positives. The stock remained flat at $325.71 immediately after reporting.
Hilton may have had a good quarter, but does that mean you should invest right now? We think that the latest quarter is only one piece of the longer-term business quality puzzle. Quality, when combined with valuation, can help determine if the stock is a buy. We cover that in our actionable full research report which you can read here (it’s free).