
Child care and education company Bright Horizons (NYSE: BFAM) reported Q4 CY2025 results beating Wall Street’s revenue expectations, with sales up 8.8% year on year to $733.7 million. On the other hand, the company’s full-year revenue guidance of $3.1 billion at the midpoint came in 0.8% below analysts’ estimates. Its non-GAAP profit of $1.15 per share was 2.5% above analysts’ consensus estimates.
Is now the time to buy Bright Horizons? Find out by accessing our full research report, it’s free.
Bright Horizons (BFAM) Q4 CY2025 Highlights:
- Revenue: $733.7 million vs analyst estimates of $726.3 million (8.8% year-on-year growth, 1% beat)
- Adjusted EPS: $1.15 vs analyst estimates of $1.12 (2.5% beat)
- Adjusted EBITDA: $123.5 million vs analyst estimates of $121.5 million (16.8% margin, 1.6% beat)
- Adjusted EPS guidance for the upcoming financial year 2026 is $5 at the midpoint, missing analyst estimates by 2%
- Operating Margin: 6.2%, in line with the same quarter last year
- Free Cash Flow Margin: 15.7%, up from 13.2% in the same quarter last year
- Market Capitalization: $4.61 billion
Company Overview
Founded in 1986, Bright Horizons (NYSE: BFAM) is a global provider of child care, early education, and workforce support solutions.
Revenue Growth
A company’s long-term sales performance is one signal of its overall quality. Any business can put up a good quarter or two, but many enduring ones grow for years. Over the last five years, Bright Horizons grew its sales at a 14.1% compounded annual growth rate. Though this growth is acceptable on an absolute basis, we need to see more than just topline growth for the consumer discretionary sector, which can display significant earnings volatility. This means our bar for the sector is particularly high, reflecting the non-essential and hit-driven nature of the products and services offered. Additionally, five-year CAGR starts around Covid, when revenue was depressed then rebounded.
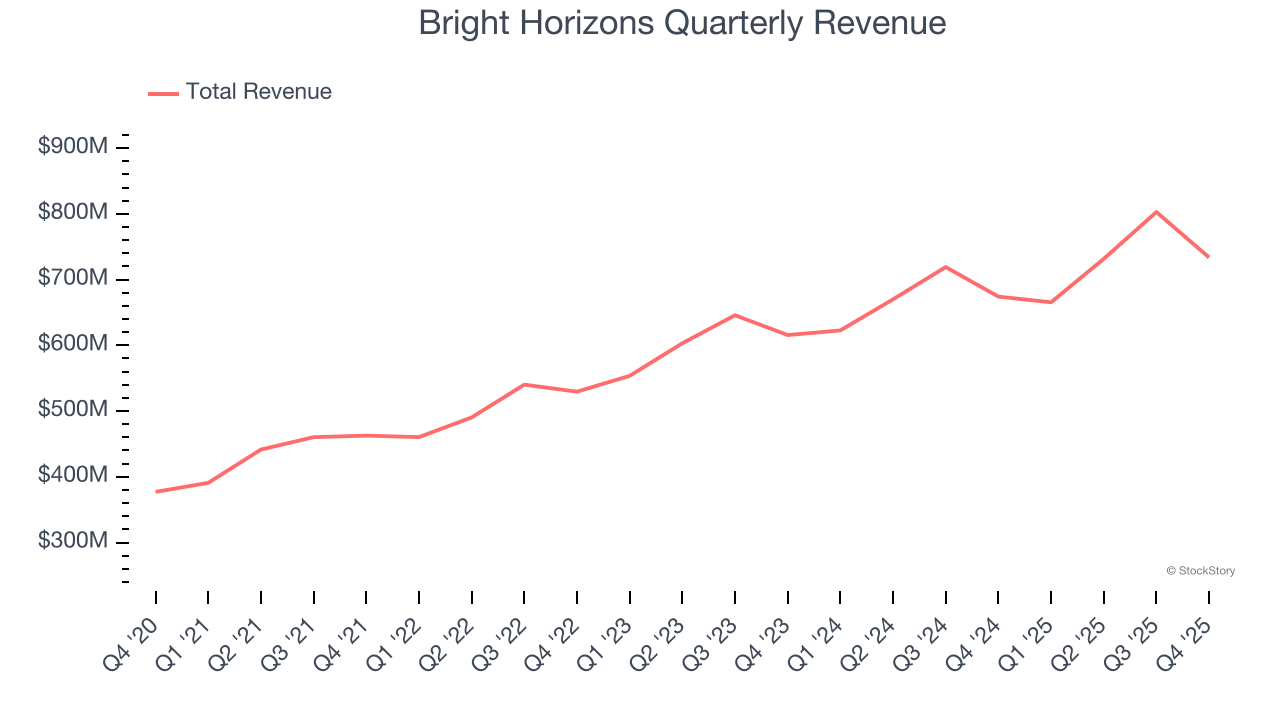
Long-term growth is the most important, but within consumer discretionary, product cycles are short and revenue can be hit-driven due to rapidly changing trends and consumer preferences. Bright Horizons’s recent performance shows its demand has slowed as its annualized revenue growth of 10.1% over the last two years was below its five-year trend. We’re wary when companies in the sector see decelerations in revenue growth, as it could signal changing consumer tastes aided by low switching costs. 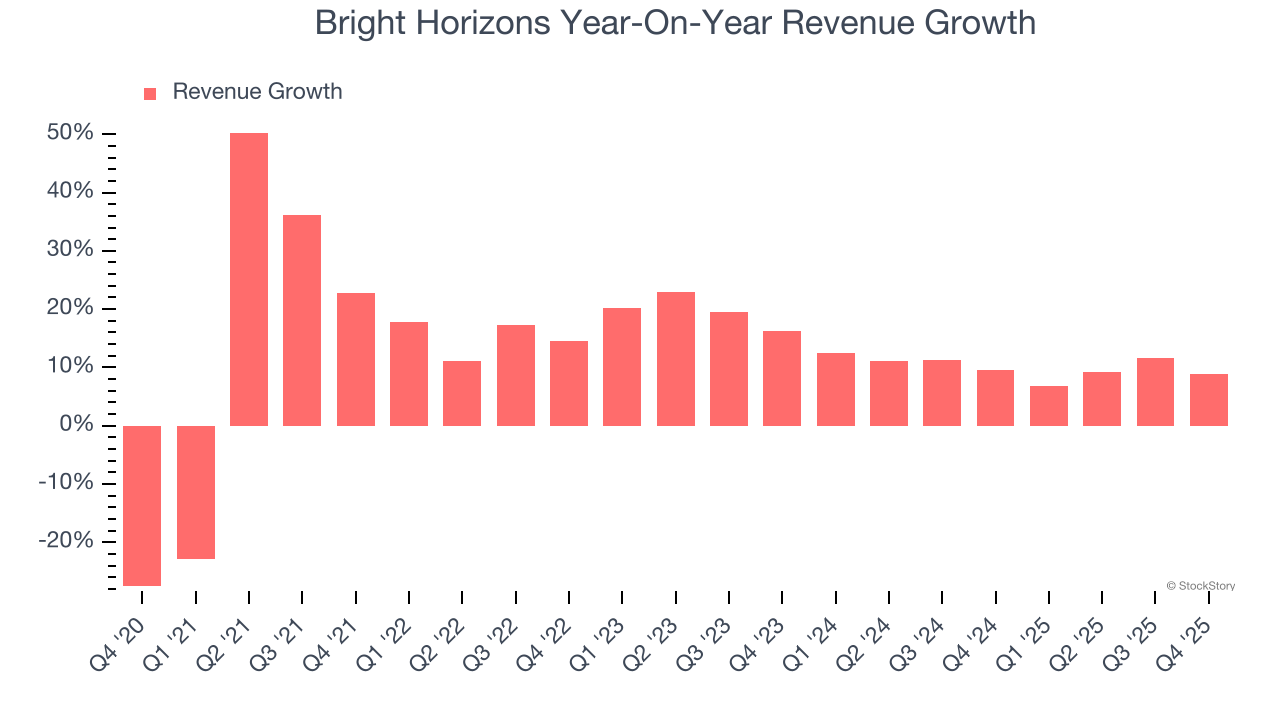
This quarter, Bright Horizons reported year-on-year revenue growth of 8.8%, and its $733.7 million of revenue exceeded Wall Street’s estimates by 1%.
Looking ahead, sell-side analysts expect revenue to grow 6.4% over the next 12 months, a deceleration versus the last two years. This projection is underwhelming and implies its products and services will see some demand headwinds.
Microsoft, Alphabet, Coca-Cola, Monster Beverage—all began as under-the-radar growth stories riding a massive trend. We’ve identified the next one: a profitable AI semiconductor play Wall Street is still overlooking. Go here for access to our full report.
Operating Margin
Operating margin is a key measure of profitability. Think of it as net income - the bottom line - excluding the impact of taxes and interest on debt, which are less connected to business fundamentals.
Bright Horizons’s operating margin has been trending up over the last 12 months and averaged 10% over the last two years. The company’s higher efficiency is a breath of fresh air, but its suboptimal cost structure means it still sports inadequate profitability for a consumer discretionary business.
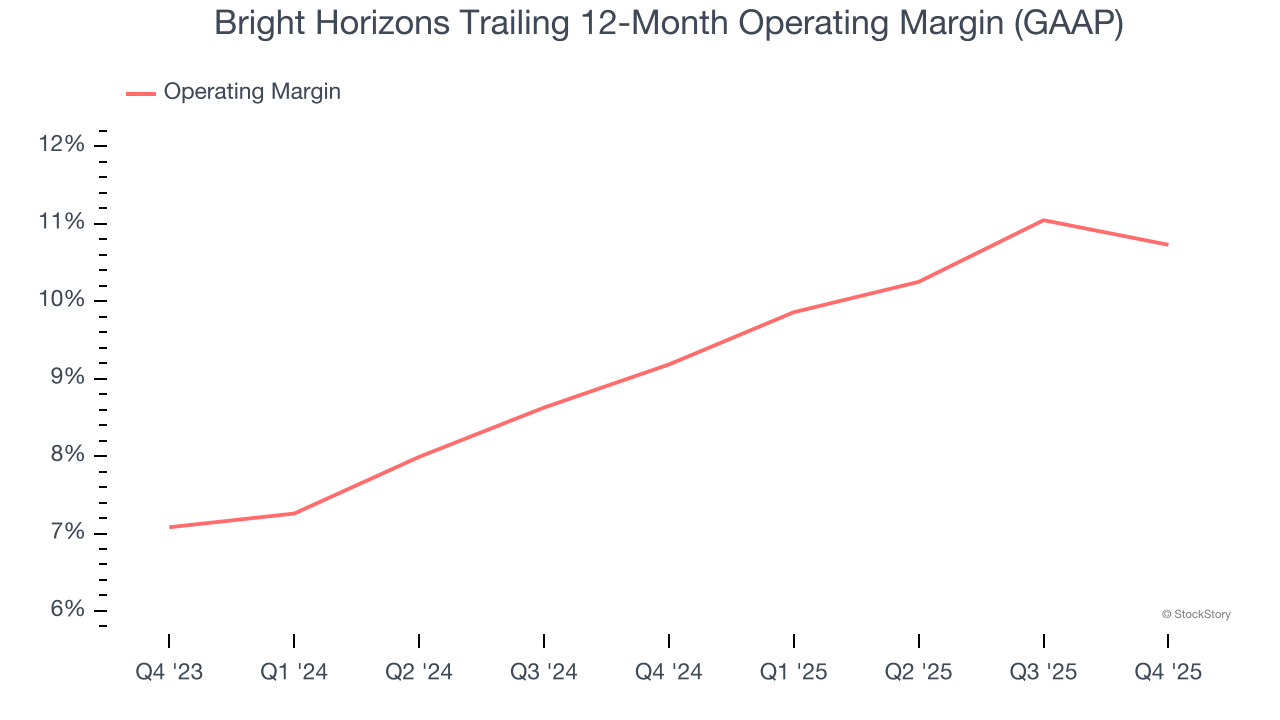
This quarter, Bright Horizons generated an operating margin profit margin of 6.2%, in line with the same quarter last year. This indicates the company’s overall cost structure has been relatively stable.
Earnings Per Share
Revenue trends explain a company’s historical growth, but the long-term change in earnings per share (EPS) points to the profitability of that growth – for example, a company could inflate its sales through excessive spending on advertising and promotions.
Bright Horizons’s EPS grew at an unimpressive 23.9% compounded annual growth rate over the last five years. On the bright side, this performance was better than its 14.1% annualized revenue growth and tells us the company became more profitable on a per-share basis as it expanded.
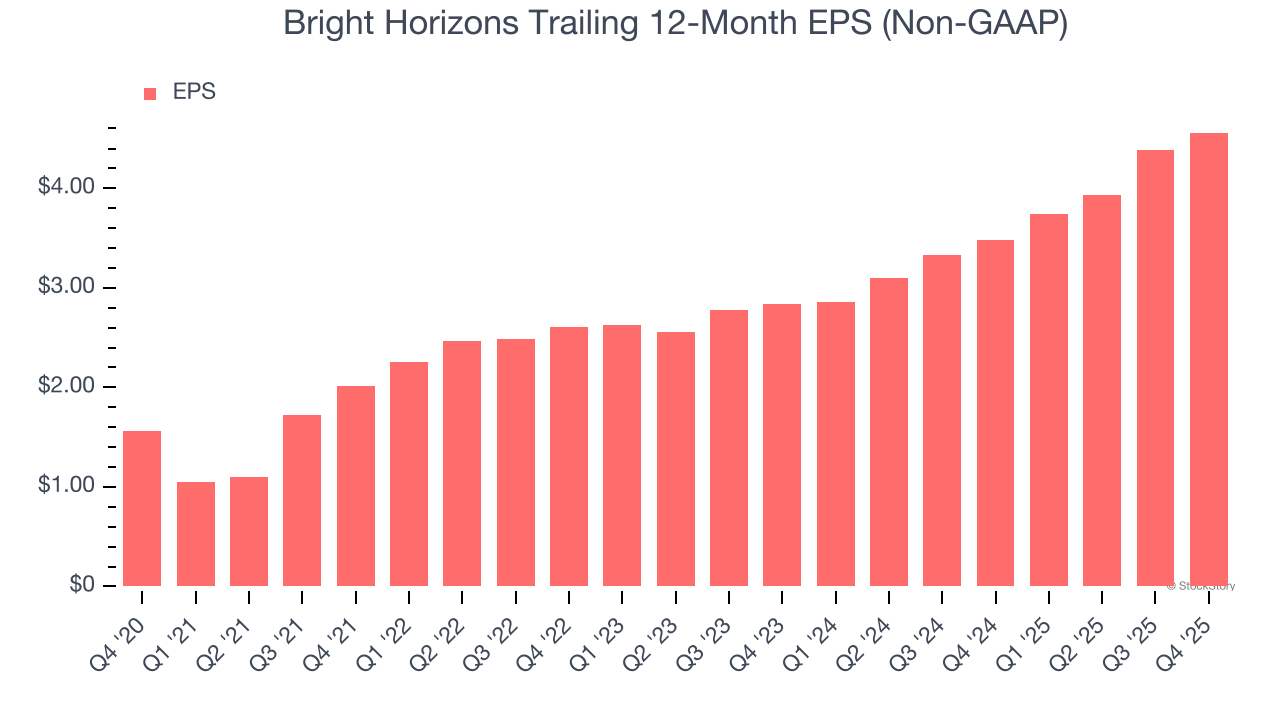
In Q4, Bright Horizons reported adjusted EPS of $1.15, up from $0.98 in the same quarter last year. This print beat analysts’ estimates by 2.5%. Over the next 12 months, Wall Street expects Bright Horizons’s full-year EPS of $4.56 to grow 11.4%.
Key Takeaways from Bright Horizons’s Q4 Results
It was good to see Bright Horizons narrowly top analysts’ revenue expectations this quarter. On the other hand, its full-year revenue guidance slightly missed and its full-year EPS guidance fell short of Wall Street’s estimates. Overall, this was a softer quarter. The stock traded down 3.5% to $79 immediately after reporting.
Should you buy the stock or not? If you’re making that decision, you should consider the bigger picture of valuation, business qualities, as well as the latest earnings. We cover that in our actionable full research report which you can read here (it’s free).


