
Credit reporting company TransUnion (NYSE: TRU) beat Wall Street’s revenue expectations in Q4 CY2025, with sales up 13% year on year to $1.17 billion. Guidance for next quarter’s revenue was better than expected at $1.2 billion at the midpoint, 0.7% above analysts’ estimates. Its non-GAAP profit of $1.07 per share was 4.3% above analysts’ consensus estimates.
Is now the time to buy TransUnion? Find out by accessing our full research report, it’s free.
TransUnion (TRU) Q4 CY2025 Highlights:
- Revenue: $1.17 billion vs analyst estimates of $1.13 billion (13% year-on-year growth, 3.3% beat)
- Adjusted EPS: $1.07 vs analyst estimates of $1.03 (4.3% beat)
- Adjusted EBITDA: $416.7 million vs analyst estimates of $404.1 million (35.6% margin, 3.1% beat)
- Revenue Guidance for Q1 CY2026 is $1.2 billion at the midpoint, roughly in line with what analysts were expecting
- Adjusted EPS guidance for the upcoming financial year 2026 is $4.67 at the midpoint, missing analyst estimates by 3.9%
- EBITDA guidance for the upcoming financial year 2026 is $1.77 billion at the midpoint, below analyst estimates of $1.80 billion
- Operating Margin: 17.4%, in line with the same quarter last year
- Free Cash Flow Margin: 19%, up from 13.2% in the same quarter last year
- Market Capitalization: $13.94 billion
“TransUnion finished the year strongly with results that again exceeded financial guidance,” said Chris Cartwright, President and CEO.
Company Overview
One of the three major credit bureaus in the United States alongside Equifax and Experian, TransUnion (NYSE: TRU) is a global information and insights company that provides credit reports, fraud prevention tools, and data analytics to help businesses make decisions and consumers manage their financial health.
Revenue Growth
Examining a company’s long-term performance can provide clues about its quality. Any business can put up a good quarter or two, but many enduring ones grow for years.
With $4.58 billion in revenue over the past 12 months, TransUnion is one of the larger companies in the business services industry and benefits from a well-known brand that influences purchasing decisions.
As you can see below, TransUnion’s sales grew at an impressive 11% compounded annual growth rate over the last five years. This shows it had high demand, a useful starting point for our analysis.
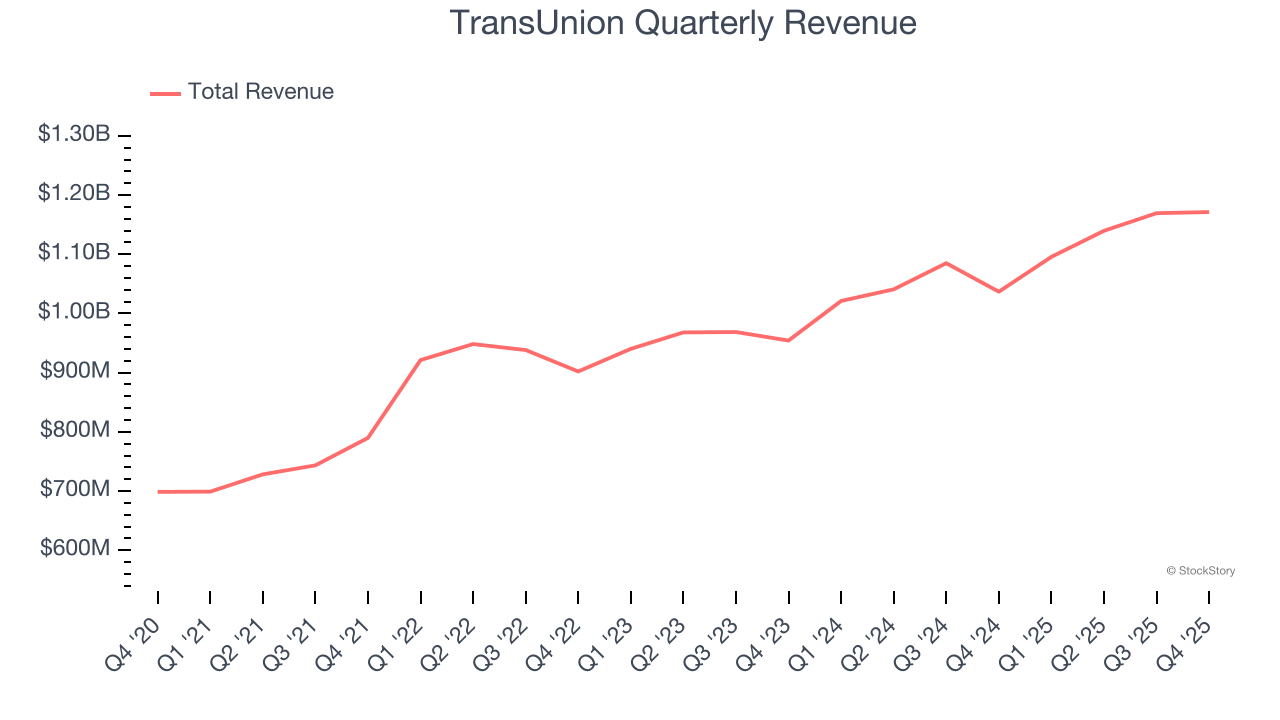
We at StockStory place the most emphasis on long-term growth, but within business services, a half-decade historical view may miss recent innovations or disruptive industry trends. TransUnion’s annualized revenue growth of 9.3% over the last two years is below its five-year trend, but we still think the results suggest healthy demand. 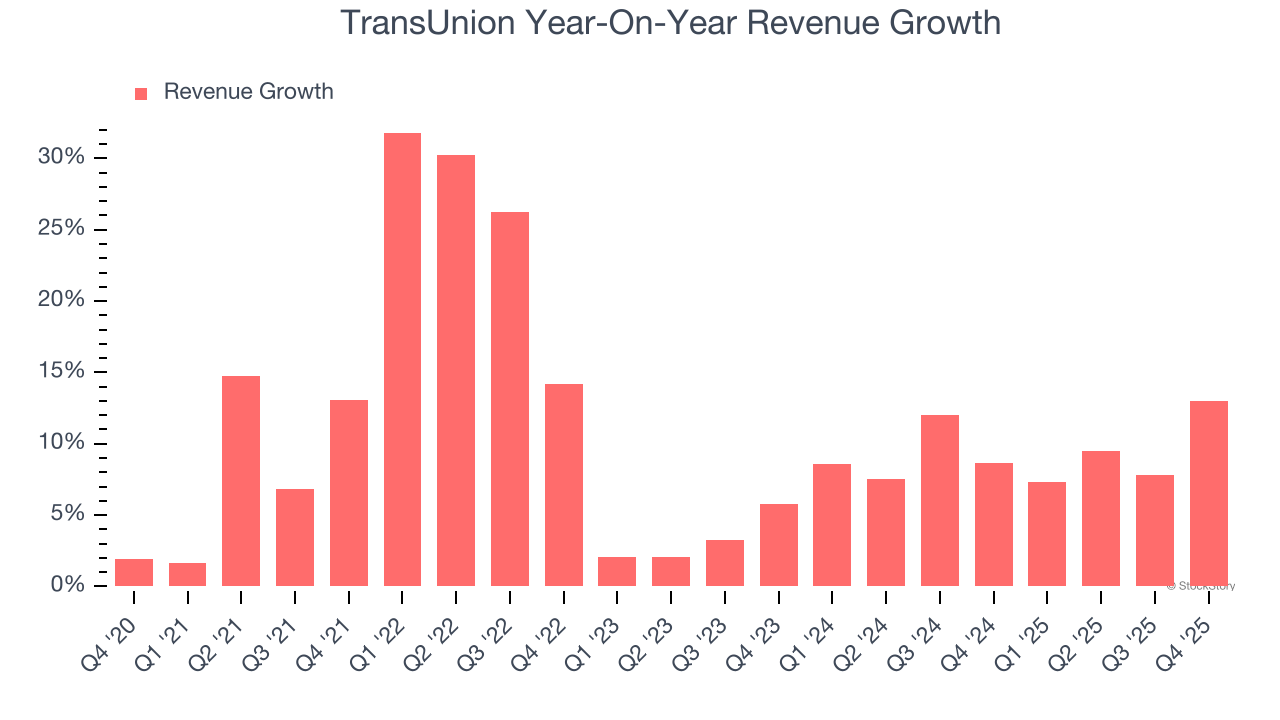
This quarter, TransUnion reported year-on-year revenue growth of 13%, and its $1.17 billion of revenue exceeded Wall Street’s estimates by 3.3%. Company management is currently guiding for a 9.5% year-on-year increase in sales next quarter.
Looking further ahead, sell-side analysts expect revenue to grow 7.4% over the next 12 months, a slight deceleration versus the last two years. Still, this projection is commendable and indicates the market sees success for its products and services.
Microsoft, Alphabet, Coca-Cola, Monster Beverage—all began as under-the-radar growth stories riding a massive trend. We’ve identified the next one: a profitable AI semiconductor play Wall Street is still overlooking. Go here for access to our full report.
Operating Margin
Operating margin is a key measure of profitability. Think of it as net income - the bottom line - excluding the impact of taxes and interest on debt, which are less connected to business fundamentals.
TransUnion has been an efficient company over the last five years. It was one of the more profitable businesses in the business services sector, boasting an average operating margin of 15.2%.
Looking at the trend in its profitability, TransUnion’s operating margin decreased by 3.1 percentage points over the last five years. This raises questions about the company’s expense base because its revenue growth should have given it leverage on its fixed costs, resulting in better economies of scale and profitability.
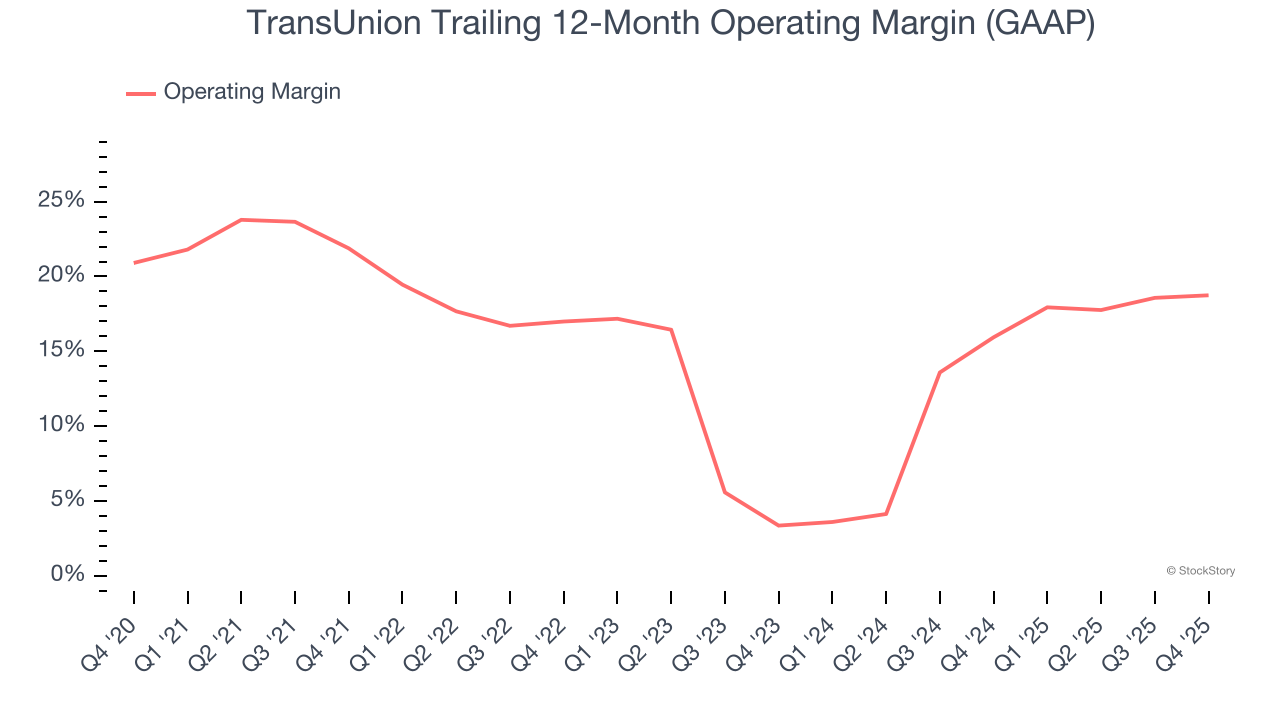
In Q4, TransUnion generated an operating margin profit margin of 17.4%, in line with the same quarter last year. This indicates the company’s overall cost structure has been relatively stable.
Earnings Per Share
Revenue trends explain a company’s historical growth, but the long-term change in earnings per share (EPS) points to the profitability of that growth – for example, a company could inflate its sales through excessive spending on advertising and promotions.
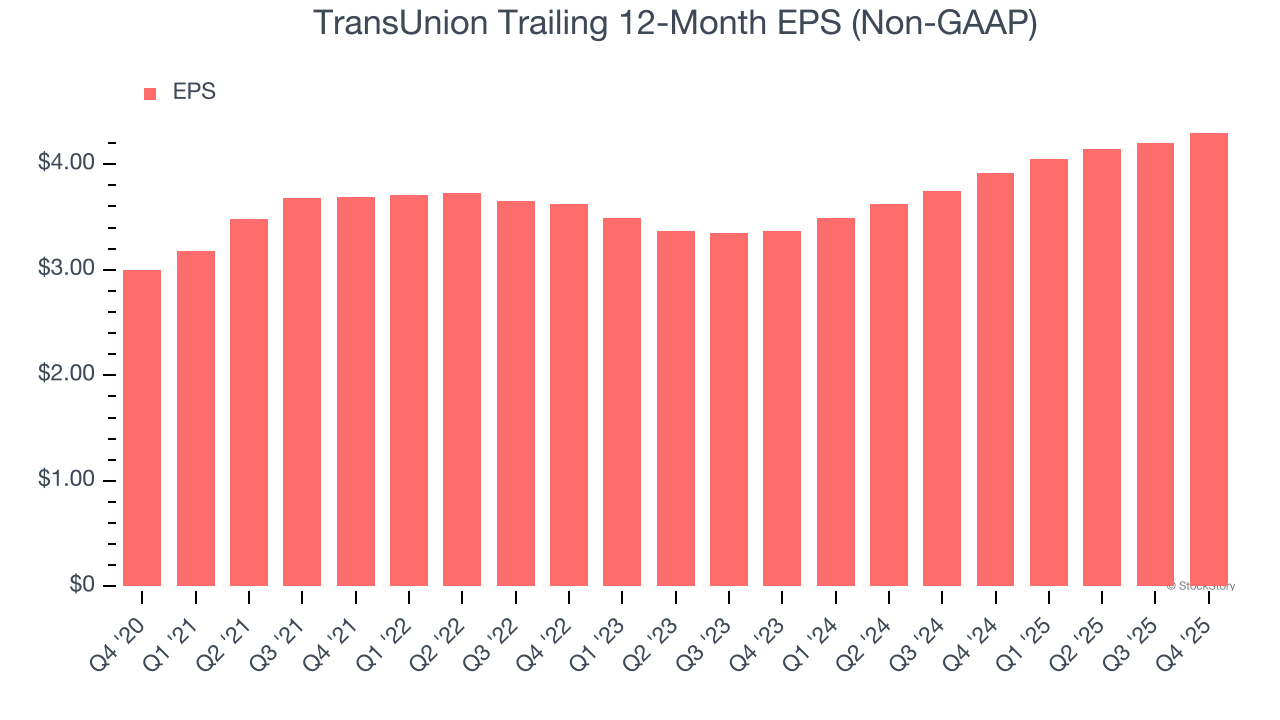
TransUnion’s EPS grew at an unimpressive 7.5% compounded annual growth rate over the last five years, lower than its 11% annualized revenue growth. This tells us the company became less profitable on a per-share basis as it expanded due to non-fundamental factors such as interest expenses and taxes.
We can take a deeper look into TransUnion’s earnings to better understand the drivers of its performance. As we mentioned earlier, TransUnion’s operating margin was flat this quarter but declined by 3.1 percentage points over the last five years. This was the most relevant factor (aside from the revenue impact) behind its lower earnings; interest expenses and taxes can also affect EPS but don’t tell us as much about a company’s fundamentals.
Like with revenue, we analyze EPS over a shorter period to see if we are missing a change in the business.
For TransUnion, its two-year annual EPS growth of 13% was higher than its five-year trend. This acceleration made it one of the faster-growing business services companies in recent history.
In Q4, TransUnion reported adjusted EPS of $1.07, up from $0.97 in the same quarter last year. This print beat analysts’ estimates by 4.3%. Over the next 12 months, Wall Street expects TransUnion’s full-year EPS of $4.30 to grow 12.4%.
Key Takeaways from TransUnion’s Q4 Results
We enjoyed seeing TransUnion beat analysts’ revenue expectations this quarter. We were also glad its EPS outperformed Wall Street’s estimates. On the other hand, its full-year EPS guidance missed and its EPS guidance for next quarter fell short of Wall Street’s estimates. Overall, this was a weaker quarter. The stock remained flat at $71.68 immediately after reporting.
So should you invest in TransUnion right now? When making that decision, it’s important to consider its valuation, business qualities, as well as what has happened in the latest quarter. We cover that in our actionable full research report which you can read here (it’s free).