Commercial vehicle retailer Rush Enterprises (NASDAQ: RUSH.A) missed Wall Street’s revenue expectations in Q1 CY2026, with sales falling 9% year on year to $1.68 billion. Its GAAP profit of $0.77 per share was 11.2% above analysts’ consensus estimates.
Is now the time to buy Rush Enterprises? Find out by accessing our full research report, it’s free.
Rush Enterprises (RUSHA) Q1 CY2026 Highlights:
- Revenue: $1.68 billion vs analyst estimates of $1.73 billion (9% year-on-year decline, 2.5% miss)
- EPS (GAAP): $0.77 vs analyst estimates of $0.69 (11.2% beat)
- Operating Margin: 4.9%, in line with the same quarter last year
- Market Capitalization: $6.01 billion
“Despite continued weakness across the commercial vehicle industry, I am proud of the way our team performed in the first quarter,” said W.M. “Rusty” Rush, Chairman, Chief Executive Officer and President of Rush Enterprises, Inc.
Company Overview
Headquartered in Texas, Rush Enterprises (NASDAQ: RUSH.A) provides truck-related services and solutions, including sales, leasing, parts, and maintenance for commercial vehicles.
Revenue Growth
A company’s long-term sales performance can indicate its overall quality. Any business can have short-term success, but a top-tier one grows for years. Luckily, Rush Enterprises’s sales grew at a solid 9.2% compounded annual growth rate over the last five years. Its growth beat the average industrials company and shows its offerings resonate with customers.
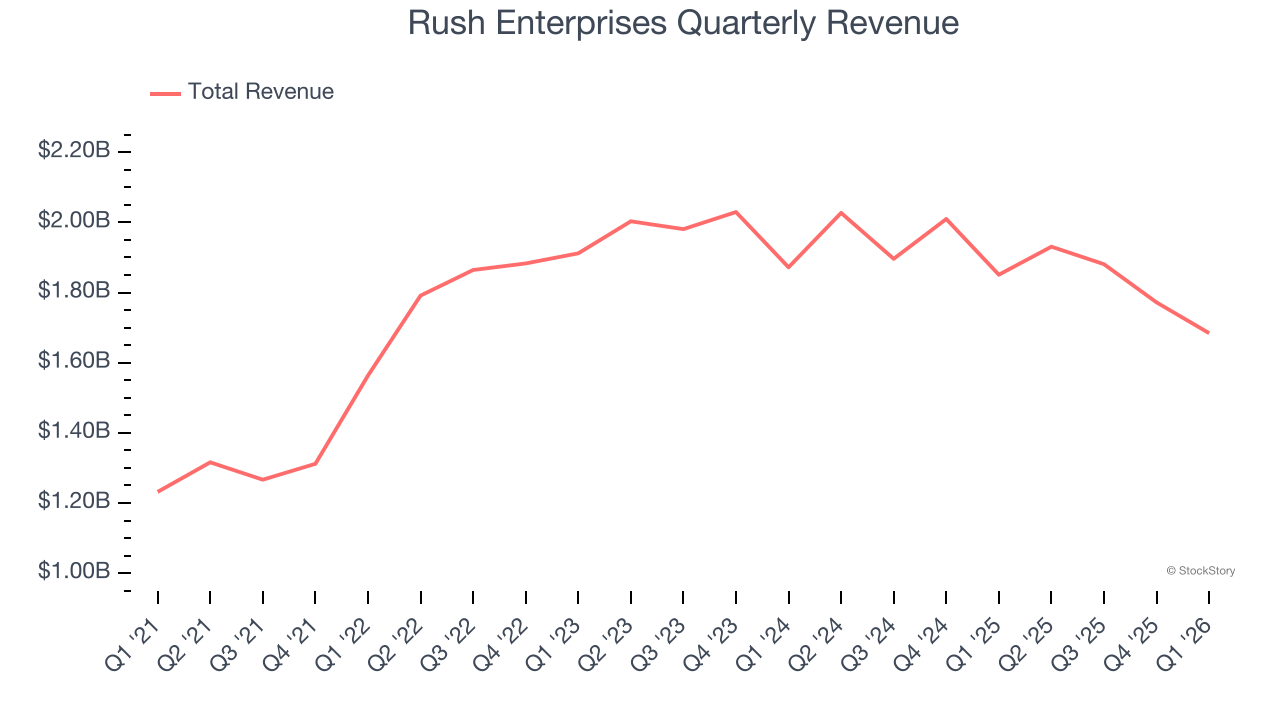
Long-term growth is the most important, but within industrials, a half-decade historical view may miss new industry trends or demand cycles. Rush Enterprises’s recent performance marks a sharp pivot from its five-year trend as its revenue has shown annualized declines of 4% over the last two years. 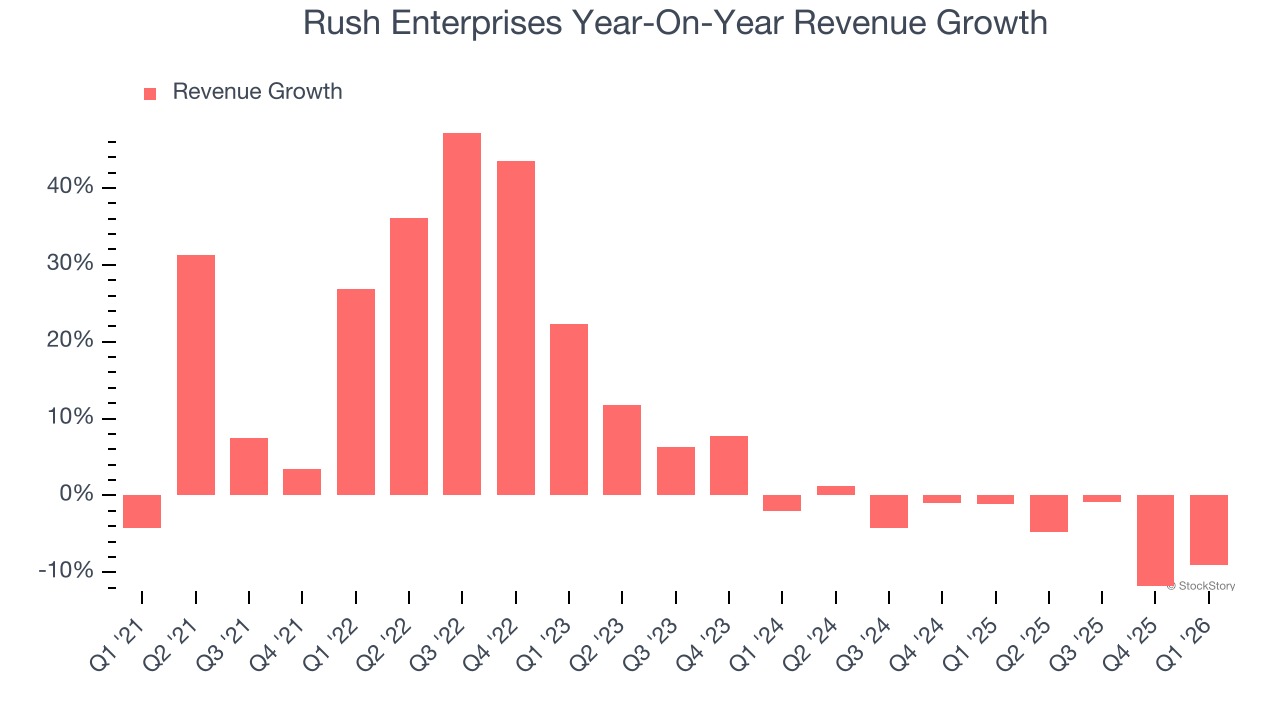
We can dig further into the company’s revenue dynamics by analyzing its most important segments, Vehicles and Aftermarket, which are 32.7% and 16% of revenue. Over the last two years, Rush Enterprises’s Vehicles revenue (new and used commercial trucks) averaged 27.4% year-on-year declines while its Aftermarket revenue (parts and services) averaged 24.3% declines. 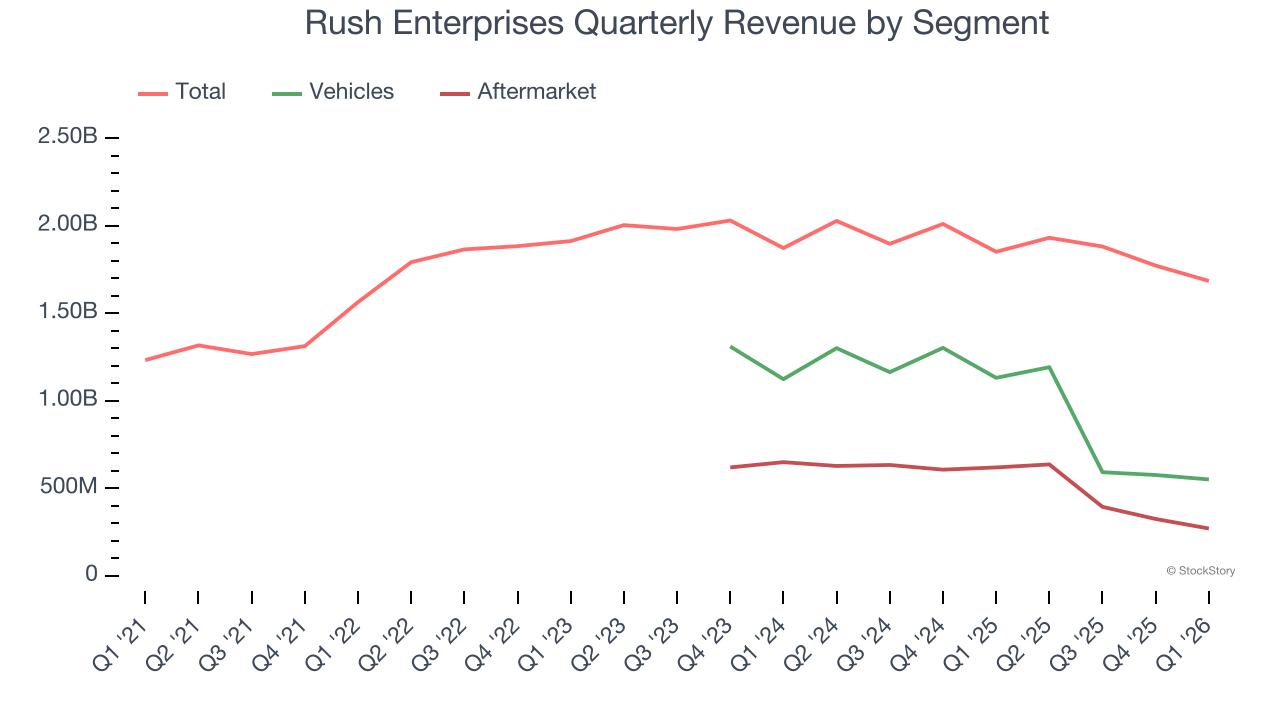
This quarter, Rush Enterprises missed Wall Street’s estimates and reported a rather uninspiring 9% year-on-year revenue decline, generating $1.68 billion of revenue.
Looking ahead, sell-side analysts expect revenue to grow 9.9% over the next 12 months, an improvement versus the last two years. This projection is commendable and implies its newer products and services will catalyze better top-line performance.
ONE MORE THING: The $21 AI Application Stock Wall Street Forgot. While Wall Street obsesses over who’s building AI, one company is already using it to print money. And nobody’s paying attention.
AI chip stocks trade at ridiculous valuations. This company processes a trillion consumer signals monthly using AI and trades at a third of the price. The gap won’t last. The institutions will figure it out. You need to see this first. Read the FREE Report Before They Notice.
Operating Margin
Operating margin is an important measure of profitability as it shows the portion of revenue left after accounting for all core expenses – everything from the cost of goods sold to advertising and wages. It’s also useful for comparing profitability across companies with different levels of debt and tax rates because it excludes interest and taxes.
Rush Enterprises was profitable over the last five years but held back by its large cost base. Its average operating margin of 6.2% was weak for an industrials business. This result isn’t too surprising given its low gross margin as a starting point.
Looking at the trend in its profitability, Rush Enterprises’s operating margin decreased by 1.3 percentage points over the last five years. This raises questions about the company’s expense base because its revenue growth should have given it leverage on its fixed costs, resulting in better economies of scale and profitability. Rush Enterprises’s performance was poor no matter how you look at it - it shows that costs were rising and it couldn’t pass them onto its customers.
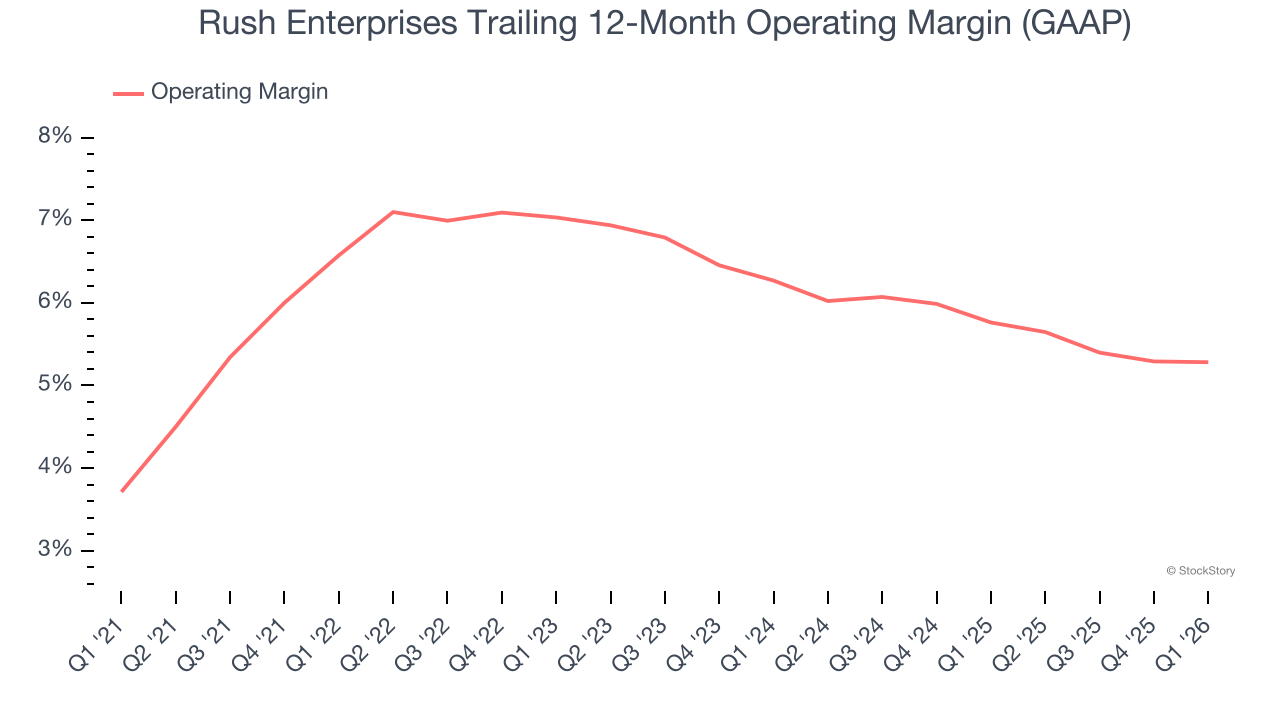
In Q1, Rush Enterprises generated an operating margin profit margin of 4.9%, in line with the same quarter last year. This indicates the company’s cost structure has recently been stable.
Earnings Per Share
Revenue trends explain a company’s historical growth, but the long-term change in earnings per share (EPS) points to the profitability of that growth – for example, a company could inflate its sales through excessive spending on advertising and promotions.
Rush Enterprises’s EPS grew at 15.5% compounded annual growth rate over the last five years, higher than its 9.2% annualized revenue growth. However, this alone doesn’t tell us much about its business quality because its operating margin didn’t improve.
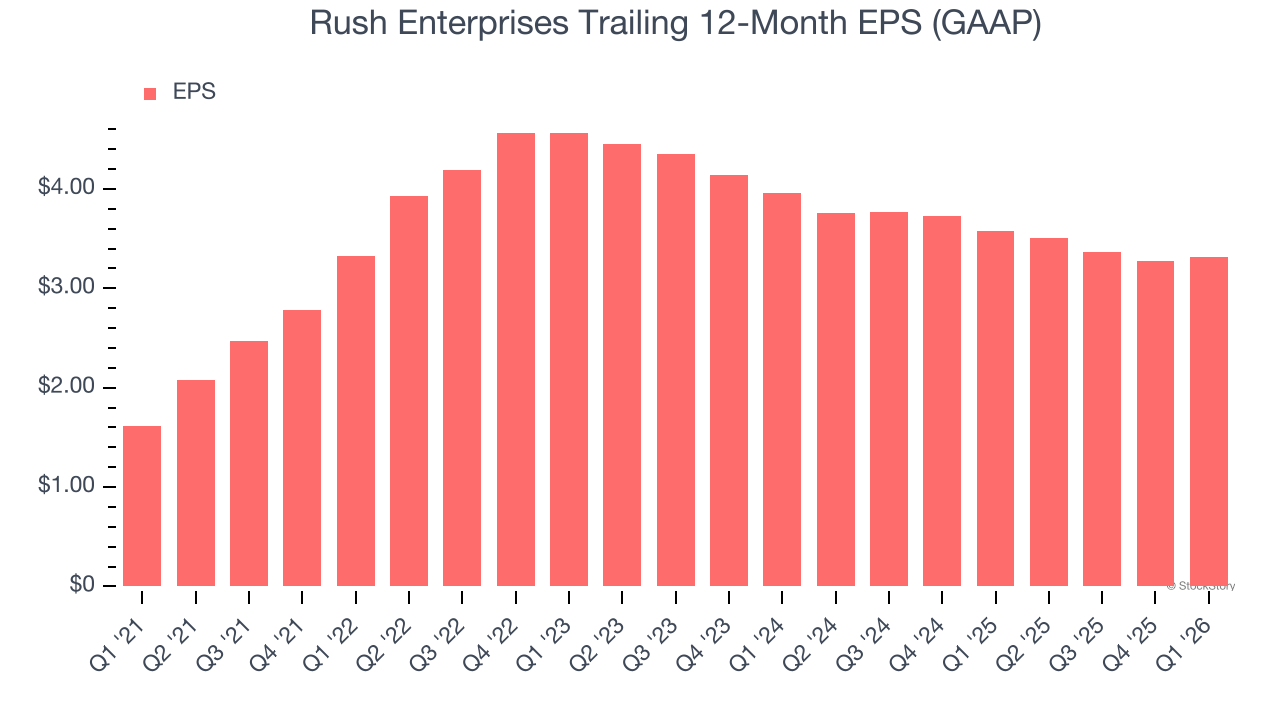
Diving into Rush Enterprises’s quality of earnings can give us a better understanding of its performance. A five-year view shows that Rush Enterprises has repurchased its stock, shrinking its share count by 7.8%. This tells us its EPS outperformed its revenue not because of increased operational efficiency but financial engineering, as buybacks boost per share earnings. 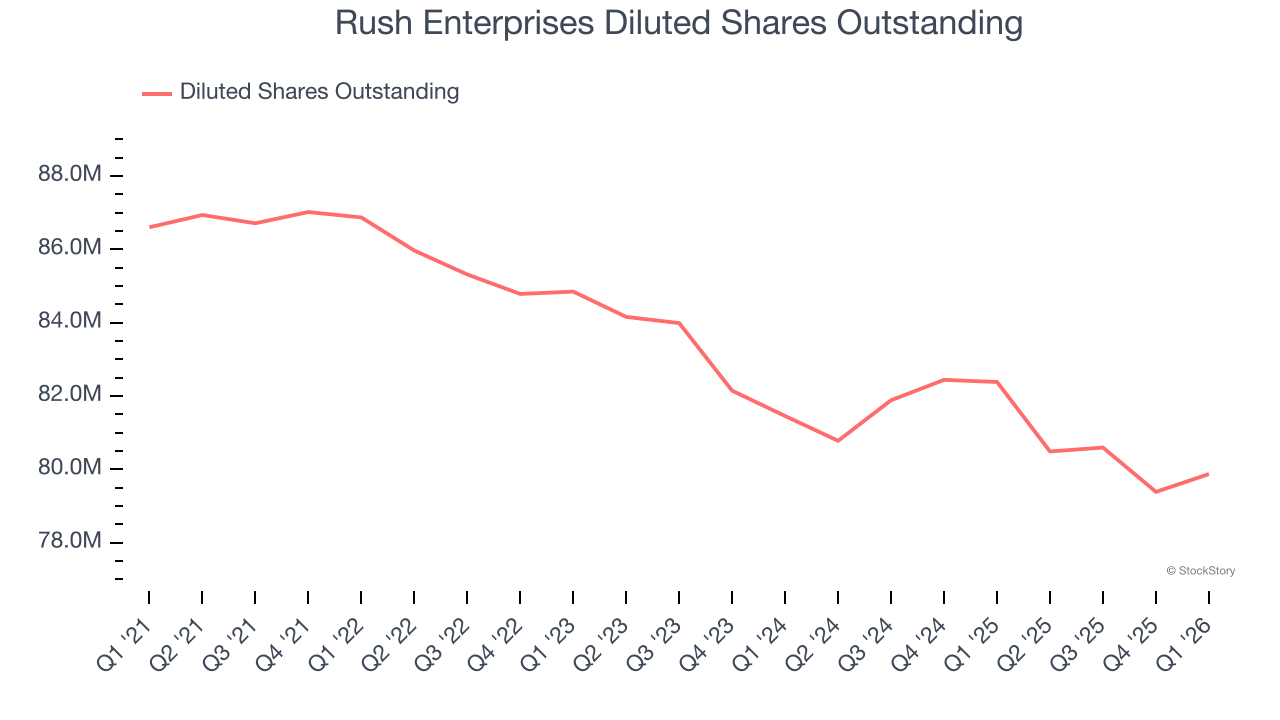
Like with revenue, we analyze EPS over a more recent period because it can provide insight into an emerging theme or development for the business.
For Rush Enterprises, its two-year annual EPS declines of 8.5% mark a reversal from its (seemingly) healthy five-year trend. We hope Rush Enterprises can return to earnings growth in the future.
In Q1, Rush Enterprises reported EPS of $0.77, up from $0.73 in the same quarter last year. This print easily cleared analysts’ estimates, and shareholders should be content with the results. Over the next 12 months, Wall Street expects Rush Enterprises’s full-year EPS of $3.31 to grow 15.3%.
Key Takeaways from Rush Enterprises’s Q1 Results
It was good to see Rush Enterprises beat analysts’ EPS expectations this quarter. On the other hand, its revenue missed. Overall, this was a mixed quarter. The stock remained flat at $75.30 immediately after reporting.
Is Rush Enterprises an attractive investment opportunity right now? We think that the latest quarter is only one piece of the longer-term business quality puzzle. Quality, when combined with valuation, can help determine if the stock is a buy. We cover that in our actionable full research report which you can read here (it’s free).