
Subsea energy systems provider TechnipFMC (NYSE: FTI) fell short of the market’s revenue expectations in Q1 CY2026, but sales rose 11.6% year on year to $2.49 billion. Its non-GAAP profit of $0.64 per share was 14.3% above analysts’ consensus estimates.
Is now the time to buy TechnipFMC? Find out by accessing our full research report, it’s free.
TechnipFMC (FTI) Q1 CY2026 Highlights:
- Revenue: $2.49 billion vs analyst estimates of $2.52 billion (11.6% year-on-year growth, 1% miss)
- Adjusted EPS: $0.64 vs analyst estimates of $0.56 (14.3% beat)
- Adjusted EBITDA: $466 million vs analyst estimates of $443.8 million (18.7% margin, 5% beat)
- Operating Margin: 15.5%, up from 10.8% in the same quarter last year
- Free Cash Flow Margin: 11.1%, down from 17% in the same quarter last year
- Market Capitalization: $30.79 billion
Company Overview
Operating a fleet of 16 specialized vessels that install equipment on the seafloor, TechnipFMC (NYSE: FTI) designs and manufactures subsea systems that control the flow of oil and natural gas from the ocean floor to processing facilities.
Revenue Growth
A company’s long-term performance can give signals about its business quality. Even a bad business, especially in a cyclical industry, can shine for a year or so, but a top-tier one should exhibit resilience through cycles. TechnipFMC struggled to consistently generate demand over the last five years as its sales dropped at a 2.5% annual rate. This wasn’t a great result and is a sign of lacking business quality.
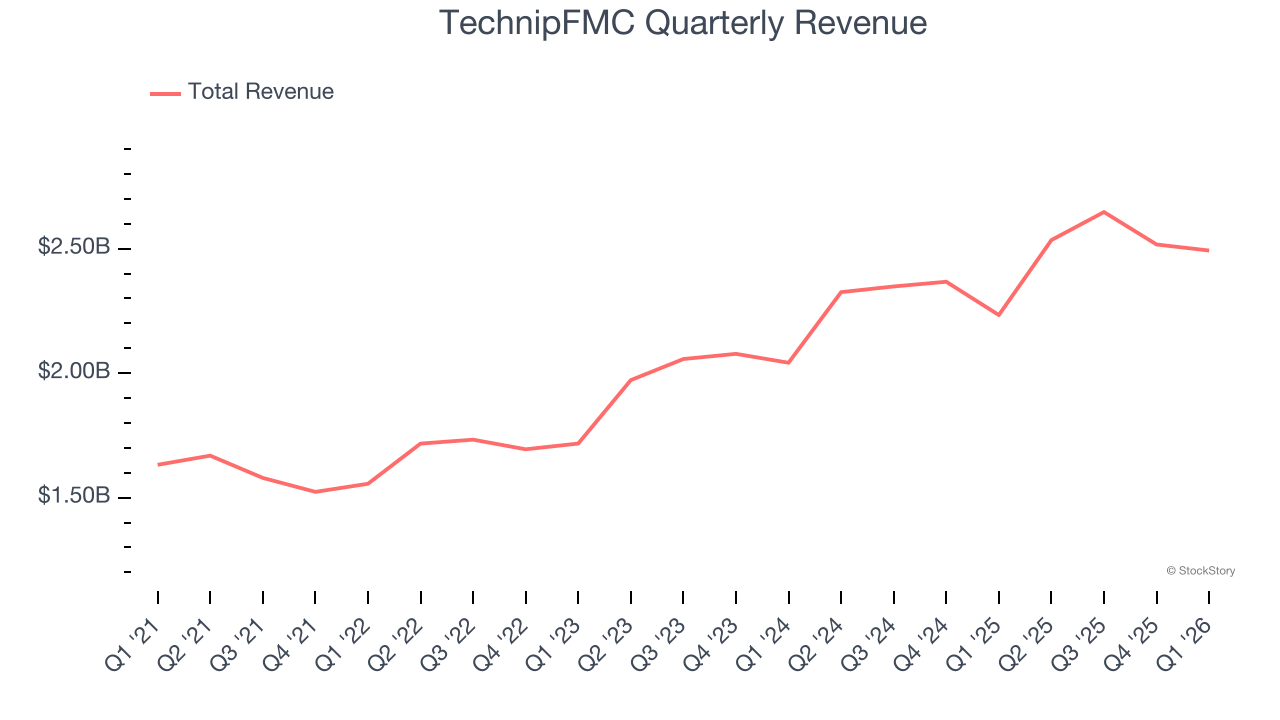
Within Energy, a singular timeframe, even if it’s quite long-term, only sheds light on how well a company rode the last commodity cycle. To better assess whether a company compounds through cycles, we validate our view with an even longer, ten-year view. TechnipFMC’s annualized revenue growth of 0.5% over the last ten years is above its five-year trend, suggesting some bright spots.
This quarter, TechnipFMC’s revenue grew by 11.6% year on year to $2.49 billion but fell short of Wall Street’s estimates.
WHILE YOU’RE HERE: The Next Palantir? One satellite company captures images of every point on Earth. Every single day. The Pentagon wants it. Hedge funds are using it to beat earnings. You’ve probably never heard of it.
This is what the early days of Palantir looked like before it became a $437 billion giant. Same playbook. Different technology. If you missed Palantir, you need to see this. Claim The Stock Ticker for Free HERE.
Adjusted EBITDA Margin
Adjusted EBITDA margin is an important measure of profitability for the sector and accounts for the gross margins and operating costs mentioned previously. Unlike operating margin, it is not distorted by accounting conventions around reserves, drilling costs, and assumptions on commodity consumption from the well or basin. Adjusted EBITDA highlights the economic reality of how much cash the rock produces before the capital structure (debt service) and the drilling budget (capex) are considered.
TechnipFMC was profitable over the last five years but held back by its large cost base. Its average EBITDA margin of 13.5% was among the worst in the energy upstream and integrated energy sector.
On the plus side, TechnipFMC’s EBITDA margin rose by 10.1 percentage points over the last year.
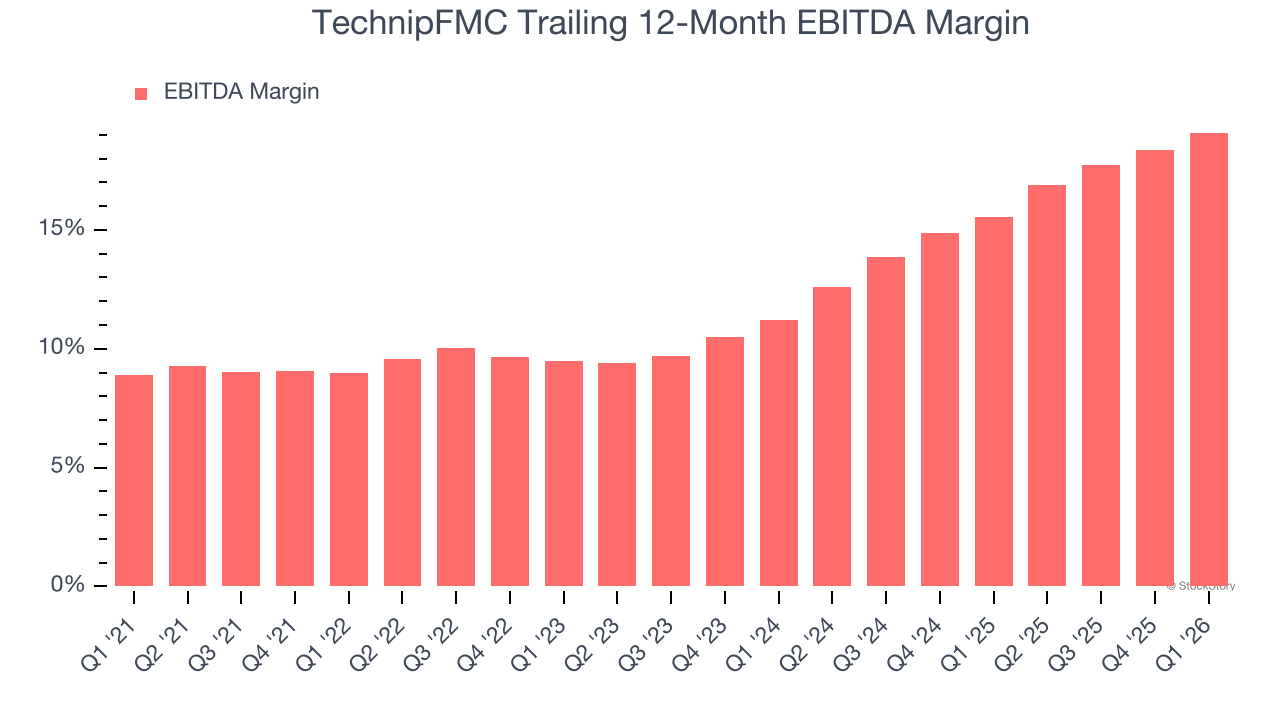
In Q1, TechnipFMC generated an EBITDA margin profit margin of 18.7%, up 3.3 percentage points year on year. This increase was a welcome development and shows it was more efficient. This adjusted EBITDA beat Wall Street’s estimates by 5%.
Cash Is King
Adjusted EBITDA shows how profitable a company’s existing wells are before financing and reinvestment decisions, but free cash flow shows how much value remains after paying the cost of replacing those wells. In upstream energy, production naturally declines over time, so companies must continuously reinvest just to stand still. A producer can report strong EBITDA margins yet generate little or no free cash flow if its wells decline quickly or if new drilling is expensive. Free cash flow therefore captures not only how efficiently a company produces hydrocarbons today, but also how costly it is to sustain that production into the future.
TechnipFMC has shown decent cash profitability, giving it some flexibility to reinvest or return capital to investors. The company’s free cash flow margin averaged 8.5% over the last five years, slightly better than the broader energy upstream and integrated energy sector.
While the level of free cash flow margins is important, their consistency matters just as much.
TechnipFMC’s ratio of quarterly free cash flow volatility to WTI crude price volatility over the past five years was 11.3 (lower is better), indicating that its cash generation is far more sensitive to commodity-price swings than most peers. This elevated volatility limits its access to capital in downturns and makes it unlikely to act as a consolidator when weaker competitors come under pressure.
You may be asking why we wait until the free cash flow line to perform this stability analysis versus commodity prices. Why not compare revenue or EBITDA to WTI in the case of TechnipFMC? Because what ultimately matters is not how much revenue or profit you earn when prices are high but how much cash you can generate when prices are low. Free cash flow is the superior metric because it includes everything from hedging prowess to growth and maintenance capex to management behavior during good times and bad.
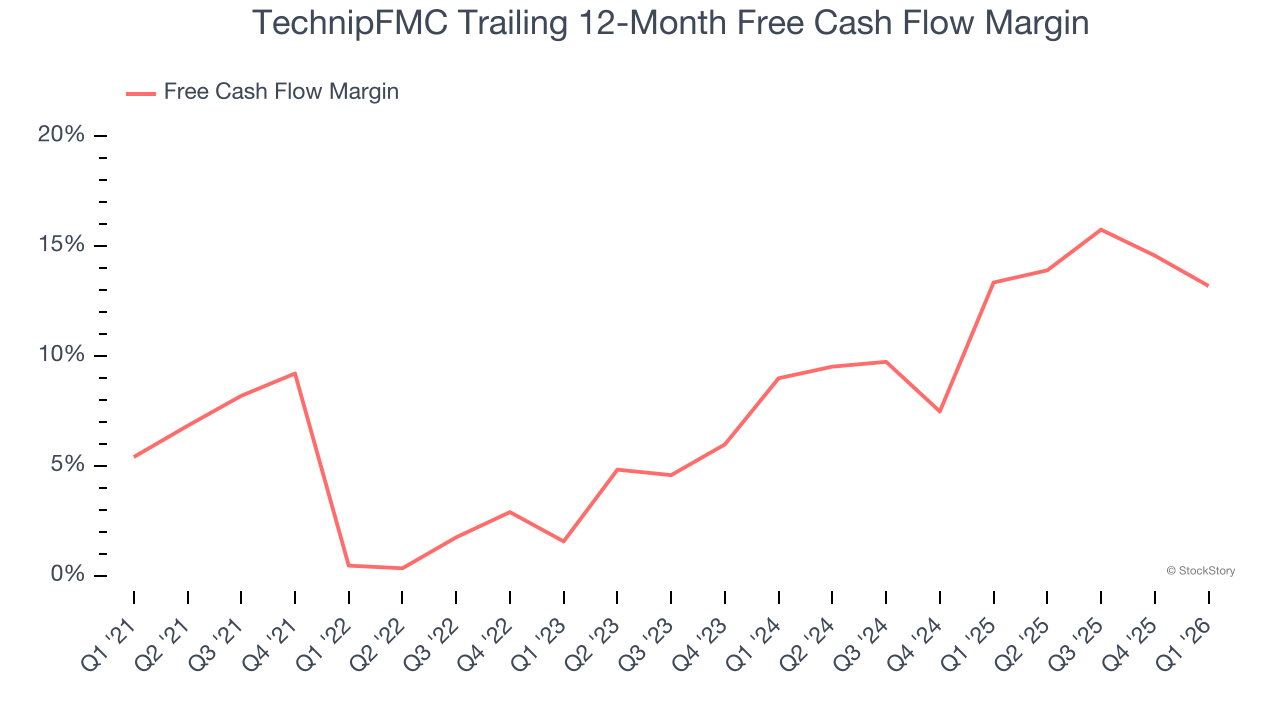
TechnipFMC’s free cash flow clocked in at $276.9 million in Q1, equivalent to a 11.1% margin. The company’s cash profitability regressed as it was 5.9 percentage points lower than in the same quarter last year, but it’s still above its five-year average. We wouldn’t put too much weight on this quarter’s decline because investment needs can be seasonal, causing short-term swings. Long-term trends carry greater meaning.
Key Takeaways from TechnipFMC’s Q1 Results
It was good to see TechnipFMC beat analysts’ EPS expectations this quarter. We were also happy its EBITDA outperformed Wall Street’s estimates. On the other hand, its revenue slightly missed. Overall, this print had some key positives. The stock remained flat at $77.11 immediately following the results.
TechnipFMC may have had a good quarter, but does that mean you should invest right now? The latest quarter does matter, but not nearly as much as longer-term fundamentals and valuation, when deciding if the stock is a buy. We cover that in our actionable full research report which you can read here (it’s free).


