
U.S. stock markets seem to be reaching new all-time highs on a weekly basis. The NASDAQ 100 index can best be traded and followed using the most active exchange-traded-fund (ETF), the Invesco QQQ (NASDAQ: QQQ). The computer and technology sector companies dominate the QQQ. While the markets are trending upward, a rising tide doesn't necessarily lift all boats. Critics argue that a handful of companies dominate the market, impacting benchmark indexes disproportionately. Investors' burning question remains: "Where does it go from here?" Let’s examine the QQQ to explore potential moves.
What is the QQQ Index?
The QQQ tracks the movement of the Nasdaq-100 index, which is comprised of the 100 largest non-financial companies listed on the Nasdaq exchange. This modified weighted index is based on market capitalization (market cap). This means the more a stock is valued based on its market cap (calculated by price x outstanding shares), the more it will impact the value of the index.
The index may be rebalanced quarterly or annually when the weighting is too concentrated. Technically, when the aggregate weight of its stocks with weightings over 4.8% exceeds the 48% threshold, the Nasdaq may conduct a special rebalancing like it did on July 24, 2023.
The Dominance of Top 3 Holdings in the QQQ Index
However, as of June 7, 2024, the top three holdings, including Microsoft Co. (NASDAQ: MSFT) with 8.47%, NVIDIA Co. (NASDAQ: NVDA) with 8.12%, and Apple Inc. (NASDAQ: AAPL) with 8.08% allocation make up nearly 25% of the total index. This is not an isolated issue just to the Nasdaq 100. In fact, the top three holdings in the S&P 500 index are Microsoft at 7.06%, Apple at 5.71%, and NVIDIA with 4.66% allocation for a total of nearly 16% of the index.
How Nvidia Moves the Markets
The artificial intelligence (AI) boom has surged Nvidia shares into the stratosphere, growing its market cap to nearly $3 trillion. In fact, on most days, if NVDA stock is surging, there's a good chance that the markets are rising. It's not just the rising value of NVDA stock but also the domino effect of leader stocks pulling up the laggard stocks. It only makes sense that investors and traders want to jump into the “next” stock that will move in sympathy.
For example, Nvidia's rise tends to rally NASDAQ: AMD">semiconductor and AI stocks like Applied Micro Devices Inc. (NASDAQ: AMD) and Super Micro Computer Inc. (NASDAQ: SMCI). Anticipation of the 10-for-1 stock split occurring on June 10, 2024, drove up shares, which impacted the rise in the QQQ to record highs.
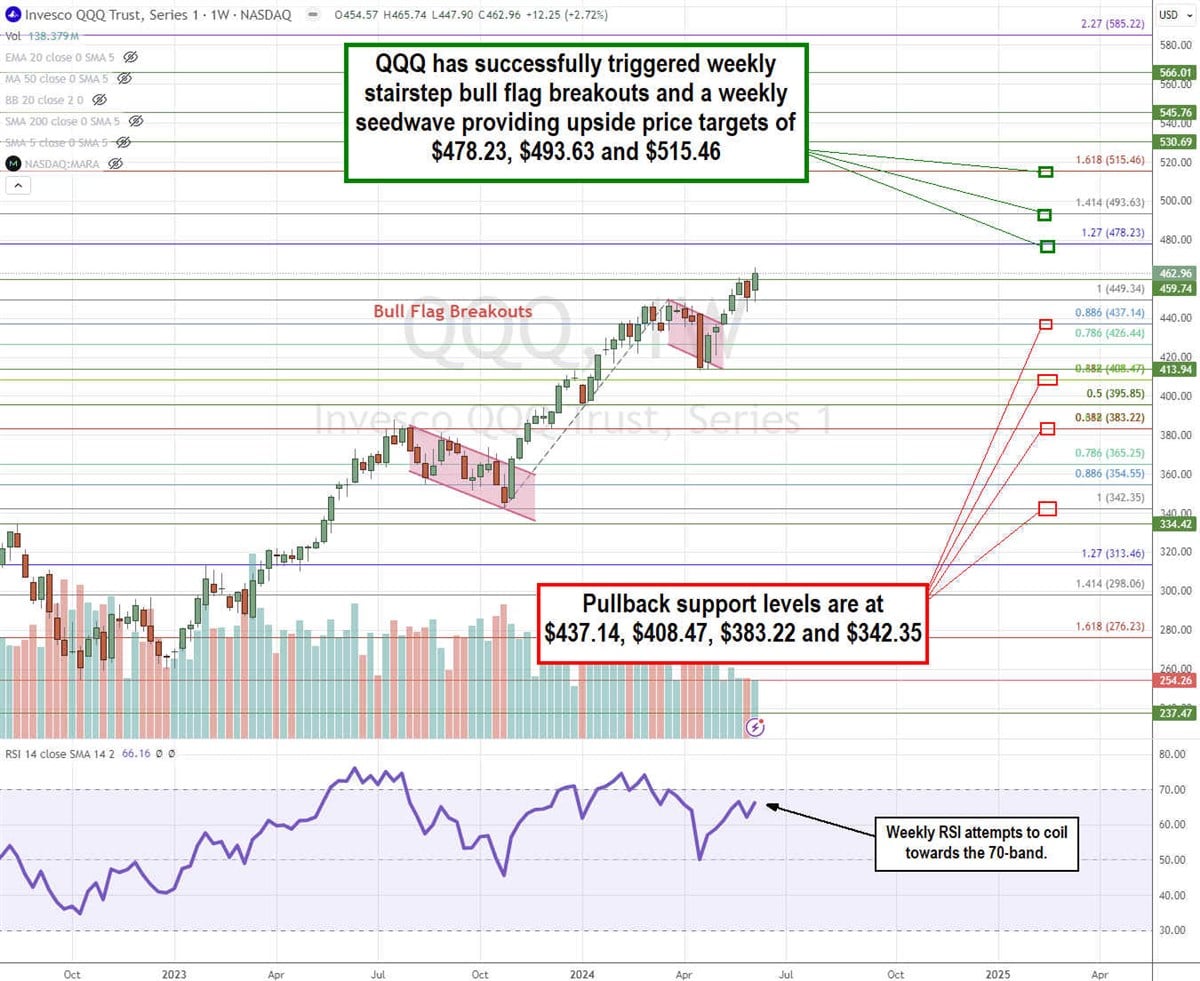
QQQ Generating Stairstep Bull Flag Breakouts
The weekly candlestick chart on the QQQ illustrates stairstep or back-to-back bull flag breakout patterns. To calculate supports, we applied Fibonacci (fib) retracement and extension levels based on the sequentially higher market structure lows (MSLs), providing an upside target based on the seed wave breakout formation.
The fib plots were made at $342.35 on the MSL and $449.39 on the market structure high (MSH). This results in upside targets based on the fib extensions of 1.27, 1.414, and 1.618 potential reversal zones (PRZ). Upside targets are $478.22, $493.63, and $515.46. Each of these levels has the potential for the price to reverse for a pullback or even reverse the uptrend.
The weekly relative strength index (RSI) is coiling again towards the overbought 70-band level. Key fib pullback support levels are at $437.14 (0.886 fib retracement), $408.47 (0.618/0.382 fib ratios), $383.22, and $342.35 swing low.