
Electrical safety company Atkore (NYSE: ATKR) reported Q3 CY2025 results topping the market’s revenue expectations, but sales fell by 4.6% year on year to $752 million. Its non-GAAP profit of $0.69 per share was 45.1% below analysts’ consensus estimates.
Is now the time to buy Atkore? Find out by accessing our full research report, it’s free for active Edge members.
Atkore (ATKR) Q3 CY2025 Highlights:
- Revenue: $752 million vs analyst estimates of $734 million (4.6% year-on-year decline, 2.5% beat)
- Adjusted EPS: $0.69 vs analyst expectations of $1.26 (45.1% miss)
- Adjusted EBITDA: $70.92 million vs analyst estimates of $83.7 million (9.4% margin, 15.3% miss)
- Adjusted EPS guidance for the upcoming financial year 2026 is $5.30 at the midpoint, missing analyst estimates by 2%
- EBITDA guidance for the upcoming financial year 2026 is $350 million at the midpoint, above analyst estimates of $347 million
- Operating Margin: -7.5%, down from 12.9% in the same quarter last year
- Free Cash Flow Margin: 25%, up from 19.6% in the same quarter last year
- Market Capitalization: $2.24 billion
“Atkore achieved Net Sales of $2.9 billion in fiscal 2025 and grew organic volume for the third consecutive year,” said Bill Waltz, Atkore President and Chief Executive Officer.
Company Overview
Protecting the things that power our world, Atkore (NYSE: ATKR) designs and manufactures electrical safety products.
Revenue Growth
Reviewing a company’s long-term sales performance reveals insights into its quality. Even a bad business can shine for one or two quarters, but a top-tier one grows for years. Luckily, Atkore’s sales grew at a solid 10.1% compounded annual growth rate over the last five years. Its growth beat the average industrials company and shows its offerings resonate with customers.
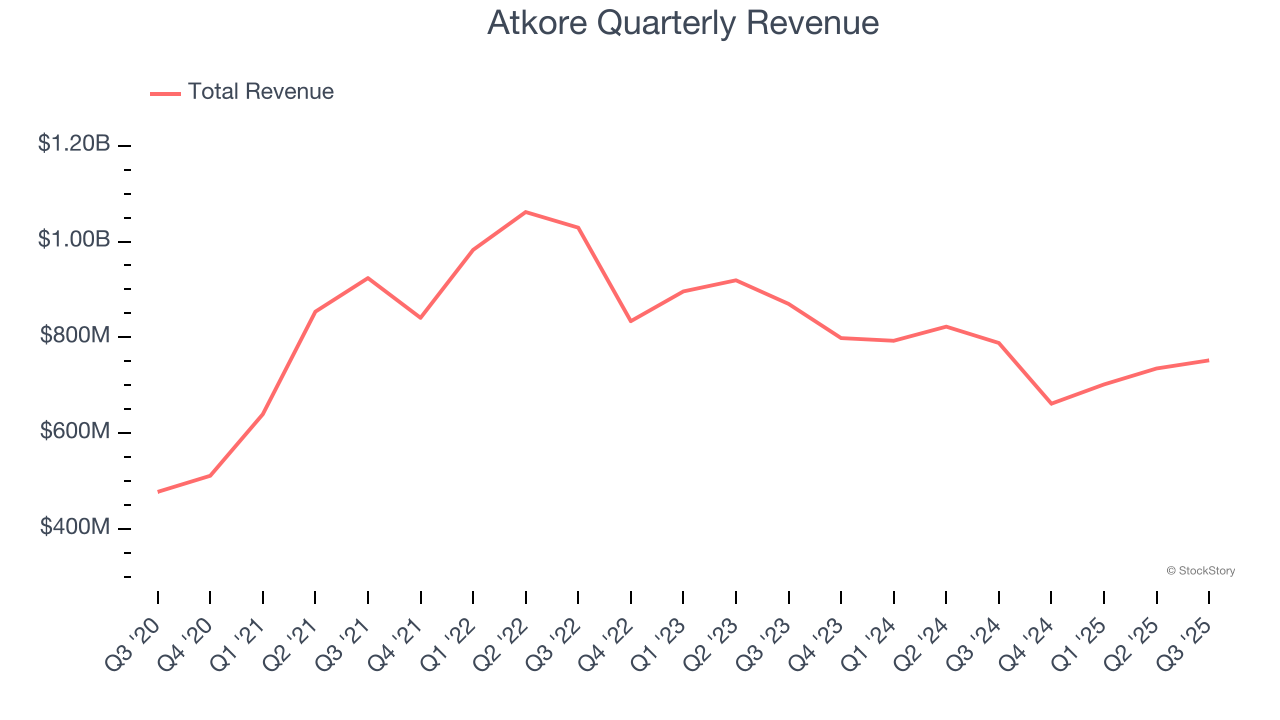
Long-term growth is the most important, but within industrials, a half-decade historical view may miss new industry trends or demand cycles. Atkore’s recent performance marks a sharp pivot from its five-year trend as its revenue has shown annualized declines of 10% over the last two years. 
This quarter, Atkore’s revenue fell by 4.6% year on year to $752 million but beat Wall Street’s estimates by 2.5%.
Looking ahead, sell-side analysts expect revenue to decline by 1.3% over the next 12 months. Although this projection is better than its two-year trend, it’s hard to get excited about a company that is struggling with demand.
The 1999 book Gorilla Game predicted Microsoft and Apple would dominate tech before it happened. Its thesis? Identify the platform winners early. Today, enterprise software companies embedding generative AI are becoming the new gorillas. a profitable, fast-growing enterprise software stock that is already riding the automation wave and looking to catch the generative AI next.
Operating Margin
Atkore has been a well-oiled machine over the last five years. It demonstrated elite profitability for an industrials business, boasting an average operating margin of 21.8%. This result isn’t too surprising as its gross margin gives it a favorable starting point.
Looking at the trend in its profitability, Atkore’s operating margin decreased by 26.5 percentage points over the last five years. This raises questions about the company’s expense base because its revenue growth should have given it leverage on its fixed costs, resulting in better economies of scale and profitability.
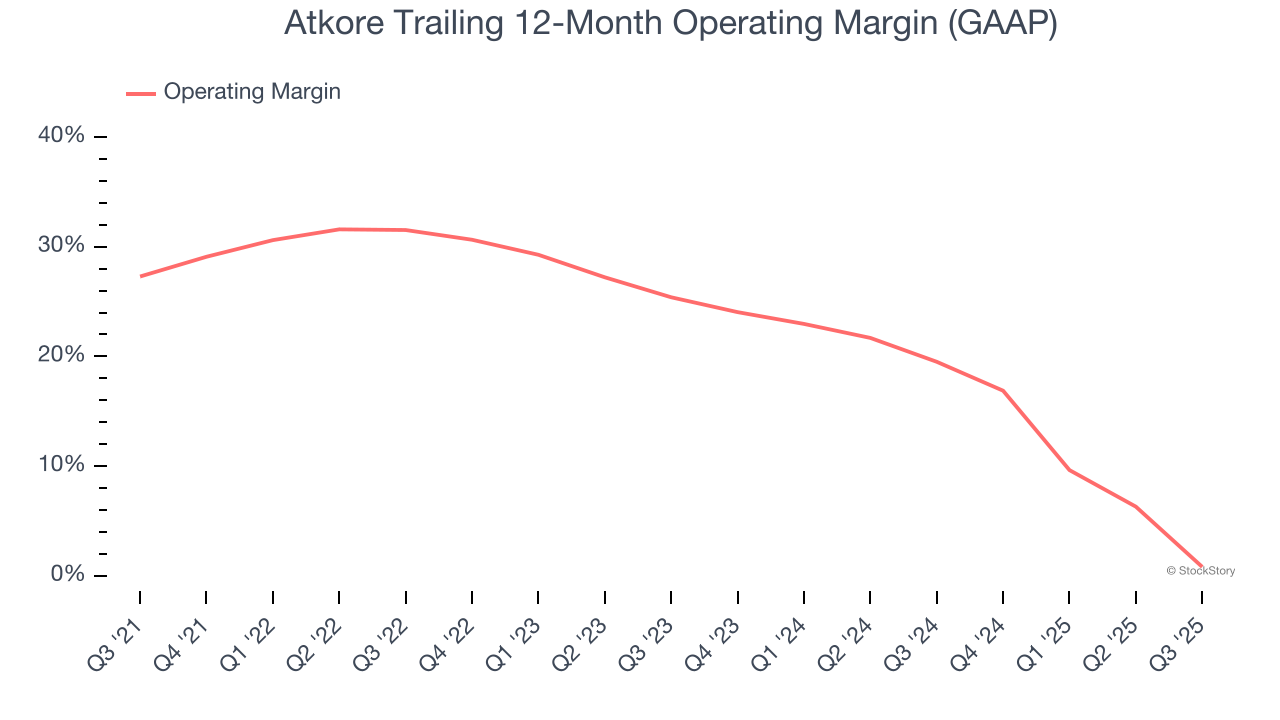
This quarter, Atkore generated an operating margin profit margin of negative 7.5%, down 20.5 percentage points year on year. Since Atkore’s operating margin decreased more than its gross margin, we can assume it was less efficient because expenses such as marketing, R&D, and administrative overhead increased.
Earnings Per Share
Revenue trends explain a company’s historical growth, but the long-term change in earnings per share (EPS) points to the profitability of that growth – for example, a company could inflate its sales through excessive spending on advertising and promotions.
Atkore’s decent 9.6% annual EPS growth over the last five years aligns with its revenue performance. This tells us it maintained its per-share profitability as it expanded.

Like with revenue, we analyze EPS over a shorter period to see if we are missing a change in the business.
Atkore’s two-year annual EPS declines of 44.4% were bad and lower than its two-year revenue losses.
We can take a deeper look into Atkore’s earnings to better understand the drivers of its performance. Atkore’s operating margin has declined over the last two years. This was the most relevant factor (aside from the revenue impact) behind its lower earnings; interest expenses and taxes can also affect EPS but don’t tell us as much about a company’s fundamentals.
In Q3, Atkore reported adjusted EPS of $0.69, down from $2.43 in the same quarter last year. This print missed analysts’ estimates, but we care more about long-term adjusted EPS growth than short-term movements. Over the next 12 months, Wall Street expects Atkore’s full-year EPS of $5.99 to shrink by 9.6%.
Key Takeaways from Atkore’s Q3 Results
We enjoyed seeing Atkore beat analysts’ revenue expectations this quarter. We were also glad its full-year EBITDA guidance slightly exceeded Wall Street’s estimates. On the other hand, its EBITDA missed and its EPS fell short of Wall Street’s estimates. Overall, this was a softer quarter. The stock traded down 9.2% to $60.41 immediately after reporting.
Atkore’s earnings report left more to be desired. Let’s look forward to see if this quarter has created an opportunity to buy the stock. When making that decision, it’s important to consider its valuation, business qualities, as well as what has happened in the latest quarter. We cover that in our actionable full research report which you can read here, it’s free for active Edge members.


