
Media broadcasting company Sinclair (NASDAQ: SBGI) reported Q3 CY2025 results exceeding the market’s revenue expectations, but sales fell by 15.7% year on year to $773 million. Guidance for next quarter’s revenue was better than expected at $833 million at the midpoint, 1.6% above analysts’ estimates. Its GAAP loss of $0.02 per share was 97.6% above analysts’ consensus estimates.
Is now the time to buy Sinclair? Find out by accessing our full research report, it’s free for active Edge members.
Sinclair (SBGI) Q3 CY2025 Highlights:
- Revenue: $773 million vs analyst estimates of $768.2 million (15.7% year-on-year decline, 0.6% beat)
- EPS (GAAP): -$0.02 vs analyst estimates of -$0.85 (97.6% beat)
- Adjusted EBITDA: $92 million vs analyst estimates of $87.89 million (11.9% margin, 4.7% beat)
- Revenue Guidance for Q4 CY2025 is $833 million at the midpoint, above analyst estimates of $819.6 million
- EBITDA guidance for Q4 CY2025 is $143 million at the midpoint, above analyst estimates of $131.3 million
- Operating Margin: 7.5%, down from 19.5% in the same quarter last year
- Market Capitalization: $930.5 million
Company Overview
With over 2,400 hours of local news produced weekly and 640 broadcast channels reaching millions of American homes, Sinclair (NASDAQ: SBGI) operates a network of 185 local television stations across 86 U.S. markets, producing news programming and distributing content from major networks.
Revenue Growth
A company’s long-term sales performance is one signal of its overall quality. Even a bad business can shine for one or two quarters, but a top-tier one grows for years.
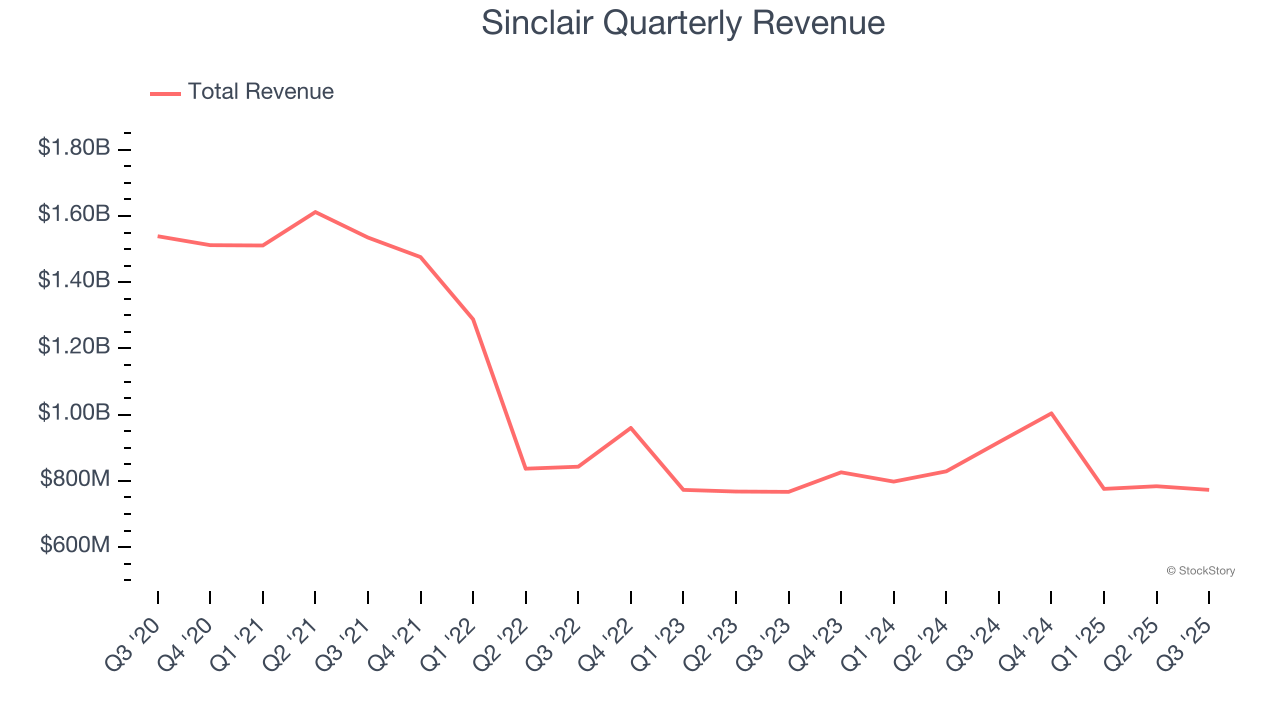
With $3.34 billion in revenue over the past 12 months, Sinclair is a mid-sized business services company, which sometimes brings disadvantages compared to larger competitors benefiting from better economies of scale.
As you can see below, Sinclair’s demand was weak over the last five years. Its sales fell by 11.2% annually, a tough starting point for our analysis.
We at StockStory place the most emphasis on long-term growth, but within business services, a half-decade historical view may miss recent innovations or disruptive industry trends. Sinclair’s annualized revenue growth of 1.1% over the last two years is above its five-year trend, but we were still disappointed by the results. 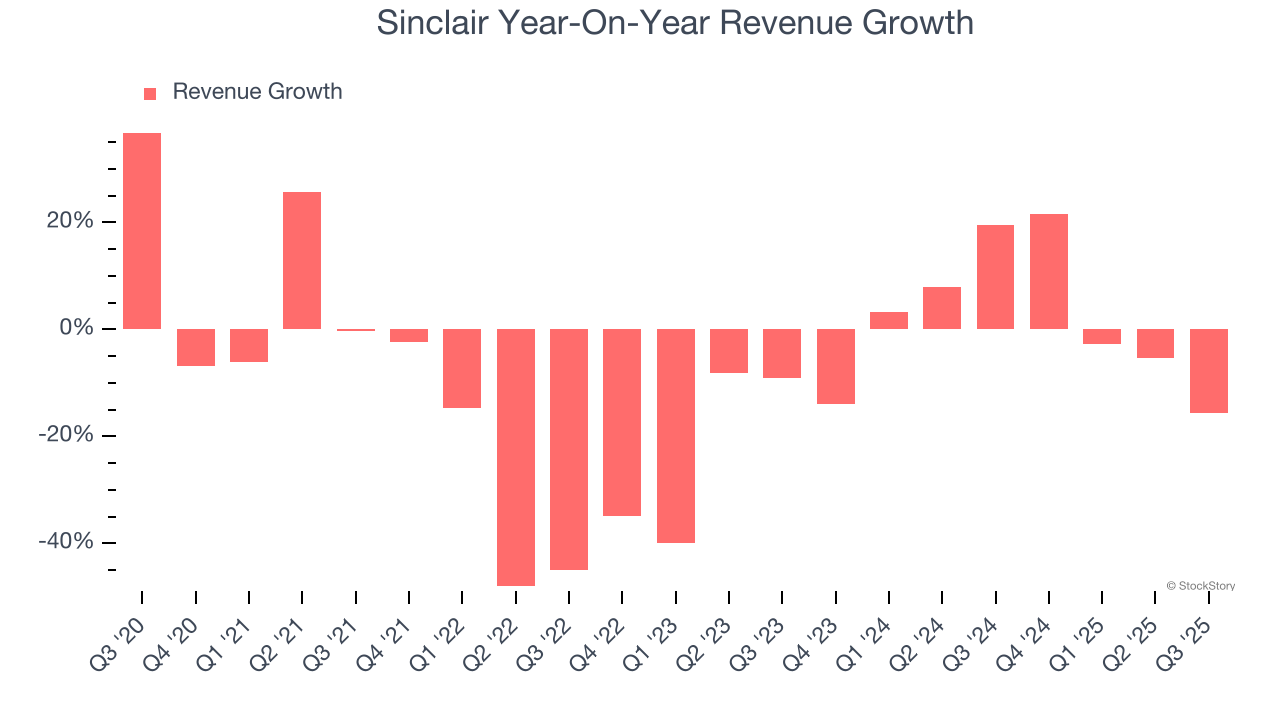
This quarter, Sinclair’s revenue fell by 15.7% year on year to $773 million but beat Wall Street’s estimates by 0.6%. Company management is currently guiding for a 17% year-on-year decline in sales next quarter.
Looking further ahead, sell-side analysts expect revenue to decline by 1.7% over the next 12 months, a slight deceleration versus the last two years. This projection doesn't excite us and suggests its products and services will face some demand challenges.
While Wall Street chases Nvidia at all-time highs, an under-the-radar semiconductor supplier is dominating a critical AI component these giants can’t build without. Click here to access our free report one of our favorites growth stories.
Operating Margin
Operating margin is one of the best measures of profitability because it tells us how much money a company takes home after subtracting all core expenses, like marketing and R&D.
Sinclair has been a well-oiled machine over the last five years. It demonstrated elite profitability for a business services business, boasting an average operating margin of 24.3%.
Looking at the trend in its profitability, Sinclair’s operating margin rose by 1.8 percentage points over the last five years, showing its efficiency has improved.
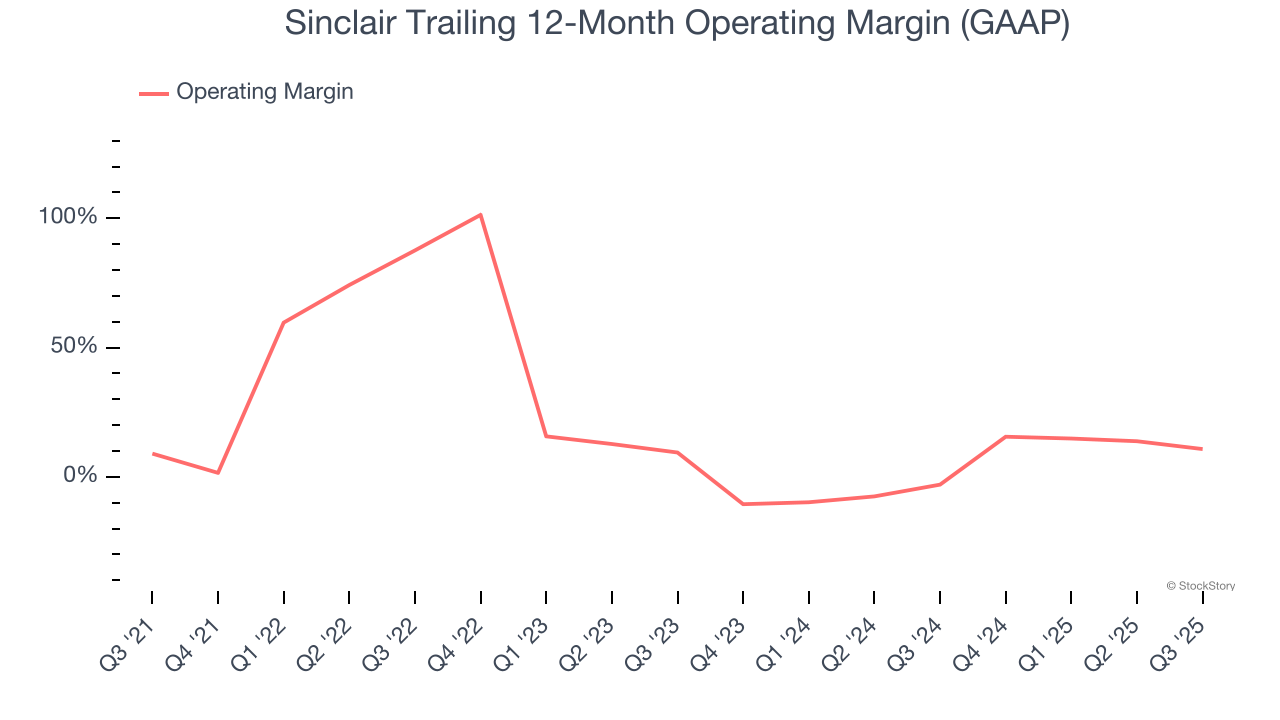
This quarter, Sinclair generated an operating margin profit margin of 7.5%, down 12 percentage points year on year. This contraction shows it was less efficient because its expenses increased relative to its revenue.
Earnings Per Share
Revenue trends explain a company’s historical growth, but the long-term change in earnings per share (EPS) points to the profitability of that growth – for example, a company could inflate its sales through excessive spending on advertising and promotions.
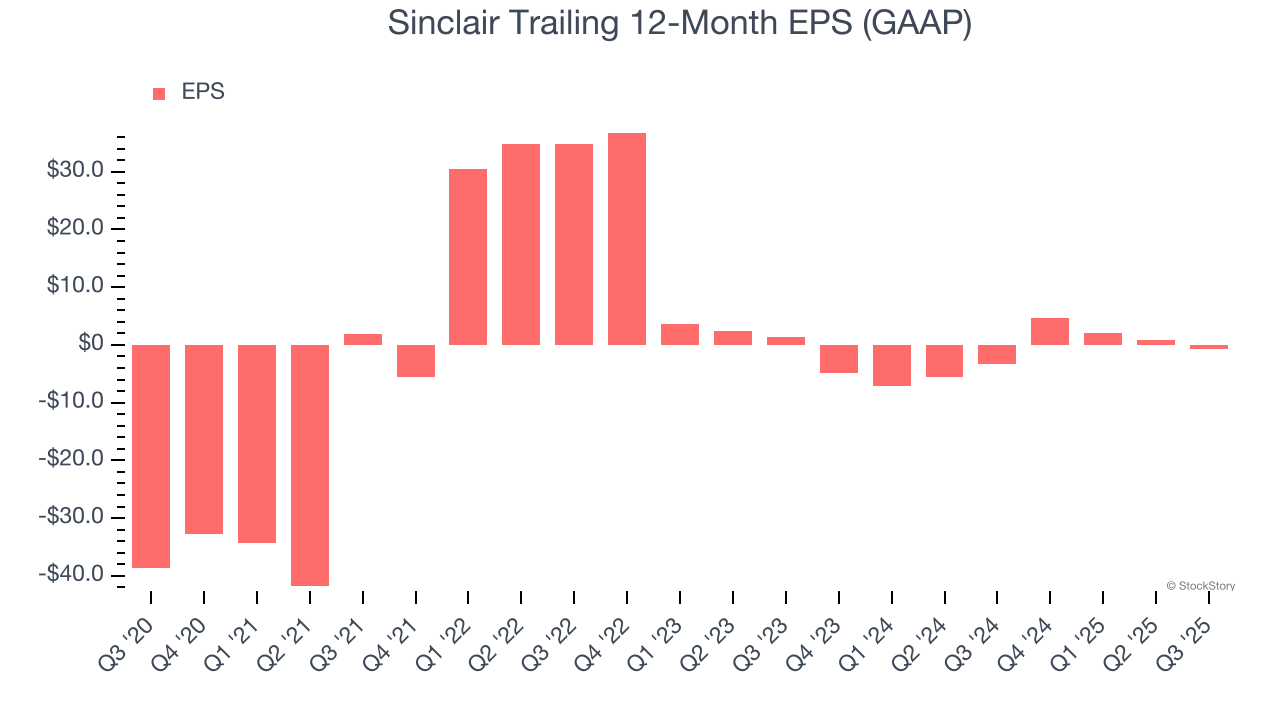
Although Sinclair’s full-year earnings are still negative, it reduced its losses and improved its EPS by 56.2% annually over the last five years. The next few quarters will be critical for assessing its long-term profitability.
Like with revenue, we analyze EPS over a shorter period to see if we are missing a change in the business.
Sadly for Sinclair, its EPS declined by 57.3% annually over the last two years while its revenue grew by 1.1%. This tells us the company became less profitable on a per-share basis as it expanded.
We can take a deeper look into Sinclair’s earnings to better understand the drivers of its performance. A two-year view shows Sinclair has diluted its shareholders, growing its share count by 10%. This dilution overshadowed its increased operational efficiency and has led to lower per share earnings. 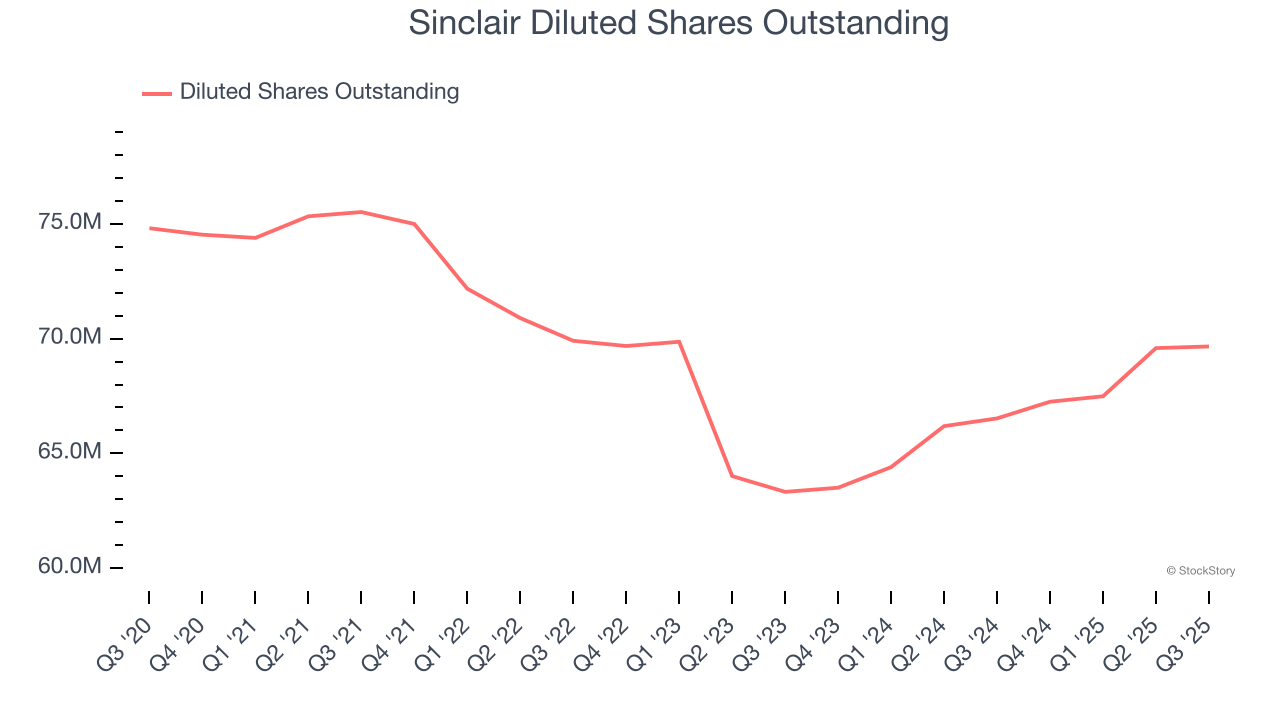
In Q3, Sinclair reported EPS of negative $0.02, down from $1.43 in the same quarter last year. Despite falling year on year, this print easily cleared analysts’ estimates. Over the next 12 months, Wall Street expects Sinclair to perform poorly. Analysts forecast its full-year EPS of negative $0.62 will tumble to negative $1.54.
Key Takeaways from Sinclair’s Q3 Results
It was good to see Sinclair beat analysts’ EPS expectations this quarter. We were also glad its full-year revenue guidance trumped Wall Street’s estimates. Zooming out, we think this was a solid print. The stock traded up 4.8% to $14.30 immediately following the results.
Sure, Sinclair had a solid quarter, but if we look at the bigger picture, is this stock a buy? The latest quarter does matter, but not nearly as much as longer-term fundamentals and valuation, when deciding if the stock is a buy. We cover that in our actionable full research report which you can read here, it’s free for active Edge members.


