Heating and cooling solutions company AAON (NASDAQ: AAON) reported Q3 CY2025 results exceeding the market’s revenue expectations, with sales up 17.4% year on year to $384.2 million. Its non-GAAP profit of $0.37 per share was 14.9% above analysts’ consensus estimates.
Is now the time to buy AAON? Find out by accessing our full research report, it’s free for active Edge members.
AAON (AAON) Q3 CY2025 Highlights:
- Revenue: $384.2 million vs analyst estimates of $337.5 million (17.4% year-on-year growth, 13.8% beat)
- Adjusted EPS: $0.37 vs analyst estimates of $0.32 (14.9% beat)
- Adjusted EBITDA: $63.55 million vs analyst estimates of $61.21 million (16.5% margin, 3.8% beat)
- Operating Margin: 11.3%, down from 20% in the same quarter last year
- Free Cash Flow was -$33.3 million, down from $29.79 million in the same quarter last year
- Backlog: $1.32 billion at quarter end, up 104% year on year
- Market Capitalization: $7.62 billion
"Our third quarter results demonstrate the enduring demand for our products and reflect continued share gains, margin improvement and steady progress toward our operational goals, with notable sequential improvement in several key areas," said AAON President and CEO Matt Tobolski.
Company Overview
Backed by two million square feet of lab testing space, AAON (NASDAQ: AAON) makes heating, ventilation, and air conditioning equipment for different types of buildings.
Revenue Growth
A company’s long-term sales performance can indicate its overall quality. Even a bad business can shine for one or two quarters, but a top-tier one grows for years. Thankfully, AAON’s 20.4% annualized revenue growth over the last five years was incredible. Its growth beat the average industrials company and shows its offerings resonate with customers.
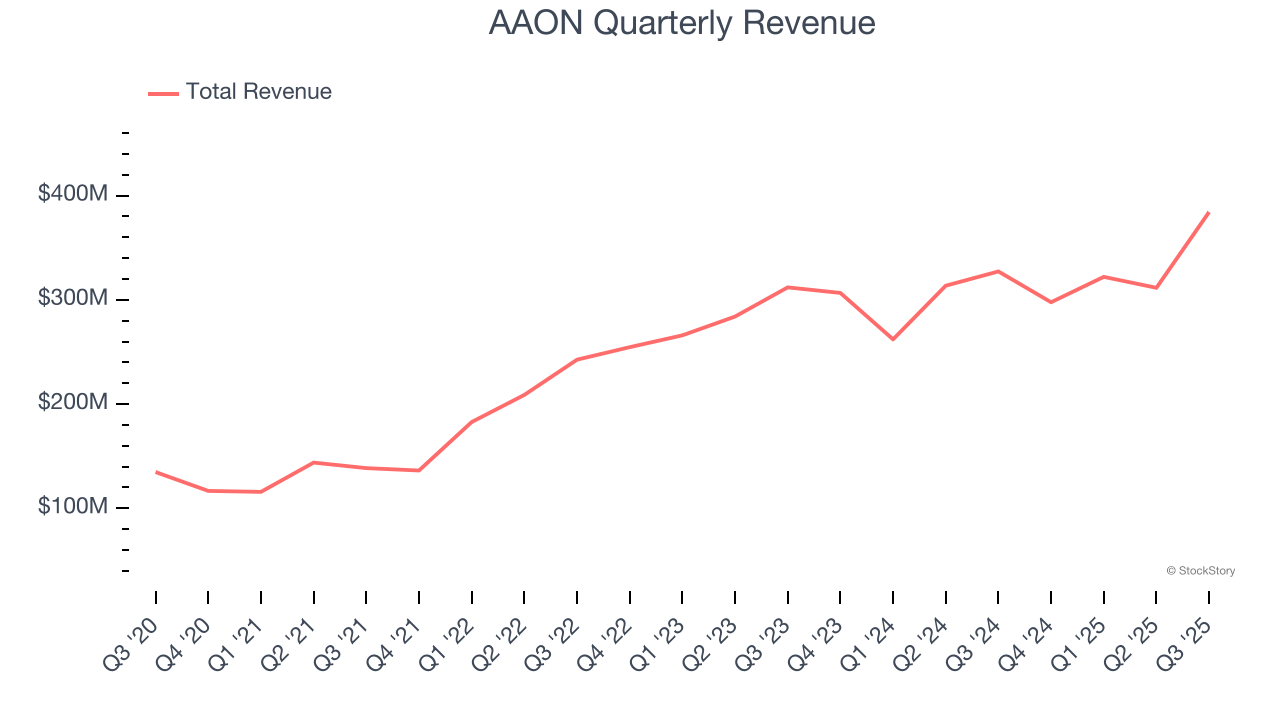
We at StockStory place the most emphasis on long-term growth, but within industrials, a half-decade historical view may miss cycles, industry trends, or a company capitalizing on catalysts such as a new contract win or a successful product line. AAON’s annualized revenue growth of 8.6% over the last two years is below its five-year trend, but we still think the results were respectable. 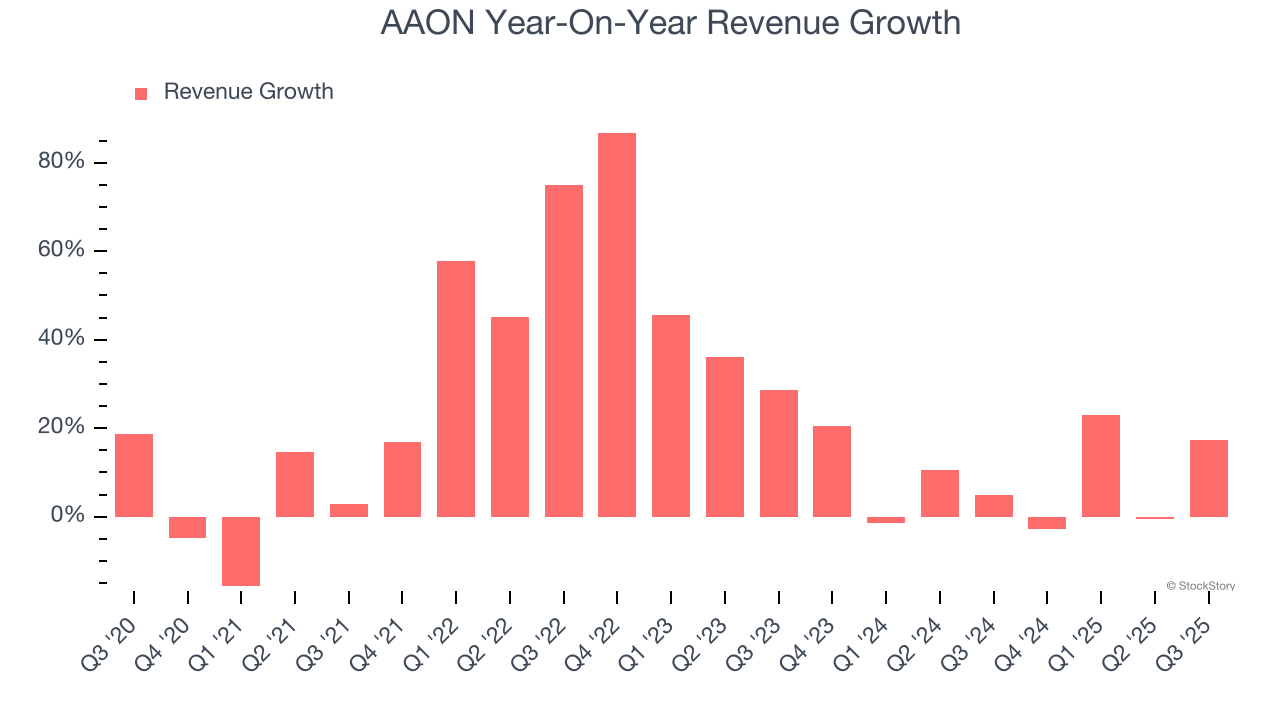
We can dig further into the company’s revenue dynamics by analyzing its backlog, or the value of its outstanding orders that have not yet been executed or delivered. AAON’s backlog reached $1.32 billion in the latest quarter and averaged 87.9% year-on-year growth over the last two years. Because this number is better than its revenue growth, we can see the company accumulated more orders than it could fulfill and deferred revenue to the future. This could imply elevated demand for AAON’s products and services but raises concerns about capacity constraints. 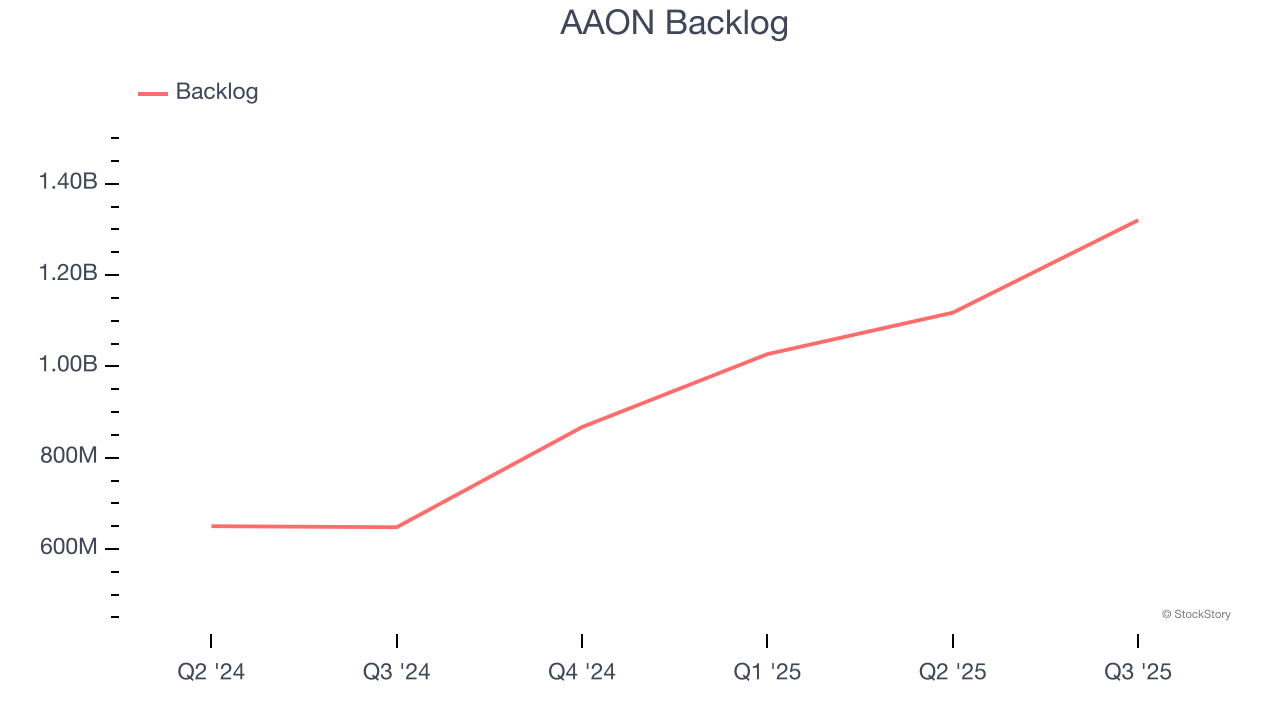
This quarter, AAON reported year-on-year revenue growth of 17.4%, and its $384.2 million of revenue exceeded Wall Street’s estimates by 13.8%.
Looking ahead, sell-side analysts expect revenue to grow 13.5% over the next 12 months, an improvement versus the last two years. This projection is admirable and implies its newer products and services will fuel better top-line performance.
While Wall Street chases Nvidia at all-time highs, an under-the-radar semiconductor supplier is dominating a critical AI component these giants can’t build without. Click here to access our free report one of our favorites growth stories.
Operating Margin
AAON has been a well-oiled machine over the last five years. It demonstrated elite profitability for an industrials business, boasting an average operating margin of 15.7%.
Looking at the trend in its profitability, AAON’s operating margin decreased by 6.1 percentage points over the last five years. This raises questions about the company’s expense base because its revenue growth should have given it leverage on its fixed costs, resulting in better economies of scale and profitability.
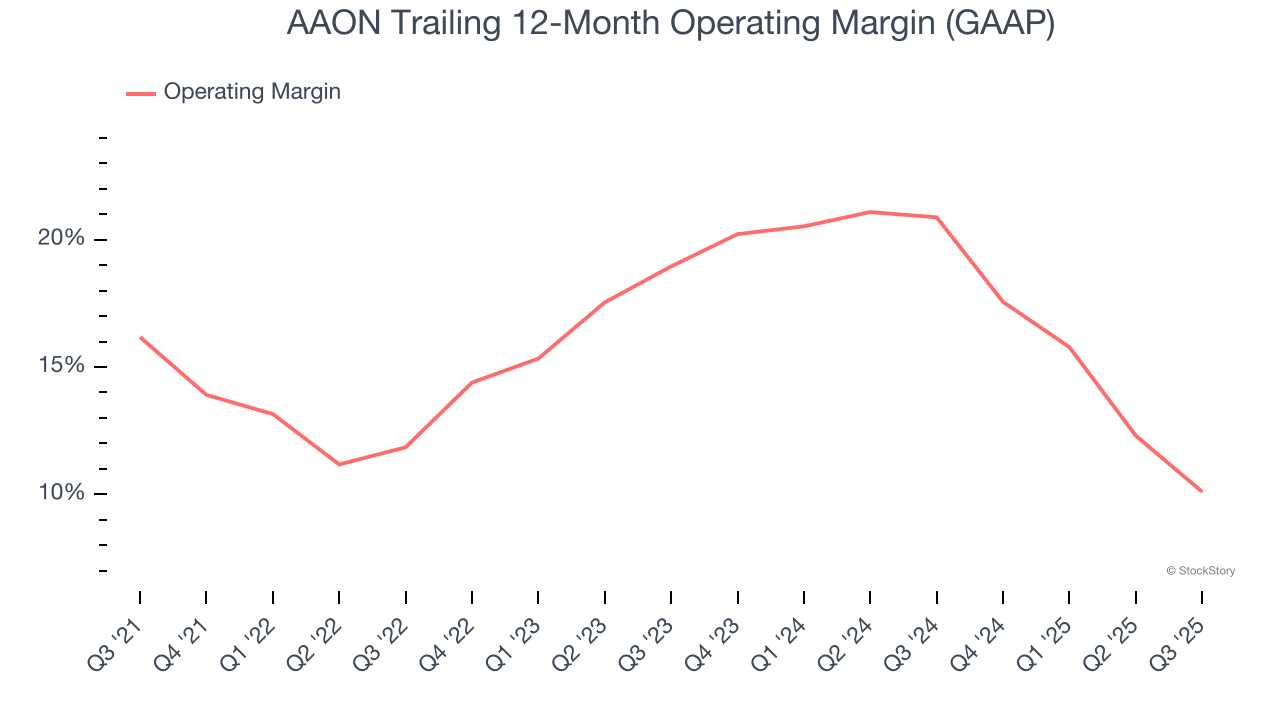
This quarter, AAON generated an operating margin profit margin of 11.3%, down 8.7 percentage points year on year. Since AAON’s operating margin decreased more than its gross margin, we can assume it was less efficient because expenses such as marketing, R&D, and administrative overhead increased.
Earnings Per Share
Revenue trends explain a company’s historical growth, but the long-term change in earnings per share (EPS) points to the profitability of that growth – for example, a company could inflate its sales through excessive spending on advertising and promotions.
AAON’s EPS grew at an unimpressive 5.3% compounded annual growth rate over the last five years, lower than its 20.4% annualized revenue growth. This tells us the company became less profitable on a per-share basis as it expanded.
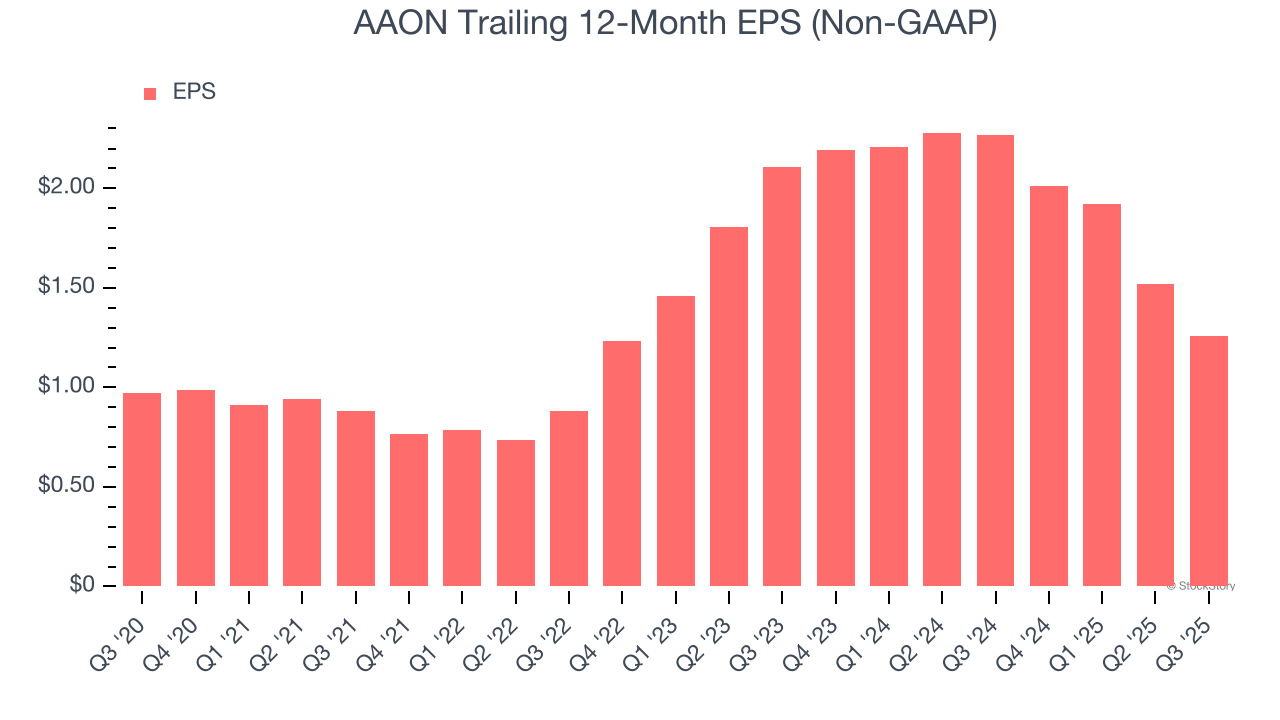
Diving into the nuances of AAON’s earnings can give us a better understanding of its performance. As we mentioned earlier, AAON’s operating margin declined by 6.1 percentage points over the last five years. Its share count also grew by 4%, meaning the company not only became less efficient with its operating expenses but also diluted its shareholders. 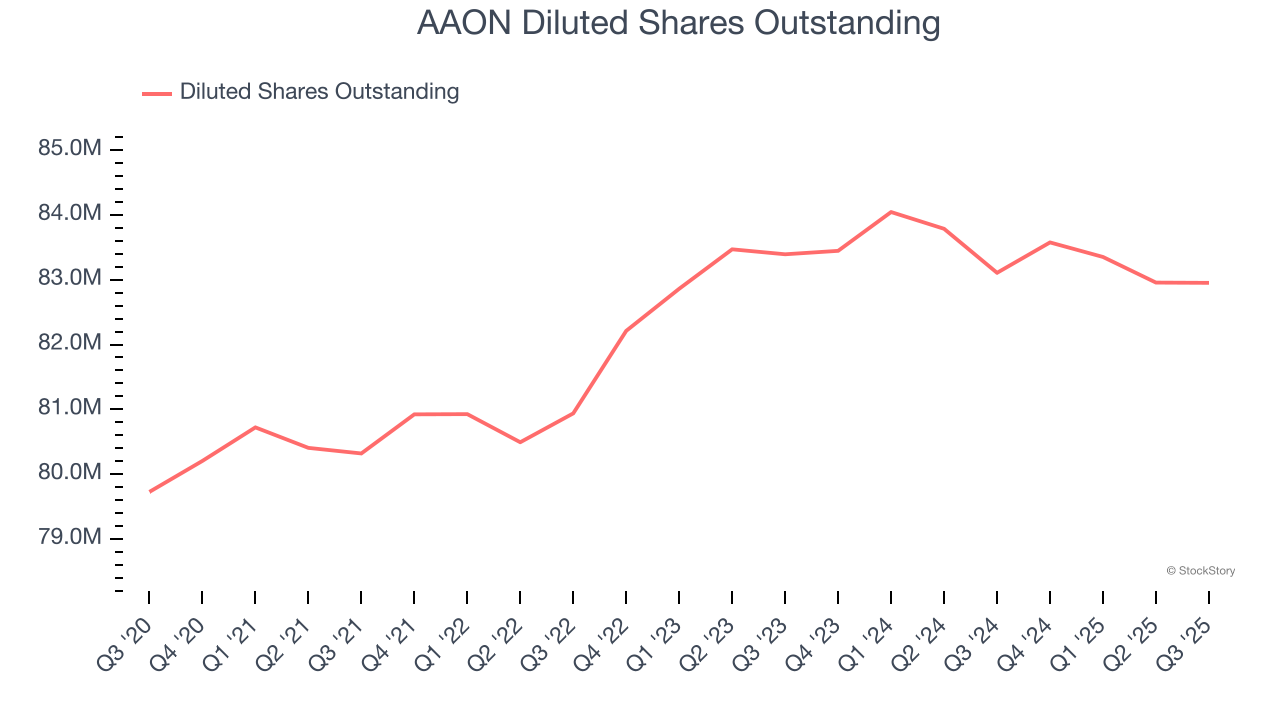
Like with revenue, we analyze EPS over a shorter period to see if we are missing a change in the business.
For AAON, its two-year annual EPS declines of 22.7% show it’s continued to underperform. These results were bad no matter how you slice the data.
In Q3, AAON reported adjusted EPS of $0.37, down from $0.63 in the same quarter last year. Despite falling year on year, this print easily cleared analysts’ estimates. Over the next 12 months, Wall Street expects AAON’s full-year EPS of $1.26 to grow 45.5%.
Key Takeaways from AAON’s Q3 Results
We were impressed by how significantly AAON blew past analysts’ revenue expectations this quarter. We were also glad its EPS outperformed Wall Street’s estimates. Zooming out, we think this was a solid print. The stock traded up 10% to $102.77 immediately following the results.
AAON had an encouraging quarter, but one earnings result doesn’t necessarily make the stock a buy. Let’s see if this is a good investment. What happened in the latest quarter matters, but not as much as longer-term business quality and valuation, when deciding whether to invest in this stock. We cover that in our actionable full research report which you can read here, it’s free for active Edge members.