
Energy and construction materials company MDU Resources (NYSE: MDU) reported Q3 CY2025 revenues of $315.1 million, exceeding the market’s revenue expectations. Its GAAP profit of $0.09 per share decreased from $0.32 in the same quarter last year.
Is now the time to buy MDU Resources? Find out by accessing our full research report, it’s free for active Edge members.
MDU Resources (MDU) Q3 CY2025 Highlights:
- Revenue: $315.1 million vs analyst estimates of $305 million (70% year-on-year decline, 3.3% beat)
- Adjusted EBITDA: $91.9 million vs analyst estimates of $99.45 million (29.2% margin, 7.6% miss)
- EPS (GAAP) guidance for the full year is $0.93 at the midpoint, missing analyst estimates by 1.6%
- Operating Margin: 12.6%, up from 8.7% in the same quarter last year
- Market Capitalization: $4.02 billion
"We continue to execute on our long-term strategy as a regulated energy delivery company, with results that demonstrate the strength of our diversified utility and pipeline portfolio," said Nicole A. Kivisto, president and CEO of MDU Resources.
Company Overview
Founded to provide electricity to towns in Minnesota, MDU Resources (NYSE: MDU) provides products and services in the utilities and construction materials industries.
Revenue Growth
A company’s long-term sales performance can indicate its overall quality. Any business can put up a good quarter or two, but many enduring ones grow for years. Over the last five years, MDU Resources’s demand was weak and its revenue declined by 19.4% per year. This was below our standards and is a sign of poor business quality.
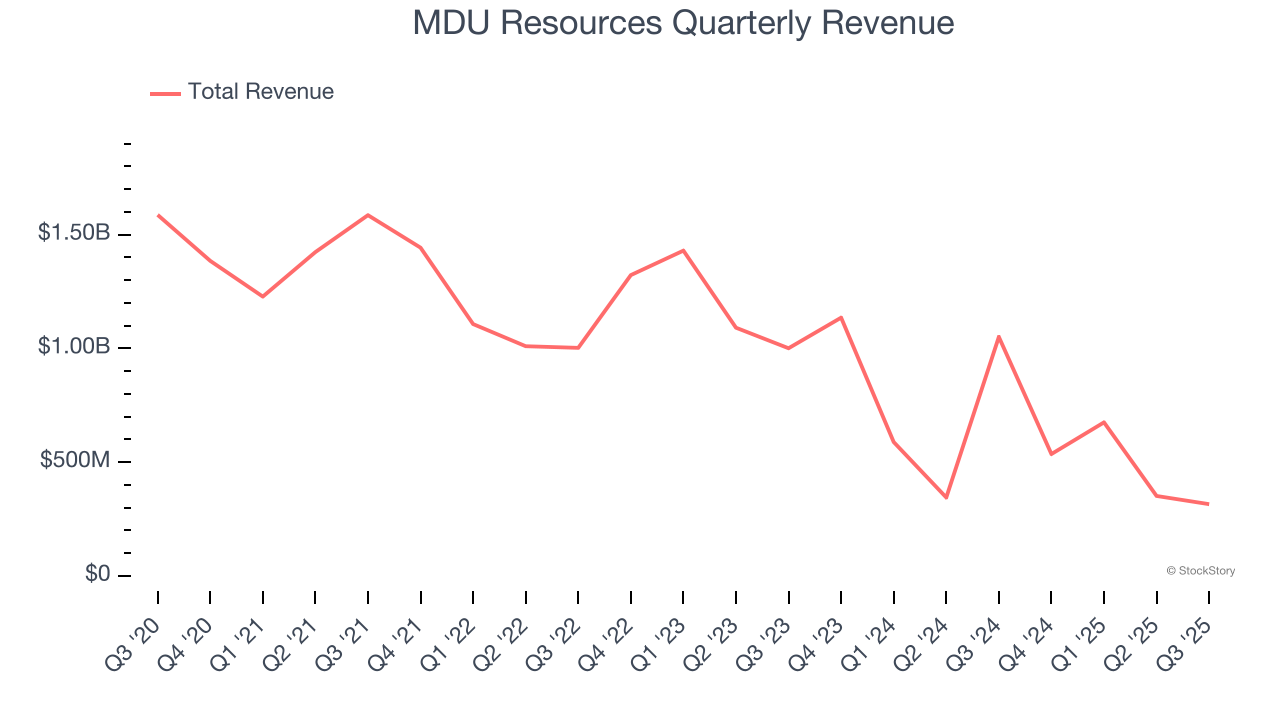
Long-term growth is the most important, but within industrials, a half-decade historical view may miss new industry trends or demand cycles. MDU Resources’s recent performance shows its demand remained suppressed as its revenue has declined by 37.8% annually over the last two years. 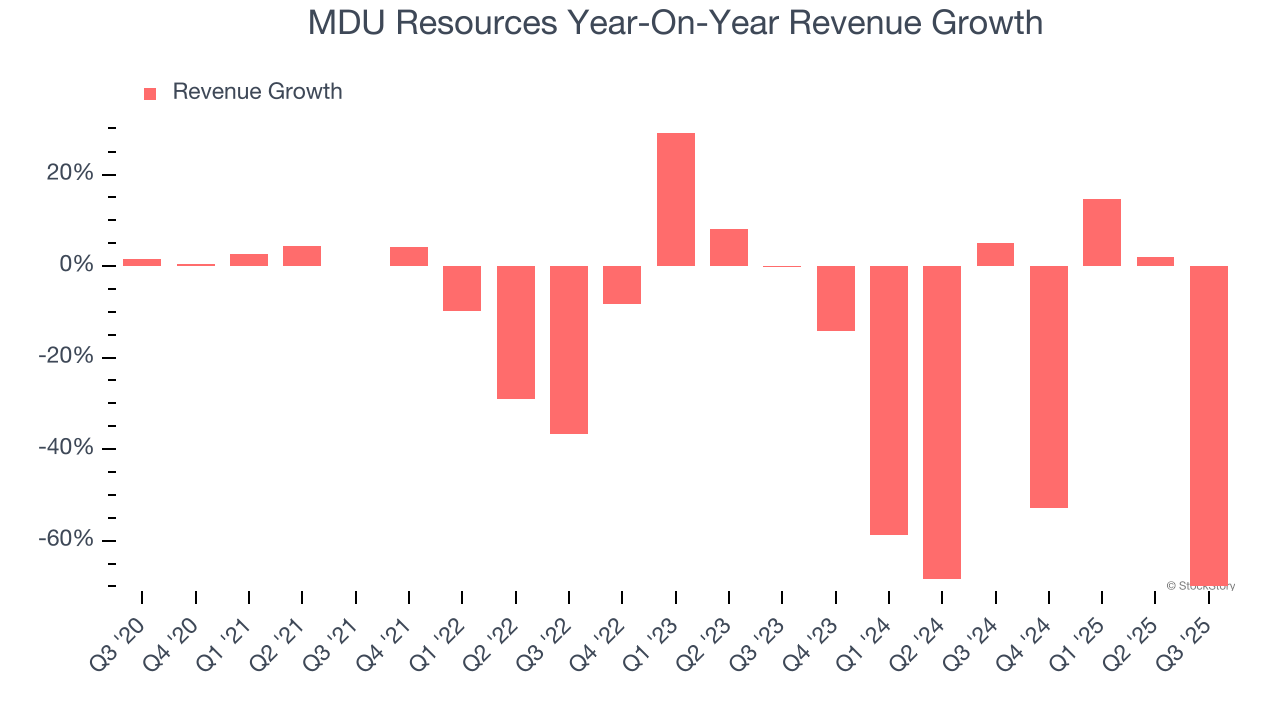
This quarter, MDU Resources’s revenue fell by 70% year on year to $315.1 million but beat Wall Street’s estimates by 3.3%.
Looking ahead, sell-side analysts expect revenue to remain flat over the next 12 months. Although this projection implies its newer products and services will spur better top-line performance, it is still below average for the sector.
While Wall Street chases Nvidia at all-time highs, an under-the-radar semiconductor supplier is dominating a critical AI component these giants can’t build without. Click here to access our free report one of our favorites growth stories.
Operating Margin
Operating margin is one of the best measures of profitability because it tells us how much money a company takes home after procuring and manufacturing its products, marketing and selling those products, and most importantly, keeping them relevant through research and development.
MDU Resources has managed its cost base well over the last five years. It demonstrated solid profitability for an industrials business, producing an average operating margin of 10%. This result isn’t surprising as its high gross margin gives it a favorable starting point.
Analyzing the trend in its profitability, MDU Resources’s operating margin rose by 4.8 percentage points over the last five years, showing its efficiency has improved.
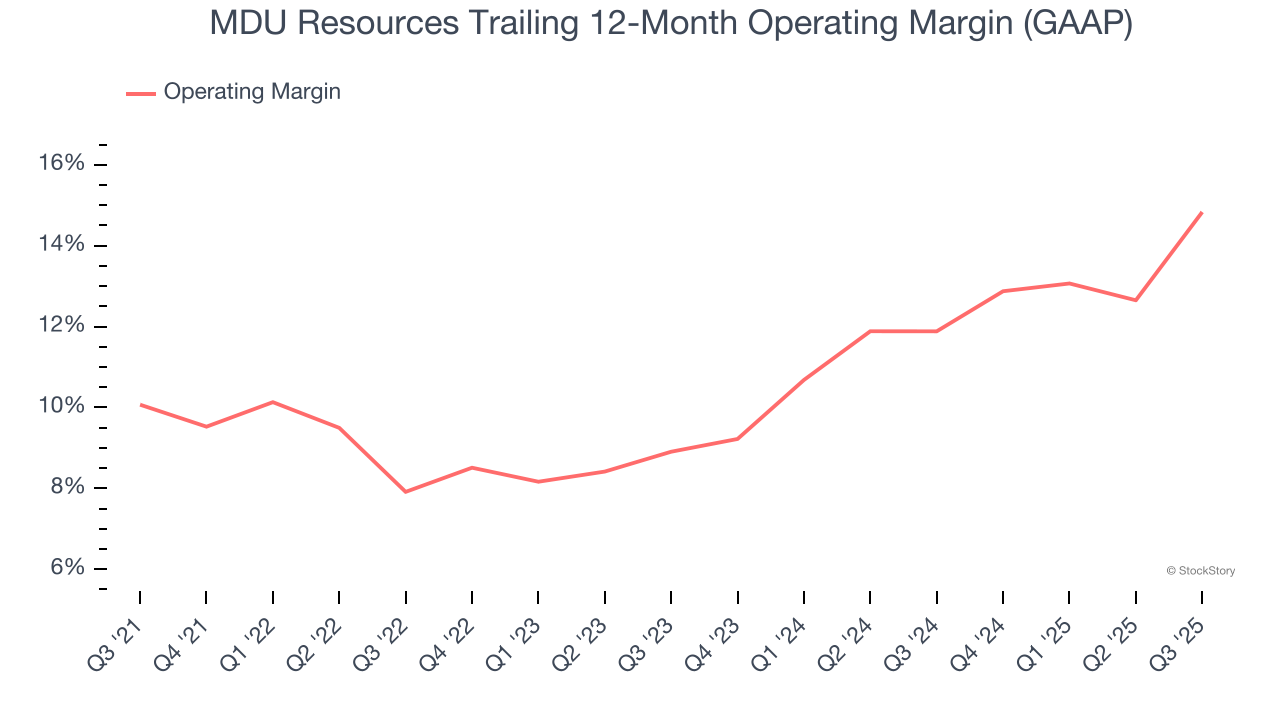
In Q3, MDU Resources generated an operating margin profit margin of 12.6%, up 3.9 percentage points year on year. Since its gross margin expanded more than its operating margin, we can infer that leverage on its cost of sales was the primary driver behind the recently higher efficiency.
Earnings Per Share
We track the long-term change in earnings per share (EPS) for the same reason as long-term revenue growth. Compared to revenue, however, EPS highlights whether a company’s growth is profitable.
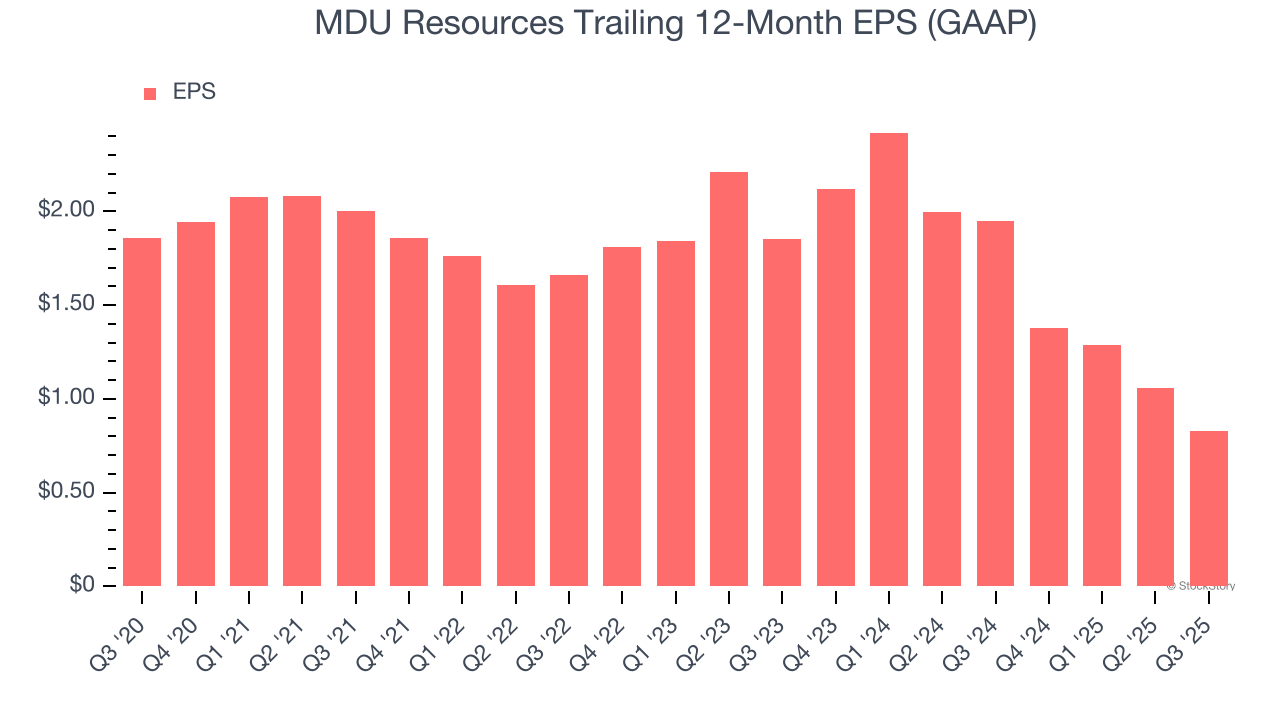
Sadly for MDU Resources, its EPS and revenue declined by 14.9% and 19.4% annually over the last five years. We tend to steer our readers away from companies with falling revenue and EPS, where diminishing earnings could imply changing secular trends and preferences. If the tide turns unexpectedly, MDU Resources’s low margin of safety could leave its stock price susceptible to large downswings.
Like with revenue, we analyze EPS over a more recent period because it can provide insight into an emerging theme or development for the business.
For MDU Resources, its two-year annual EPS declines of 33% show it’s continued to underperform. These results were bad no matter how you slice the data.
In Q3, MDU Resources reported EPS of $0.09, down from $0.32 in the same quarter last year. We also like to analyze expected EPS growth based on Wall Street analysts’ consensus projections, but there is insufficient data.
Key Takeaways from MDU Resources’s Q3 Results
We enjoyed seeing MDU Resources beat analysts’ revenue expectations this quarter. On the other hand, its EBITDA missed and its full-year EPS guidance fell short of Wall Street’s estimates. Overall, this was a weaker quarter. The stock remained flat at $19.66 immediately after reporting.
The latest quarter from MDU Resources’s wasn’t that good. One earnings report doesn’t define a company’s quality, though, so let’s explore whether the stock is a buy at the current price. The latest quarter does matter, but not nearly as much as longer-term fundamentals and valuation, when deciding if the stock is a buy. We cover that in our actionable full research report which you can read here, it’s free for active Edge members.