
Auto insurance provider Mercury General (NYSE: MCY) announced better-than-expected revenue in Q4 CY2025, with sales up 11.3% year on year to $1.54 billion. Its GAAP profit of $3.66 per share was 43% above analysts’ consensus estimates.
Is now the time to buy Mercury General? Find out by accessing our full research report, it’s free.
Mercury General (MCY) Q4 CY2025 Highlights:
- Net Premiums Earned: $1.45 billion vs analyst estimates of $1.42 billion (6.9% year-on-year growth, 2% beat)
- Revenue: $1.54 billion vs analyst estimates of $1.37 billion (11.3% year-on-year growth, 11.7% beat)
- Combined Ratio: 88.6% vs analyst estimates of 93.3% (470 basis point beat)
- EPS (GAAP): $3.66 vs analyst estimates of $2.56 (43% beat)
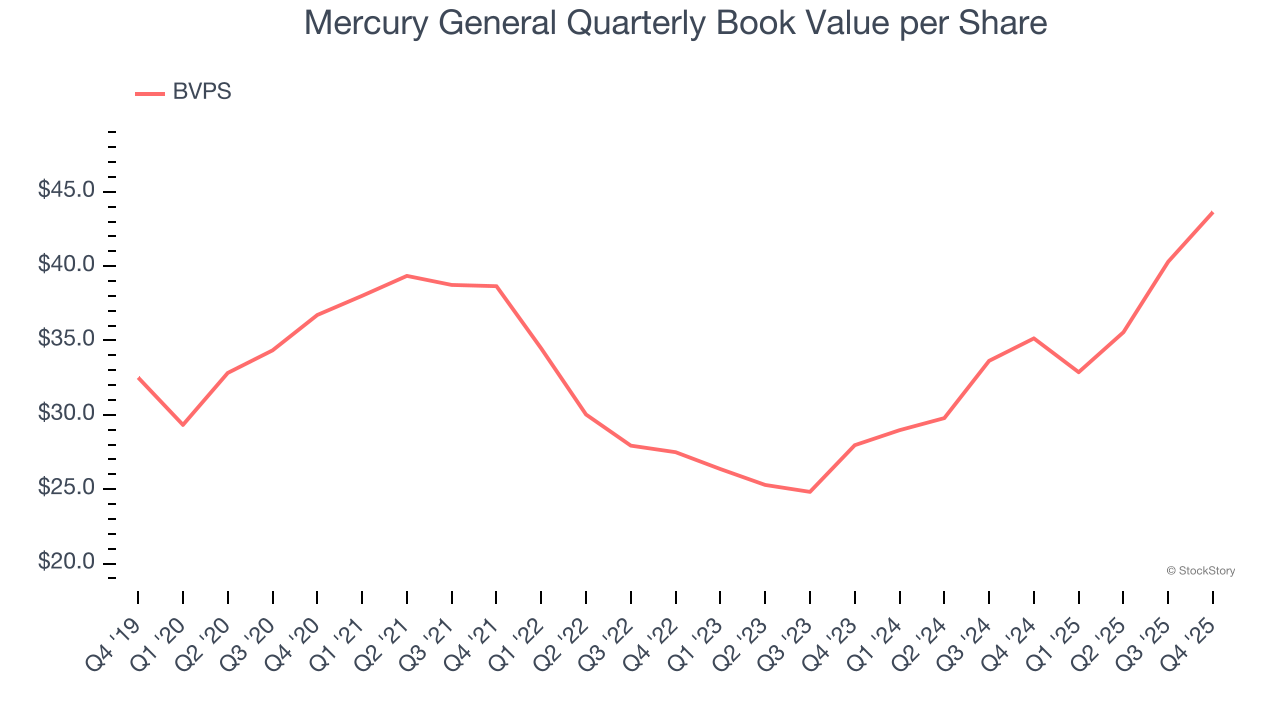
- Book Value per Share: $43.64 (24.2% year-on-year growth)
- Market Capitalization: $5.18 billion
Gabe Tirador, the Company's CEO, commented on the 2025 results: "We are proud of our team's accomplishments in 2025. The Palisades and Eaton wildfires were the most significant catastrophes in Mercury's history, driving our first quarter combined ratio to 119.2%, but our business in subsequent quarters performed strongly ending with an 88.6% combined ratio in the fourth quarter and 96.3% for the full year. And our team demonstrated exceptional resilience and commitment to our policyholders, managing more than 2,900 wildfire claims and paying over $1.4 billion to date."
Company Overview
Founded in 1961 and maintaining a network of over 6,300 independent agents across the country, Mercury General (NYSE: MCY) is an insurance company that primarily sells automobile insurance policies through independent agents in 11 states, with a strong focus on California.
Revenue Growth
Insurance companies earn revenue from three primary sources: 1) The core insurance business itself, often called underwriting and represented in the income statement as premiums 2) Income from investing the “float” (premiums collected upfront not yet paid out as claims) in assets such as fixed-income assets and equities 3) Fees from various sources such as policy administration, annuities, or other value-added services. Luckily, Mercury General’s revenue grew at a solid 9.6% compounded annual growth rate over the last five years. Its growth beat the average insurance company and shows its offerings resonate with customers.
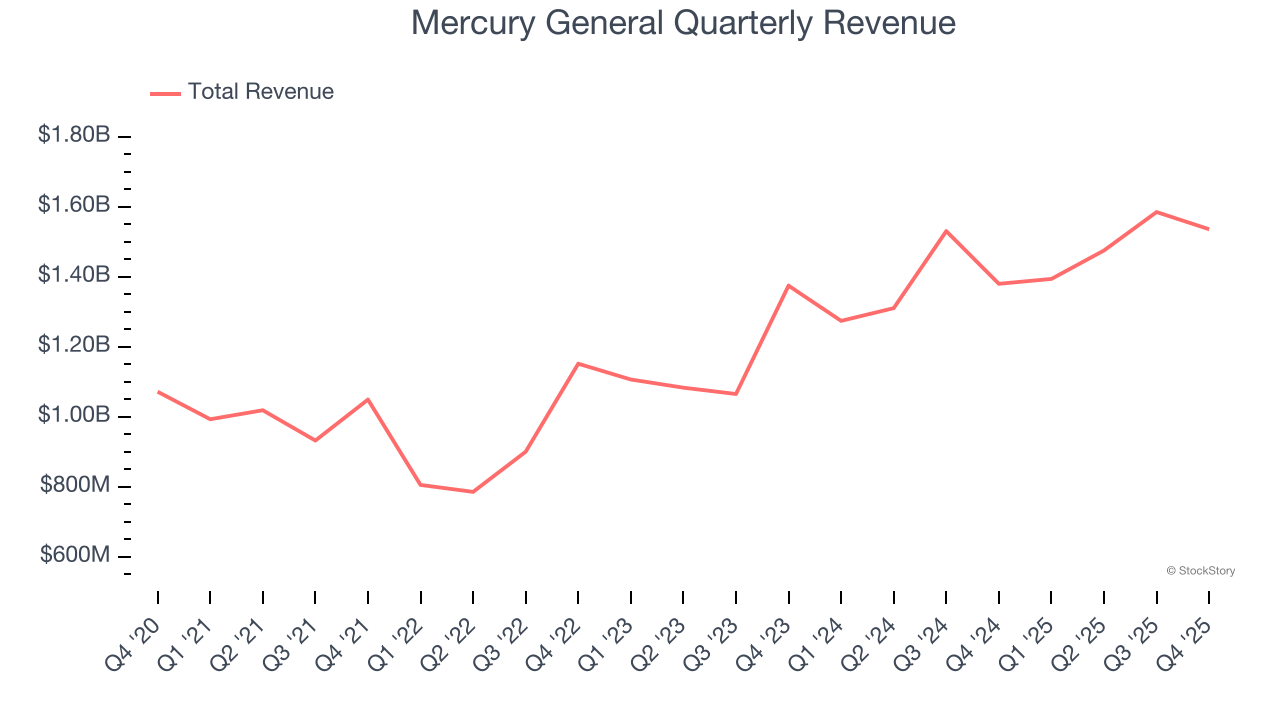
We at StockStory place the most emphasis on long-term growth, but within financials, a half-decade historical view may miss recent interest rate changes, market returns, and industry trends. Mercury General’s annualized revenue growth of 13.7% over the last two years is above its five-year trend, suggesting its demand was strong and recently accelerated. 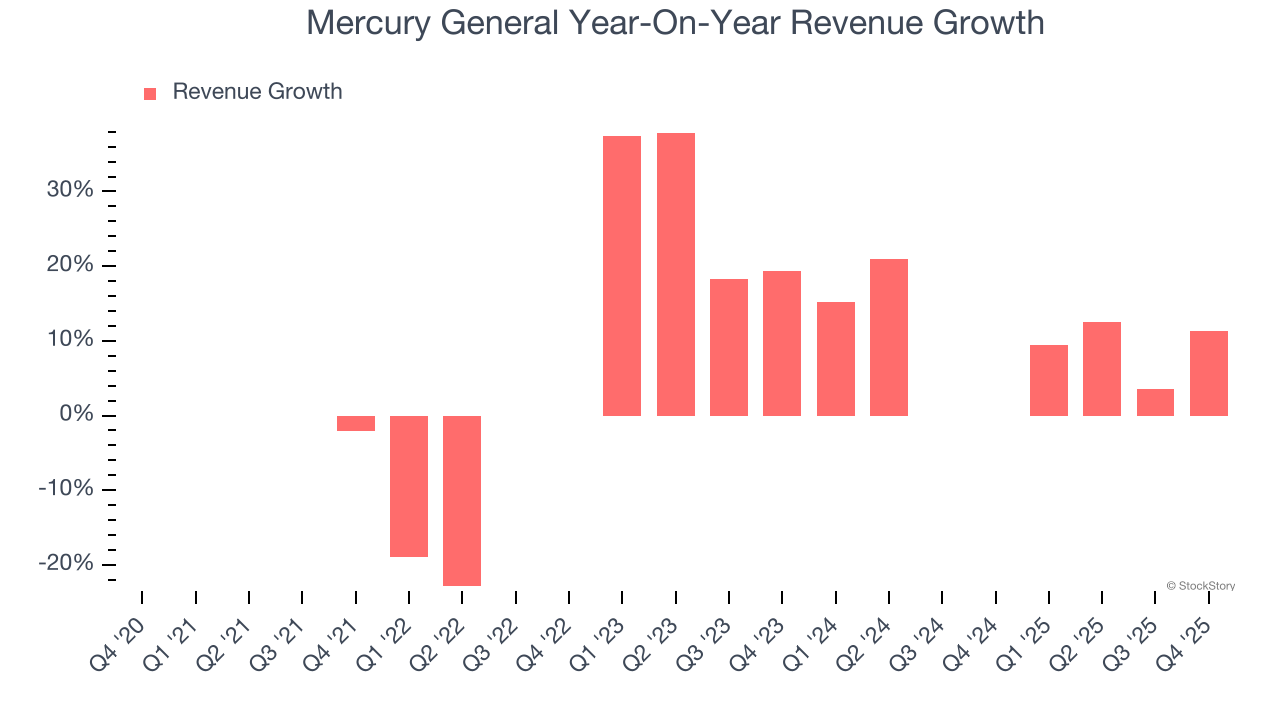 Note: Quarters not shown were determined to be outliers, impacted by outsized investment gains/losses that are not indicative of the recurring fundamentals of the business.
This quarter, Mercury General reported year-on-year revenue growth of 11.3%, and its $1.54 billion of revenue exceeded Wall Street’s estimates by 11.7%.
Net premiums earned made up 94.9% of the company’s total revenue during the last five years, meaning Mercury General lives and dies by its underwriting activities because non-insurance operations barely move the needle.
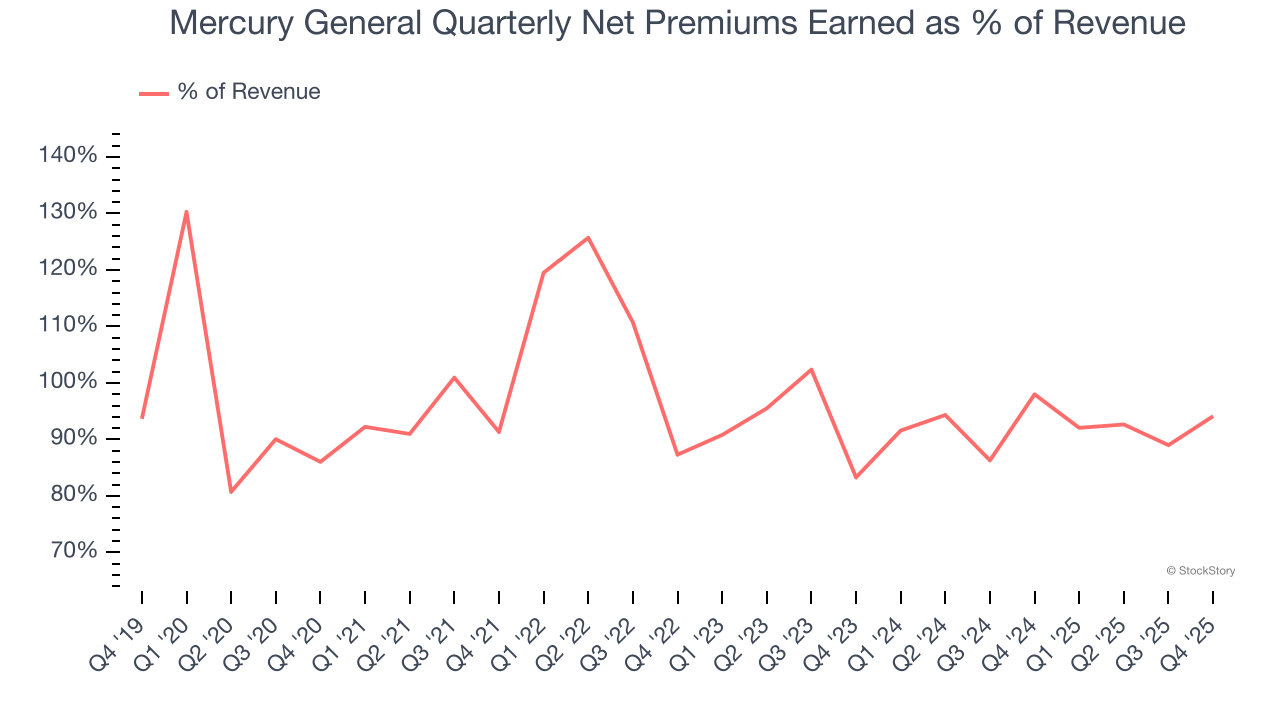
Our experience and research show the market cares primarily about an insurer’s net premiums earned growth as investment and fee income are considered more susceptible to market volatility and economic cycles.
Software is eating the world and there is virtually no industry left that has been untouched by it. That drives increasing demand for tools helping software developers do their jobs, whether it be monitoring critical cloud infrastructure, integrating audio and video functionality, or ensuring smooth content streaming. Click here to access a free report on our 3 favorite stocks to play this generational megatrend.
Book Value Per Share (BVPS)
Insurance companies are balance sheet businesses, collecting premiums upfront and paying out claims over time. The float–premiums collected but not yet paid out–are invested, creating an asset base supported by a liability structure. Book value per share (BVPS) captures this dynamic by measuring these assets (investment portfolio, cash, reinsurance recoverables) less liabilities (claim reserves, debt, future policy benefits). BVPS is essentially the residual value for shareholders.
We therefore consider BVPS very important to track for insurers and a metric that sheds light on business quality. While other (and more commonly known) per-share metrics like EPS can sometimes be lumpy due to reserve releases or one-time items and can be managed or skewed while still following accounting rules, BVPS reflects long-term capital growth and is harder to manipulate.
Mercury General’s BVPS grew at a sluggish 3.5% annual clip over the last five years. However, BVPS growth has accelerated recently, growing by 24.9% annually over the last two years from $27.96 to $43.64 per share.
Key Takeaways from Mercury General’s Q4 Results
It was good to see Mercury General beat analysts’ EPS expectations this quarter. We were also excited its revenue outperformed Wall Street’s estimates by a wide margin. Zooming out, we think this was a solid print. The stock remained flat at $96.62 immediately after reporting.
Mercury General put up rock-solid earnings, but one quarter doesn’t necessarily make the stock a buy. Let’s see if this is a good investment. What happened in the latest quarter matters, but not as much as longer-term business quality and valuation, when deciding whether to invest in this stock. We cover that in our actionable full research report which you can read here (it’s free).


