
Global advertising giant Omnicom Group (NYSE: OMC) reported Q4 CY2025 results topping the market’s revenue expectations, with sales up 27.9% year on year to $5.53 billion. Its non-GAAP profit of $2.59 per share was 11.8% below analysts’ consensus estimates.
Is now the time to buy Omnicom Group? Find out by accessing our full research report, it’s free.
Omnicom Group (OMC) Q4 CY2025 Highlights:
- Revenue: $5.53 billion vs analyst estimates of $4.50 billion (27.9% year-on-year growth, 22.8% beat)
- Adjusted EPS: $2.59 vs analyst expectations of $2.94 (11.8% miss)
- Adjusted EBITDA: $928.9 million vs analyst estimates of $1.27 billion (16.8% margin, 27.1% miss)
- Operating Margin: -17.7%, down from 15.9% in the same quarter last year
- Market Capitalization: $21.39 billion
"Since the successful closing of the Interpublic acquisition on November 26, we made key leadership and brand announcements, refreshed our enterprise growth strategy, and launched the next generation of our Omni data and technology platform," said John Wren, Chairman and Chief Executive Officer of Omnicom.
Company Overview
With a vast network of creative agencies that helped craft some of the most memorable ad campaigns in history, Omnicom Group (NYSE: OMC) is a strategic holding company that provides advertising, marketing, and communications services to many of the world's largest companies.
Revenue Growth
Reviewing a company’s long-term sales performance reveals insights into its quality. Even a bad business can shine for one or two quarters, but a top-tier one grows for years.
With $17.27 billion in revenue over the past 12 months, Omnicom Group is a behemoth in the business services sector and benefits from economies of scale, giving it an edge in distribution. This also enables it to gain more leverage on its fixed costs than smaller competitors and the flexibility to offer lower prices.
As you can see below, Omnicom Group’s sales grew at a decent 5.6% compounded annual growth rate over the last five years. This shows its offerings generated slightly more demand than the average business services company, a useful starting point for our analysis.
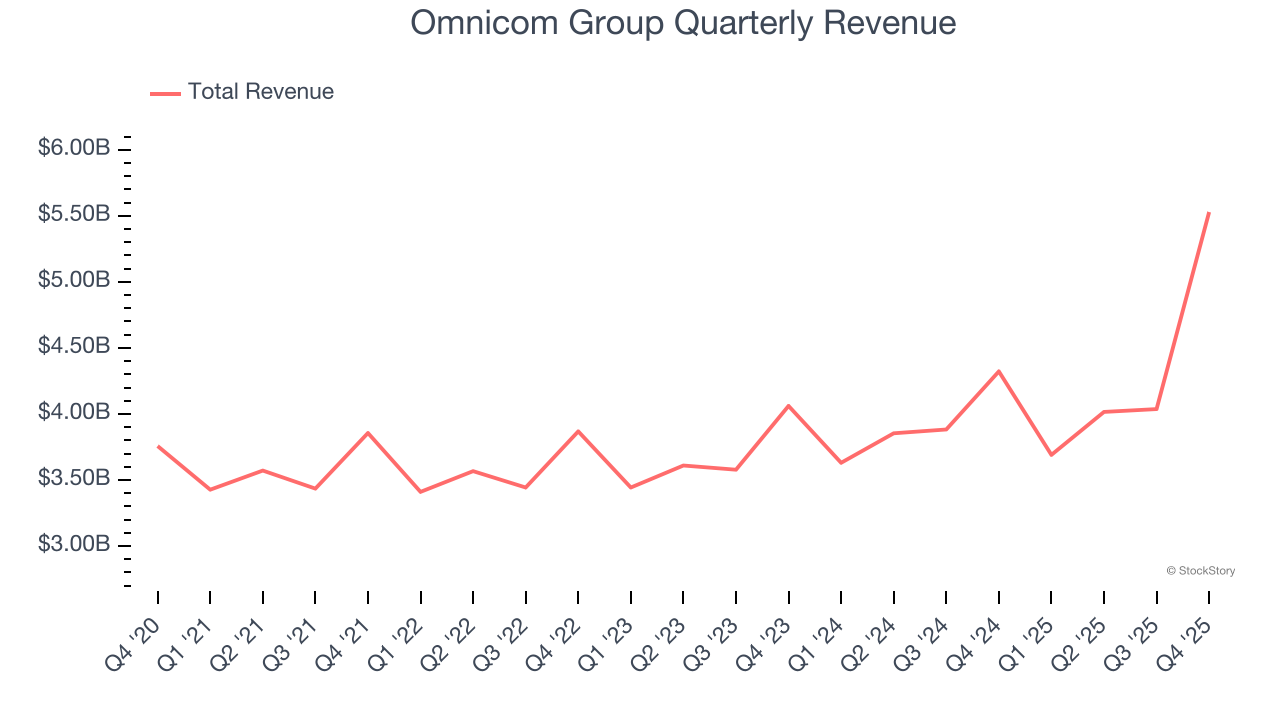
Long-term growth is the most important, but within business services, a half-decade historical view may miss new innovations or demand cycles. Omnicom Group’s annualized revenue growth of 8.4% over the last two years is above its five-year trend, suggesting its demand recently accelerated. 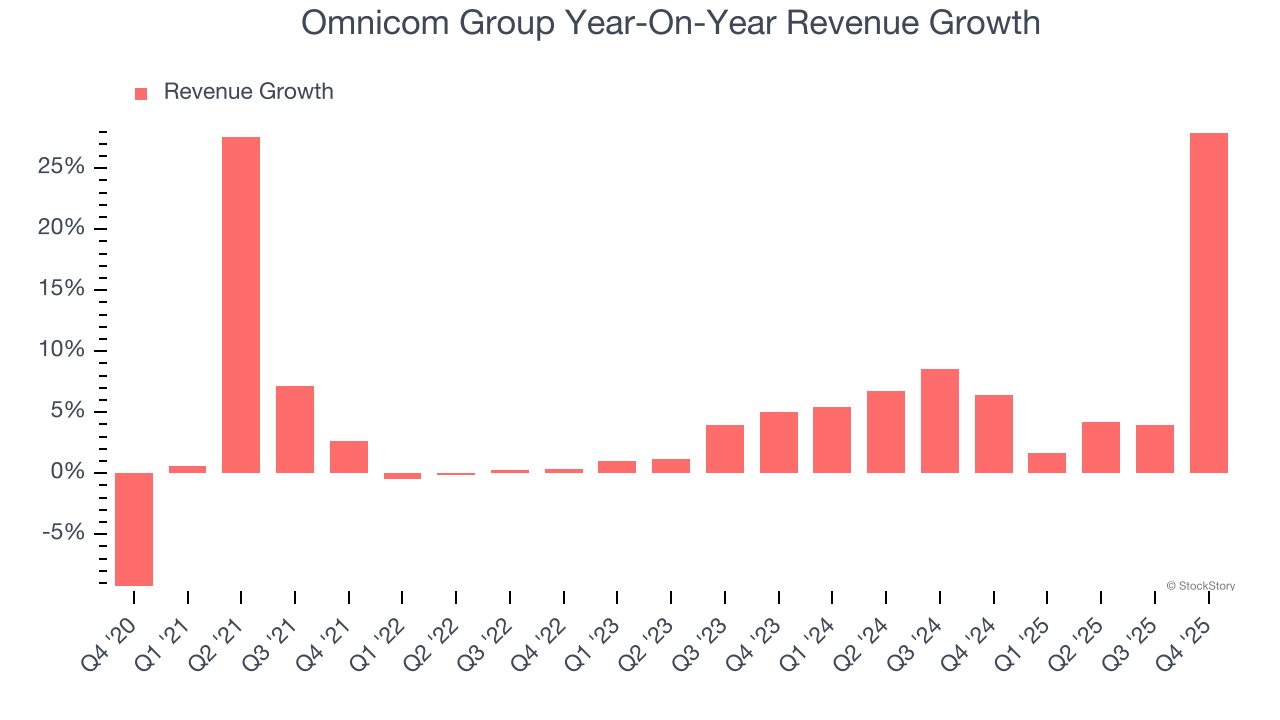
This quarter, Omnicom Group reported robust year-on-year revenue growth of 27.9%, and its $5.53 billion of revenue topped Wall Street estimates by 22.8%.
Looking ahead, sell-side analysts expect revenue to grow 55.4% over the next 12 months, an improvement versus the last two years. This projection is eye-popping for a company of its scale and indicates its newer products and services will fuel better top-line performance.
Software is eating the world and there is virtually no industry left that has been untouched by it. That drives increasing demand for tools helping software developers do their jobs, whether it be monitoring critical cloud infrastructure, integrating audio and video functionality, or ensuring smooth content streaming. Click here to access a free report on our 3 favorite stocks to play this generational megatrend.
Operating Margin
Operating margin is a key measure of profitability. Think of it as net income - the bottom line - excluding the impact of taxes and interest on debt, which are less connected to business fundamentals.
Omnicom Group has done a decent job managing its cost base over the last five years. The company has produced an average operating margin of 11.9%, higher than the broader business services sector.
Looking at the trend in its profitability, Omnicom Group’s operating margin decreased by 12.8 percentage points over the last five years. This raises questions about the company’s expense base because its revenue growth should have given it leverage on its fixed costs, resulting in better economies of scale and profitability.
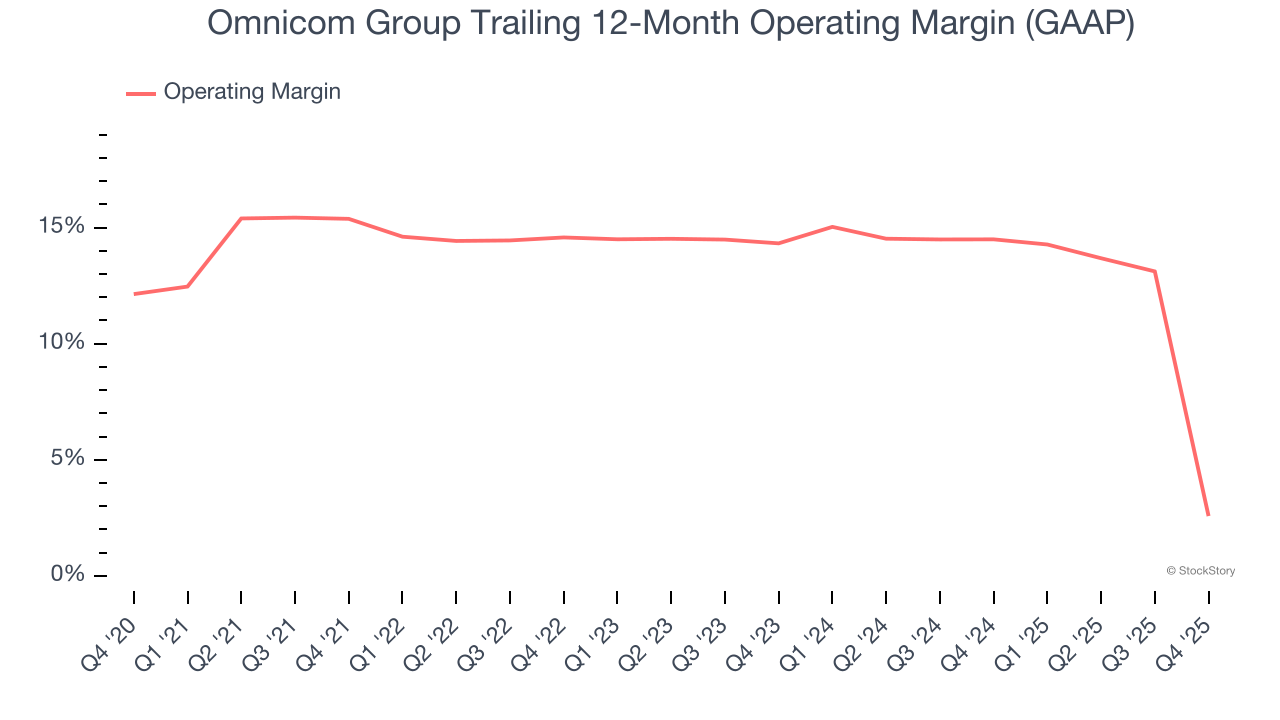
This quarter, Omnicom Group generated an operating margin profit margin of negative 17.7%, down 33.5 percentage points year on year. This contraction shows it was less efficient because its expenses grew faster than its revenue.
Earnings Per Share
Revenue trends explain a company’s historical growth, but the long-term change in earnings per share (EPS) points to the profitability of that growth – for example, a company could inflate its sales through excessive spending on advertising and promotions.
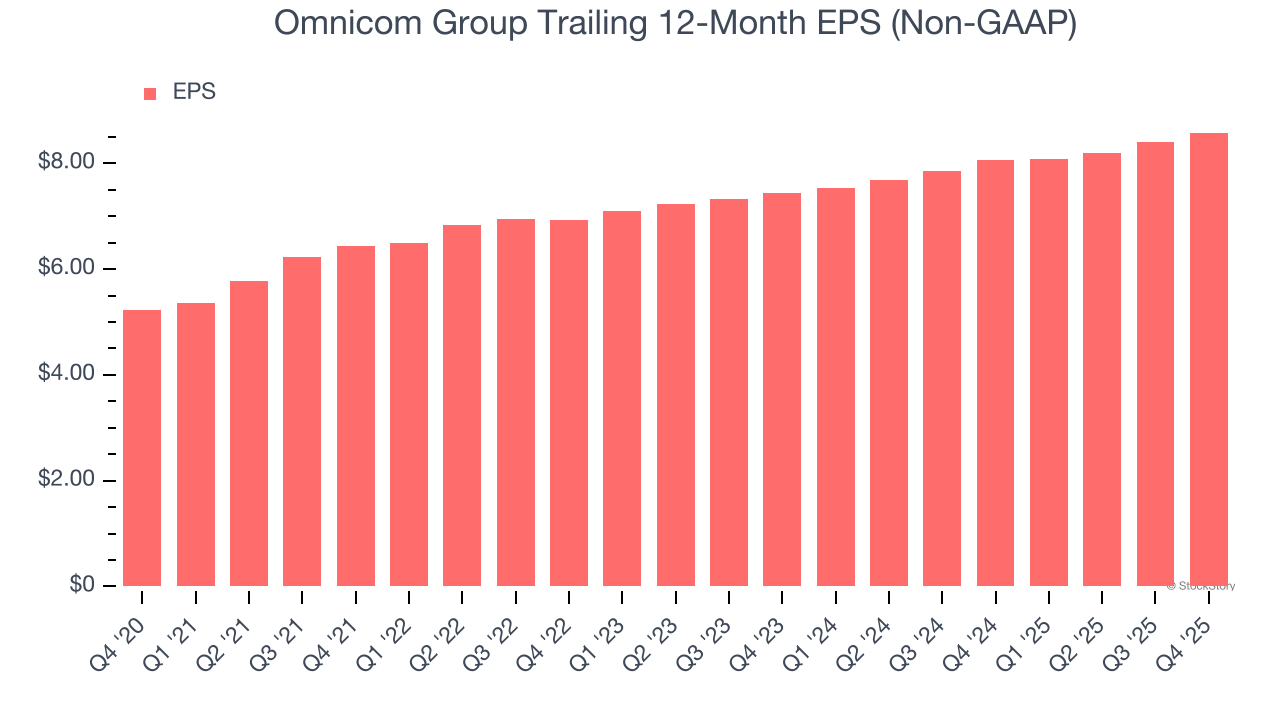
Omnicom Group’s EPS grew at a solid 10.4% compounded annual growth rate over the last five years, higher than its 5.6% annualized revenue growth. However, we take this with a grain of salt because its operating margin didn’t improve and it didn’t repurchase its shares, meaning the delta came from reduced interest expenses or taxes.
Like with revenue, we analyze EPS over a shorter period to see if we are missing a change in the business.
For Omnicom Group, its two-year annual EPS growth of 7.5% was lower than its five-year trend. We hope its growth can accelerate in the future.
In Q4, Omnicom Group reported adjusted EPS of $2.59, up from $2.41 in the same quarter last year. Despite growing year on year, this print missed analysts’ estimates, but we care more about long-term adjusted EPS growth than short-term movements. Over the next 12 months, Wall Street expects Omnicom Group’s full-year EPS of $8.58 to grow 18.3%.
Key Takeaways from Omnicom Group’s Q4 Results
We were impressed by how significantly Omnicom Group blew past analysts’ revenue expectations this quarter. On the other hand, its EPS missed. Overall, this was a softer quarter. The stock remained flat at $71.52 immediately after reporting.
So should you invest in Omnicom Group right now? If you’re making that decision, you should consider the bigger picture of valuation, business qualities, as well as the latest earnings. We cover that in our actionable full research report which you can read here (it’s free).


