Diagnostics company Guardant Health (NASDAQ: GH) reported Q4 CY2025 results topping the market’s revenue expectations, with sales up 39.4% year on year to $281.3 million. The company’s full-year revenue guidance of $1.27 billion at the midpoint came in 1.8% above analysts’ estimates. Its non-GAAP loss of $0.50 per share was 6.5% below analysts’ consensus estimates.
Is now the time to buy Guardant Health? Find out by accessing our full research report, it’s free.
Guardant Health (GH) Q4 CY2025 Highlights:
- Revenue: $281.3 million vs analyst estimates of $271.7 million (39.4% year-on-year growth, 3.5% beat)
- Adjusted EPS: -$0.50 vs analyst expectations of -$0.47 (6.5% miss)
- Adjusted EBITDA: -$64.91 million (-23.1% margin, 17.2% year-on-year growth)
- Operating Margin: -43%, up from -62.4% in the same quarter last year
- Free Cash Flow was -$54.22 million compared to -$83.39 million in the same quarter last year
- Market Capitalization: $13.84 billion
“We delivered an outstanding end to a great year, with fourth quarter revenue growth of 39% year-over-year,” said Helmy Eltoukhy, co-founder and co-CEO.
Company Overview
Pioneering the field of "liquid biopsy" with technology that can identify cancer-specific genetic mutations from a simple blood draw, Guardant Health (NASDAQ: GH) develops blood tests that detect and monitor cancer by analyzing tumor DNA in the bloodstream, helping doctors make treatment decisions without invasive biopsies.
Revenue Growth
Examining a company’s long-term performance can provide clues about its quality. Any business can have short-term success, but a top-tier one grows for years. Luckily, Guardant Health’s sales grew at an exceptional 27.9% compounded annual growth rate over the last five years. Its growth beat the average healthcare company and shows its offerings resonate with customers.
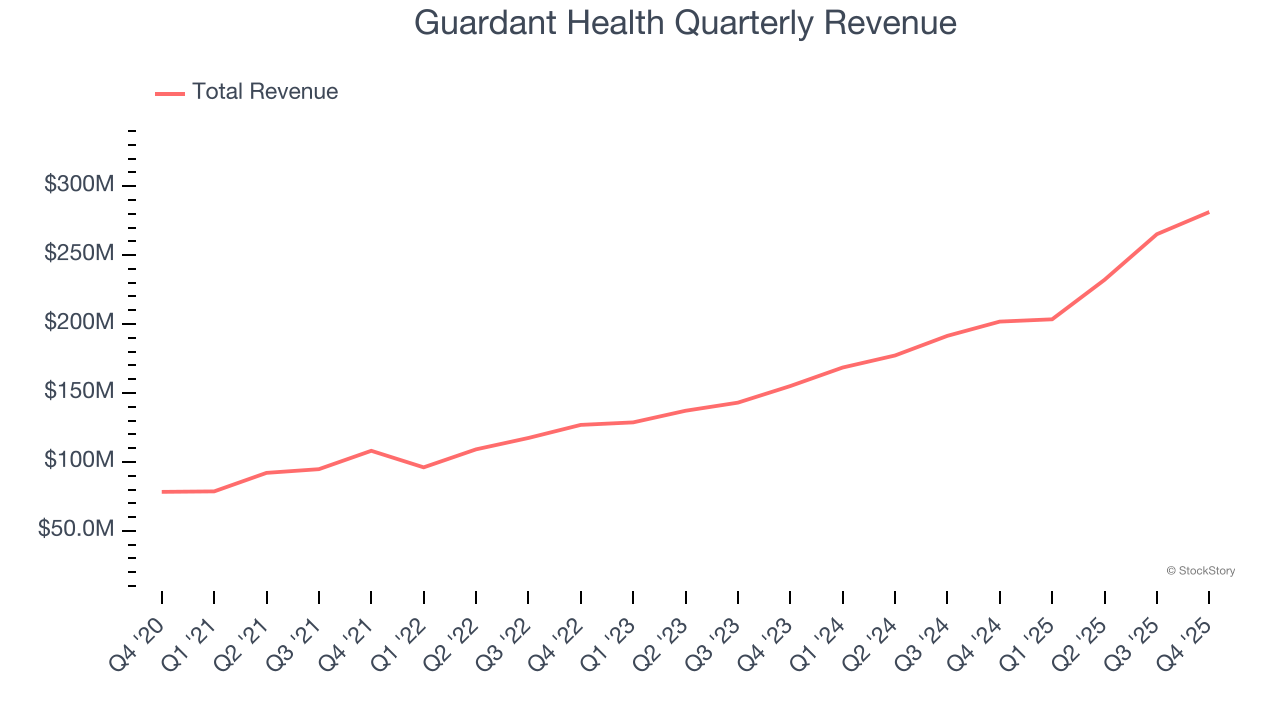
Long-term growth is the most important, but within healthcare, a half-decade historical view may miss new innovations or demand cycles. Guardant Health’s annualized revenue growth of 32% over the last two years is above its five-year trend, suggesting its demand was strong and recently accelerated. 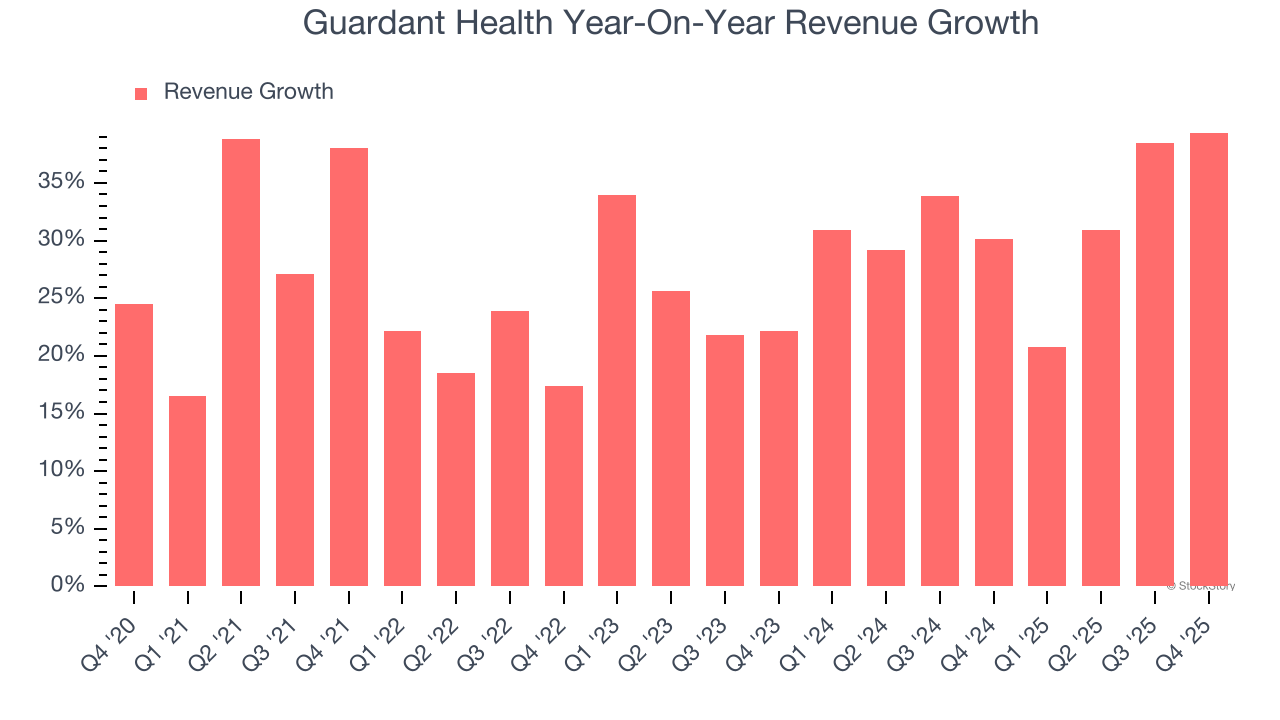
This quarter, Guardant Health reported wonderful year-on-year revenue growth of 39.4%, and its $281.3 million of revenue exceeded Wall Street’s estimates by 3.5%.
Looking ahead, sell-side analysts expect revenue to grow 26.6% over the next 12 months, a deceleration versus the last two years. Still, this projection is admirable and implies the market is baking in success for its products and services.
Microsoft, Alphabet, Coca-Cola, Monster Beverage—all began as under-the-radar growth stories riding a massive trend. We’ve identified the next one: a profitable AI semiconductor play Wall Street is still overlooking. Go here for access to our full report.
Operating Margin
Operating margin is an important measure of profitability as it shows the portion of revenue left after accounting for all core expenses – everything from the cost of goods sold to advertising and wages. It’s also useful for comparing profitability across companies with different levels of debt and tax rates because it excludes interest and taxes.
Guardant Health’s high expenses have contributed to an average operating margin of negative 77.2% over the last five years. Unprofitable healthcare companies require extra attention because they could get caught swimming naked when the tide goes out. It’s hard to trust that the business can endure a full cycle.
On the plus side, Guardant Health’s operating margin rose by 65.5 percentage points over the last five years, as its sales growth gave it operating leverage. Zooming in on its more recent performance, we can see the company’s trajectory is intact as its margin has also increased by 55.6 percentage points on a two-year basis. These data points are very encouraging and show momentum is on its side.
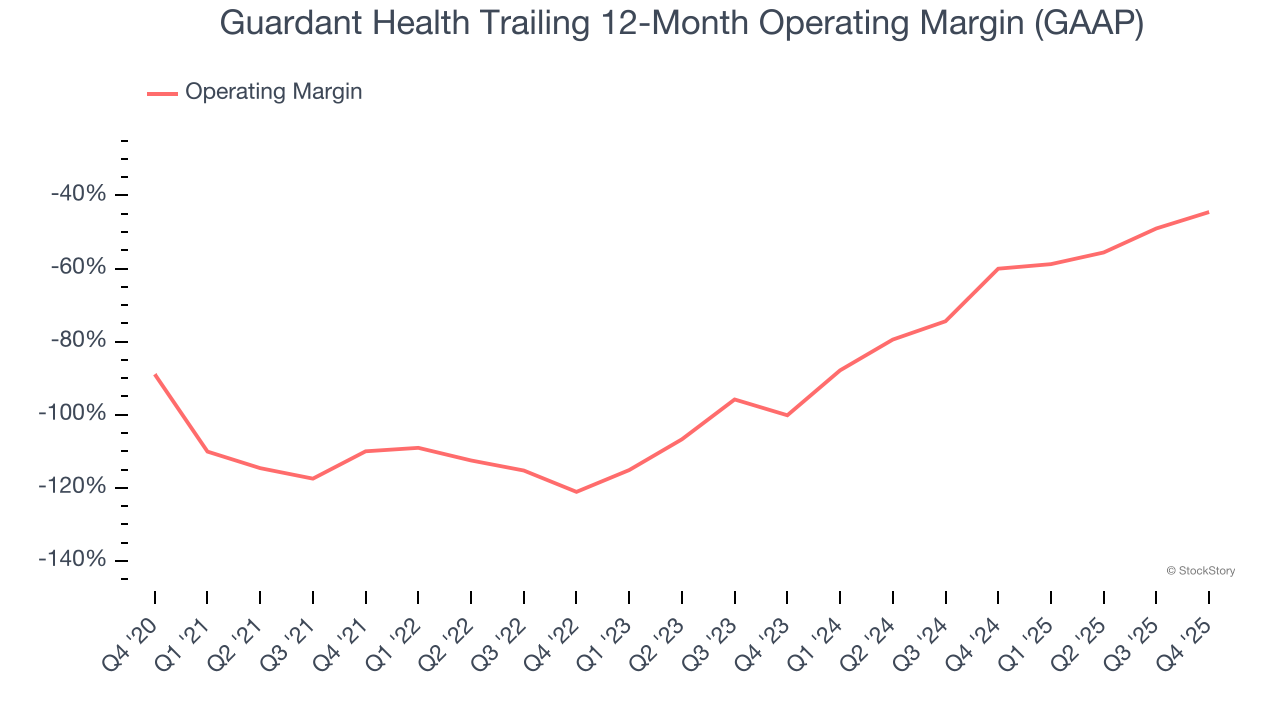
This quarter, Guardant Health generated a negative 43% operating margin.
Earnings Per Share
We track the long-term change in earnings per share (EPS) for the same reason as long-term revenue growth. Compared to revenue, however, EPS highlights whether a company’s growth is profitable.
Although Guardant Health’s full-year earnings are still negative, it reduced its losses and improved its EPS by 6.7% annually over the last five years. The next few quarters will be critical for assessing its long-term profitability. We hope to see an inflection point soon.
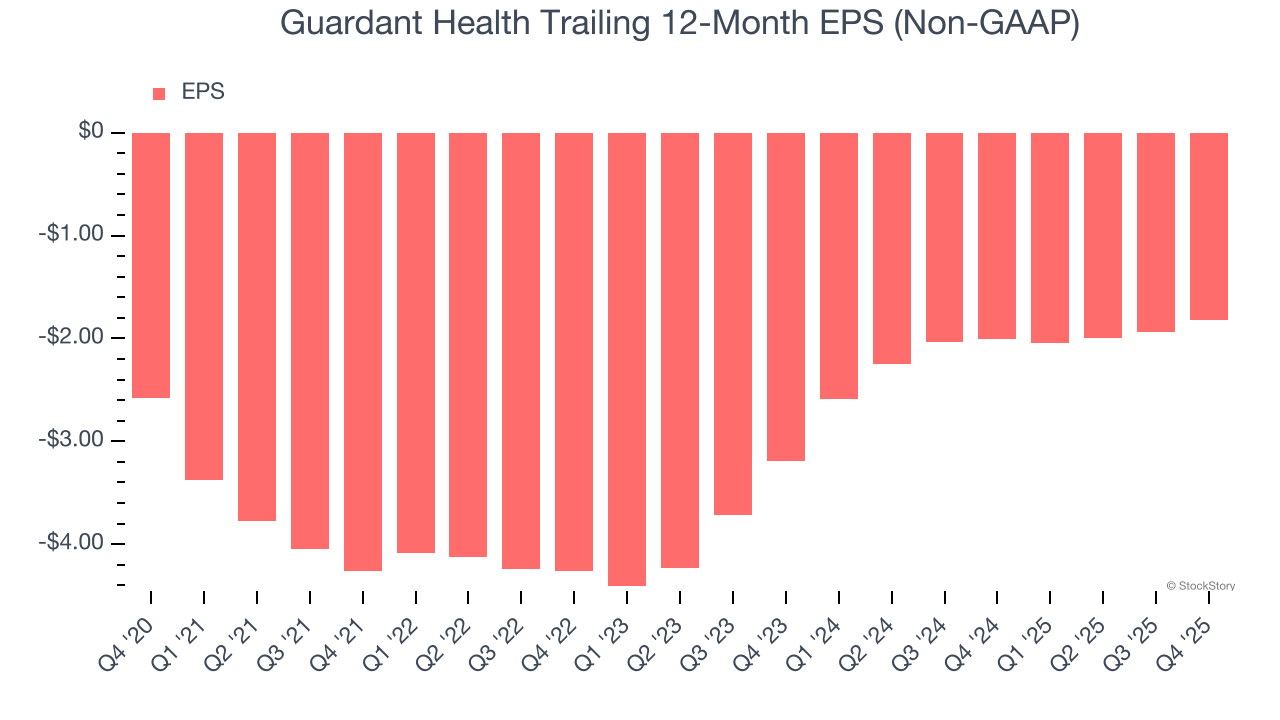
In Q4, Guardant Health reported adjusted EPS of negative $0.50, up from negative $0.62 in the same quarter last year. Despite growing year on year, this print missed analysts’ estimates. Over the next 12 months, Wall Street expects Guardant Health to improve its earnings losses. Analysts forecast its full-year EPS of negative $1.82 will advance to negative $1.44.
Key Takeaways from Guardant Health’s Q4 Results
We enjoyed seeing Guardant Health beat analysts’ revenue expectations this quarter. We were also glad its full-year revenue guidance exceeded Wall Street’s estimates. On the other hand, its EPS missed. Overall, this print had some key positives. The stock traded up 2.6% to $109.16 immediately after reporting.
Guardant Health may have had a good quarter, but does that mean you should invest right now? We think that the latest quarter is only one piece of the longer-term business quality puzzle. Quality, when combined with valuation, can help determine if the stock is a buy. We cover that in our actionable full research report which you can read here (it’s free).