Healthcare tech company GoodRx (NASDAQ: GDRX) reported Q4 CY2025 results exceeding the market’s revenue expectations, but sales fell by 1.9% year on year to $194.8 million. On the other hand, the company’s full-year revenue guidance of $765 million at the midpoint came in 6.2% below analysts’ estimates. Its non-GAAP profit of $0.09 per share was in line with analysts’ consensus estimates.
Is now the time to buy GoodRx? Find out by accessing our full research report, it’s free.
GoodRx (GDRX) Q4 CY2025 Highlights:
- Revenue: $194.8 million vs analyst estimates of $193.2 million (1.9% year-on-year decline, 0.8% beat)
- Adjusted EPS: $0.09 vs analyst estimates of $0.09 (in line)
- Adjusted EBITDA: $65.02 million vs analyst estimates of $64.81 million (33.4% margin, in line)
- EBITDA guidance for the upcoming financial year 2026 is $230 million at the midpoint, below analyst estimates of $282.1 million
- Operating Margin: 11.6%, up from 9.2% in the same quarter last year
- Free Cash Flow was -$38.85 million, down from $44.58 million in the same quarter last year
- Customers: 5.3 million, down from 5.4 million in the previous quarter
- Market Capitalization: $804.5 million
Company Overview
Started in 2011 to tackle the problem of high prescription drug costs in America, GoodRx (NASDAQ: GDRX) operates a digital platform that helps consumers find lower prices on prescription medications through price comparison tools and discount codes.
Revenue Growth
A company’s long-term sales performance is one signal of its overall quality. Any business can experience short-term success, but top-performing ones enjoy sustained growth for years. Over the last five years, GoodRx grew its sales at a decent 7.7% compounded annual growth rate. Its growth was slightly above the average healthcare company and shows its offerings resonate with customers.
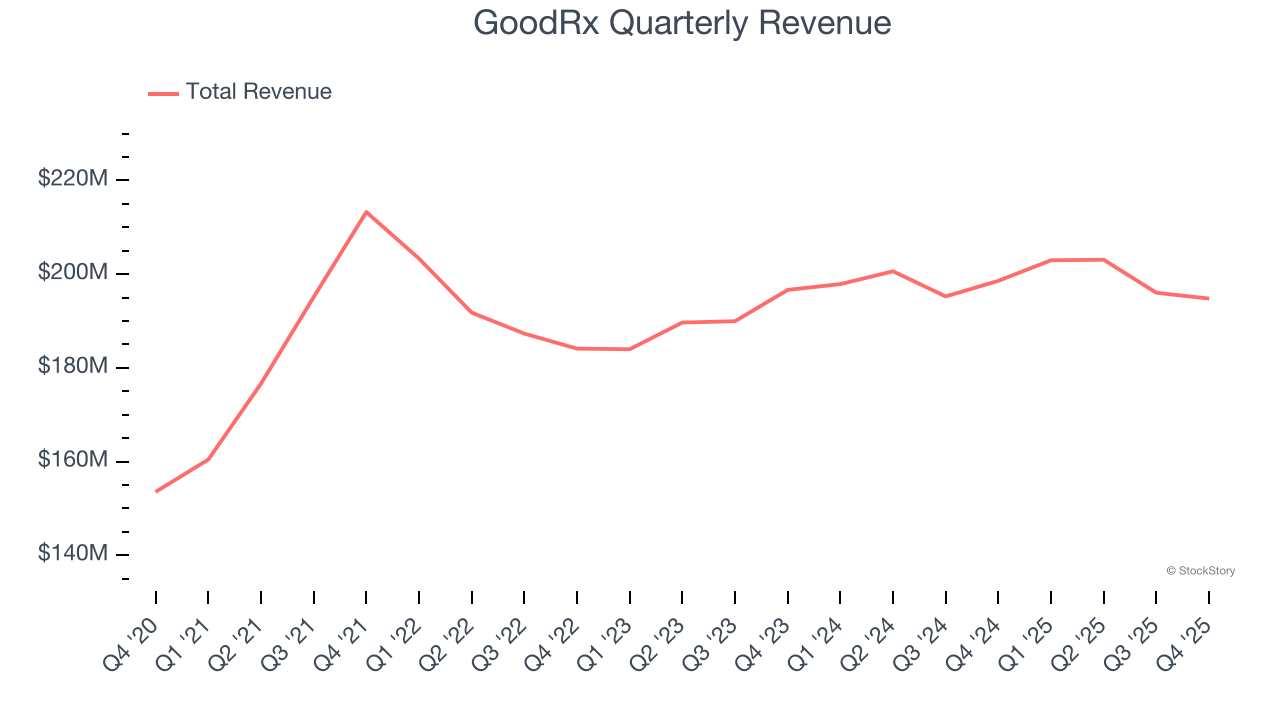
Long-term growth is the most important, but within healthcare, a half-decade historical view may miss new innovations or demand cycles. GoodRx’s recent performance shows its demand has slowed as its annualized revenue growth of 2.4% over the last two years was below its five-year trend. We’re wary when companies in the sector see decelerations in revenue growth, as it could signal changing consumer tastes aided by low switching costs. 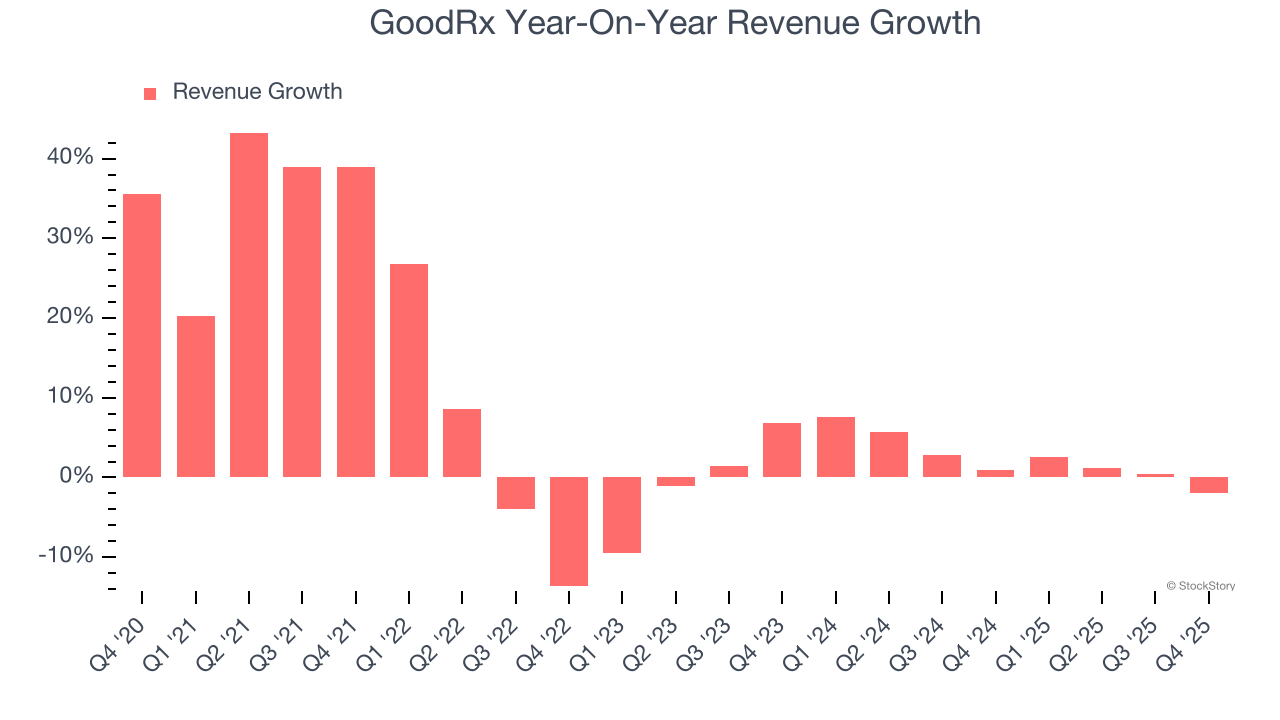
GoodRx also reports its number of customers, which reached 5.3 million in the latest quarter. Over the last two years, GoodRx’s customer base averaged 9.5% year-on-year declines. Because this number is lower than its revenue growth, we can see the average customer spent more money each year on the company’s products and services. 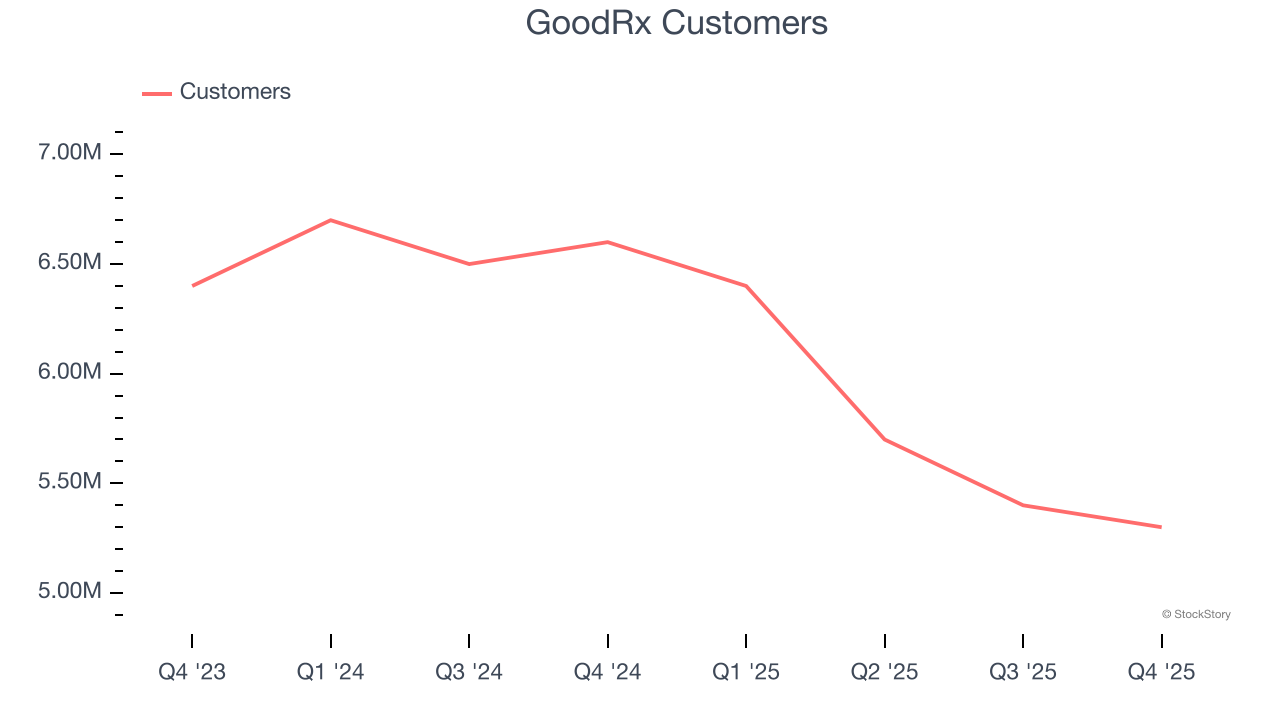
This quarter, GoodRx’s revenue fell by 1.9% year on year to $194.8 million but beat Wall Street’s estimates by 0.8%.
Looking ahead, sell-side analysts expect revenue to grow 2.2% over the next 12 months, similar to its two-year rate. This projection doesn't excite us and suggests its newer products and services will not accelerate its top-line performance yet.
While Wall Street chases Nvidia at all-time highs, an under-the-radar semiconductor supplier is dominating a critical AI component these giants can’t build without. Click here to access our free report one of our favorites growth stories.
Adjusted Operating Margin
Adjusted operating margin is an important measure of profitability as it shows the portion of revenue left after accounting for all core expenses – everything from the cost of goods sold to advertising and wages. It’s also useful for comparing profitability across companies because it excludes non-recurring expenses, interest on debt, and taxes.
GoodRx has been an efficient company over the last five years. It was one of the more profitable businesses in the healthcare sector, boasting an average adjusted operating margin of 25.1%.
Looking at the trend in its profitability, GoodRx’s adjusted operating margin decreased by 3.9 percentage points over the last five years, but it rose by 1.8 percentage points on a two-year basis. Still, shareholders will want to see GoodRx become more profitable in the future.
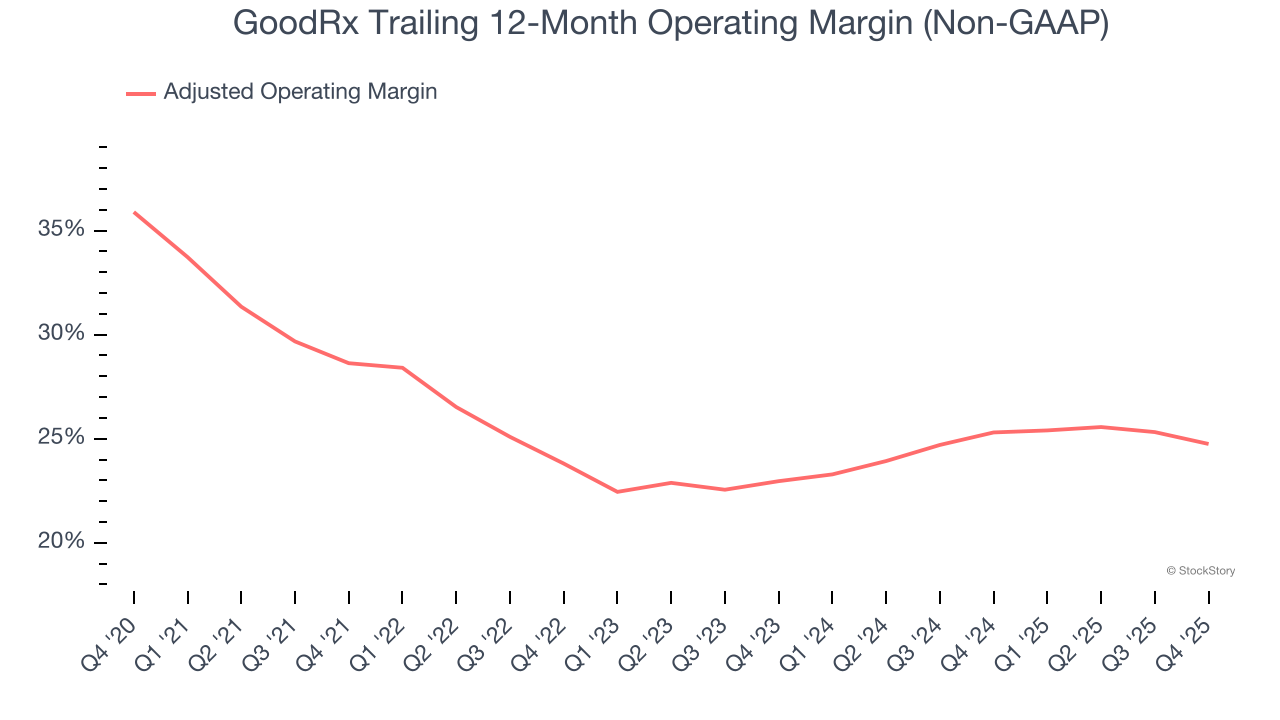
This quarter, GoodRx generated an adjusted operating margin profit margin of 23.3%, down 2.3 percentage points year on year. This contraction shows it was less efficient because its expenses increased relative to its revenue.
Earnings Per Share
Revenue trends explain a company’s historical growth, but the long-term change in earnings per share (EPS) points to the profitability of that growth – for example, a company could inflate its sales through excessive spending on advertising and promotions.
GoodRx’s flat EPS over the last five years was below its 7.7% annualized revenue growth. This tells us the company became less profitable on a per-share basis as it expanded due to non-fundamental factors such as interest expenses and taxes.
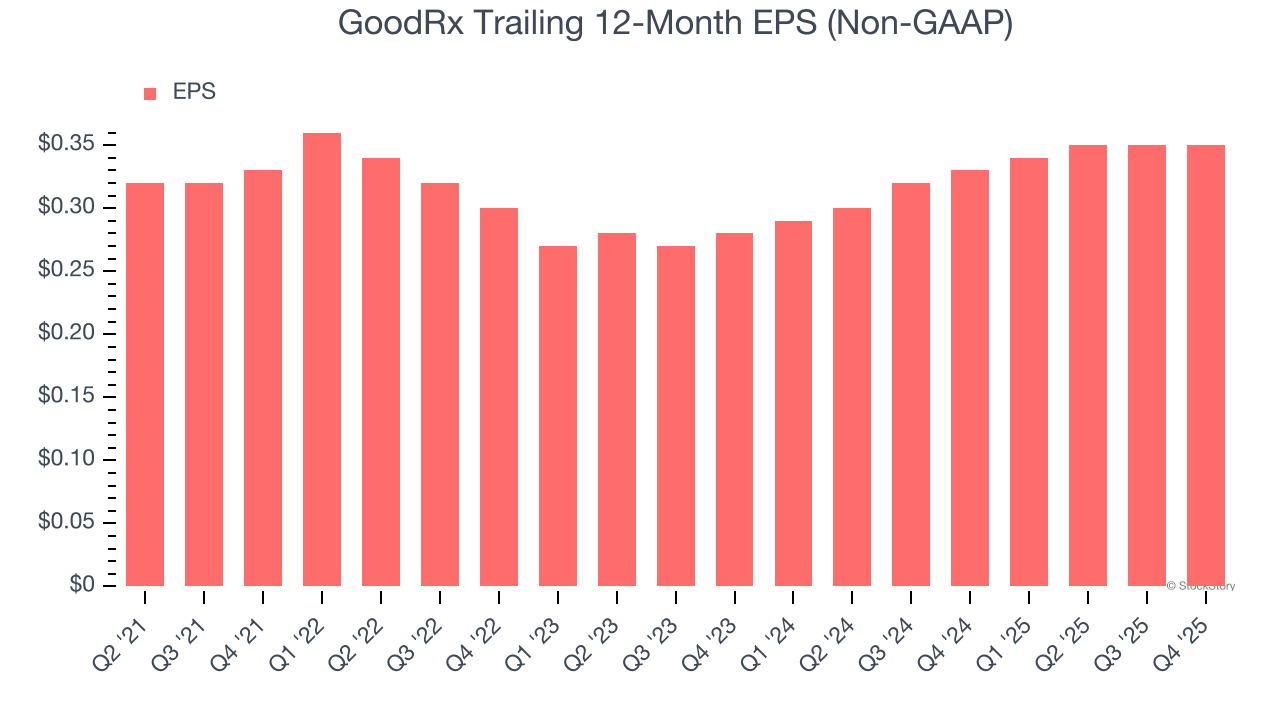
Diving into the nuances of GoodRx’s earnings can give us a better understanding of its performance. As we mentioned earlier, GoodRx’s adjusted operating margin declined by 3.9 percentage points over the last five years. This was the most relevant factor (aside from the revenue impact) behind its lower earnings; interest expenses and taxes can also affect EPS but don’t tell us as much about a company’s fundamentals.
In Q4, GoodRx reported adjusted EPS of $0.09, in line with the same quarter last year. This print slightly missed analysts’ estimates. Over the next 12 months, Wall Street expects GoodRx’s full-year EPS of $0.35 to grow 21.3%.
Key Takeaways from GoodRx’s Q4 Results
It was good to see GoodRx narrowly top analysts’ revenue expectations this quarter. On the other hand, its full-year revenue guidance missed and its full-year EBITDA guidance fell short of Wall Street’s estimates. Overall, this was a weaker quarter. The stock traded down 11.8% to $2.18 immediately following the results.
GoodRx underperformed this quarter, but does that create an opportunity to invest right now? When making that decision, it’s important to consider its valuation, business qualities, as well as what has happened in the latest quarter. We cover that in our actionable full research report which you can read here (it’s free).


