Agricultural and farm machinery company Lindsay (NYSE: LNN) missed Wall Street’s revenue expectations in Q1 CY2026, with sales falling 15.7% year on year to $157.7 million. Its GAAP profit of $1.15 per share was 31.8% below analysts’ consensus estimates.
Is now the time to buy Lindsay? Find out by accessing our full research report, it’s free.
Lindsay (LNN) Q1 CY2026 Highlights:
- Revenue: $157.7 million vs analyst estimates of $164.6 million (15.7% year-on-year decline, 4.2% miss)
- EPS (GAAP): $1.15 vs analyst expectations of $1.69 (31.8% miss)
- Adjusted EBITDA: $20.52 million vs analyst estimates of $25.73 million (13% margin, 20.2% miss)
- Operating Margin: 8.3%, down from 17.2% in the same quarter last year
- Free Cash Flow Margin: 7.3%, up from 1.3% in the same quarter last year
- Market Capitalization: $1.22 billion
“During the quarter we began shipping the large project in the Middle East North Africa (MENA) region. While this project remains on schedule, we are exercising caution and prioritizing the safety of our teams in the region," said Randy Wood, President and Chief Executive Officer.
Company Overview
A pioneer in the field of center pivot and lateral move irrigation, Lindsay (NYSE: LNN) provides a variety of proprietary water management and road infrastructure products and services.
Revenue Growth
Examining a company’s long-term performance can provide clues about its quality. Even a bad business can shine for one or two quarters, but a top-tier one grows for years. Unfortunately, Lindsay’s 4.8% annualized revenue growth over the last five years was tepid. This fell short of our benchmark for the industrials sector and is a tough starting point for our analysis.
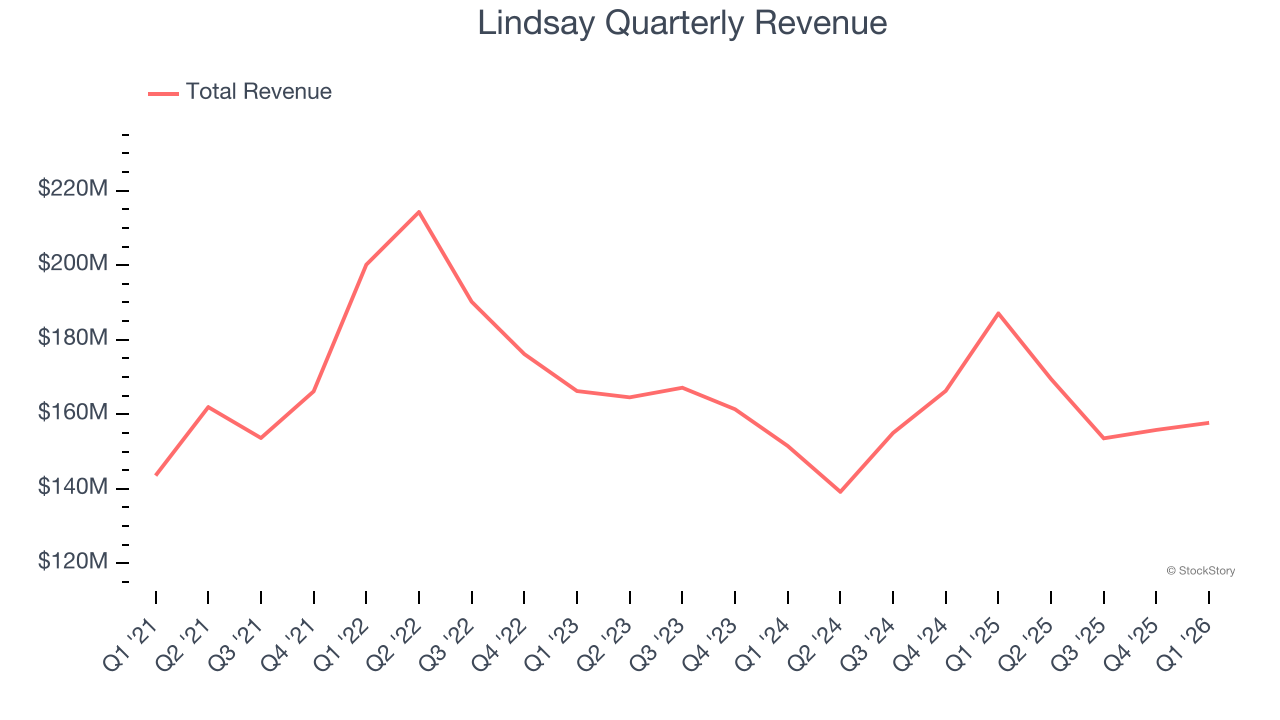
We at StockStory place the most emphasis on long-term growth, but within industrials, a half-decade historical view may miss cycles, industry trends, or a company capitalizing on catalysts such as a new contract win or a successful product line. Lindsay’s recent performance shows its demand has slowed as its revenue was flat over the last two years. 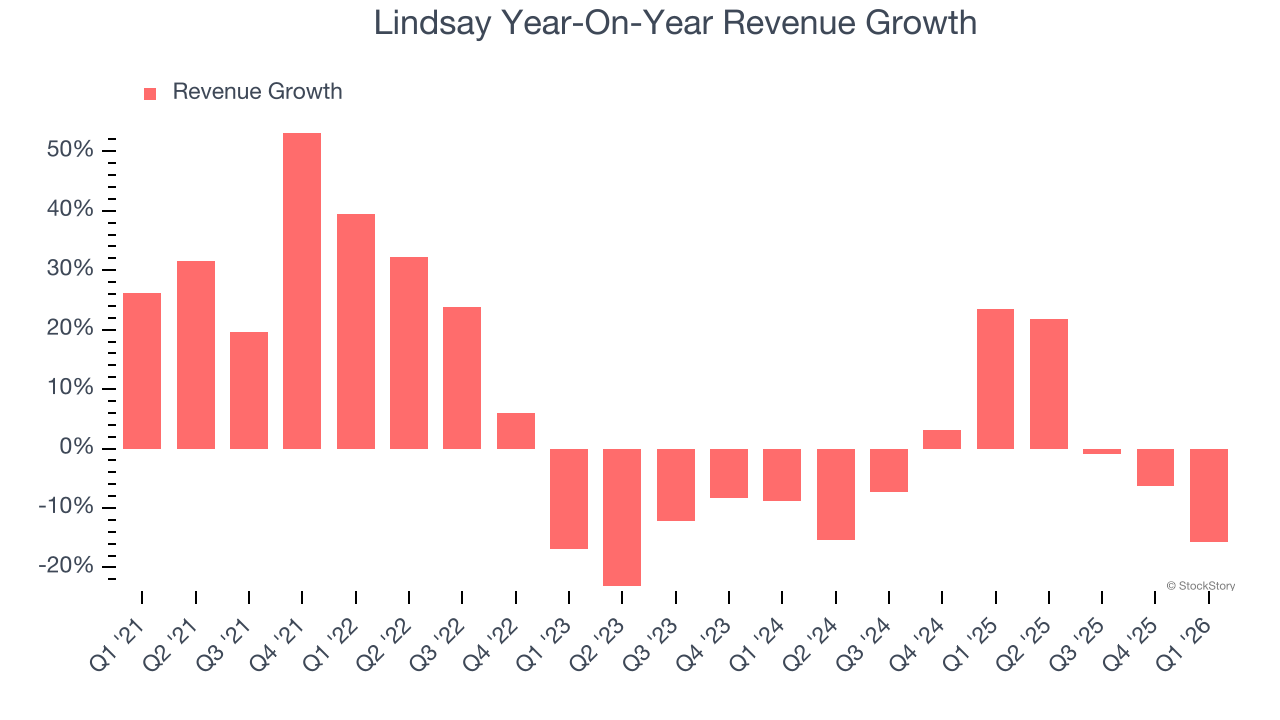
This quarter, Lindsay missed Wall Street’s estimates and reported a rather uninspiring 15.7% year-on-year revenue decline, generating $157.7 million of revenue.
Looking ahead, sell-side analysts expect revenue to grow 6.1% over the next 12 months. While this projection indicates its newer products and services will catalyze better top-line performance, it is still below average for the sector.
ONE MORE THING: 3 Hidden Platforms Growing 3X Faster than Amazon, Google, and PayPal. Amazon, Google, and Meta all followed the same playbook: Dominate an ignored market. Build an unbeatable moat. Scale until you’re unstoppable.
These three platforms are running that exact playbook right now. The early investors in Amazon made fortunes. The early investors in these could do the same. Get All 3 Stocks Here for FREE.
Operating Margin
Operating margin is one of the best measures of profitability because it tells us how much money a company takes home after procuring and manufacturing its products, marketing and selling those products, and most importantly, keeping them relevant through research and development.
Lindsay has been an efficient company over the last five years. It was one of the more profitable businesses in the industrials sector, boasting an average operating margin of 12.7%. This result was particularly impressive because of its low gross margin, which is mostly a factor of what it sells and takes huge shifts to move meaningfully. Companies have more control over their operating margins, and it’s a show of well-managed operations if they’re high when gross margins are low.
Looking at the trend in its profitability, Lindsay’s operating margin rose by 1.5 percentage points over the last five years, as its sales growth gave it operating leverage.
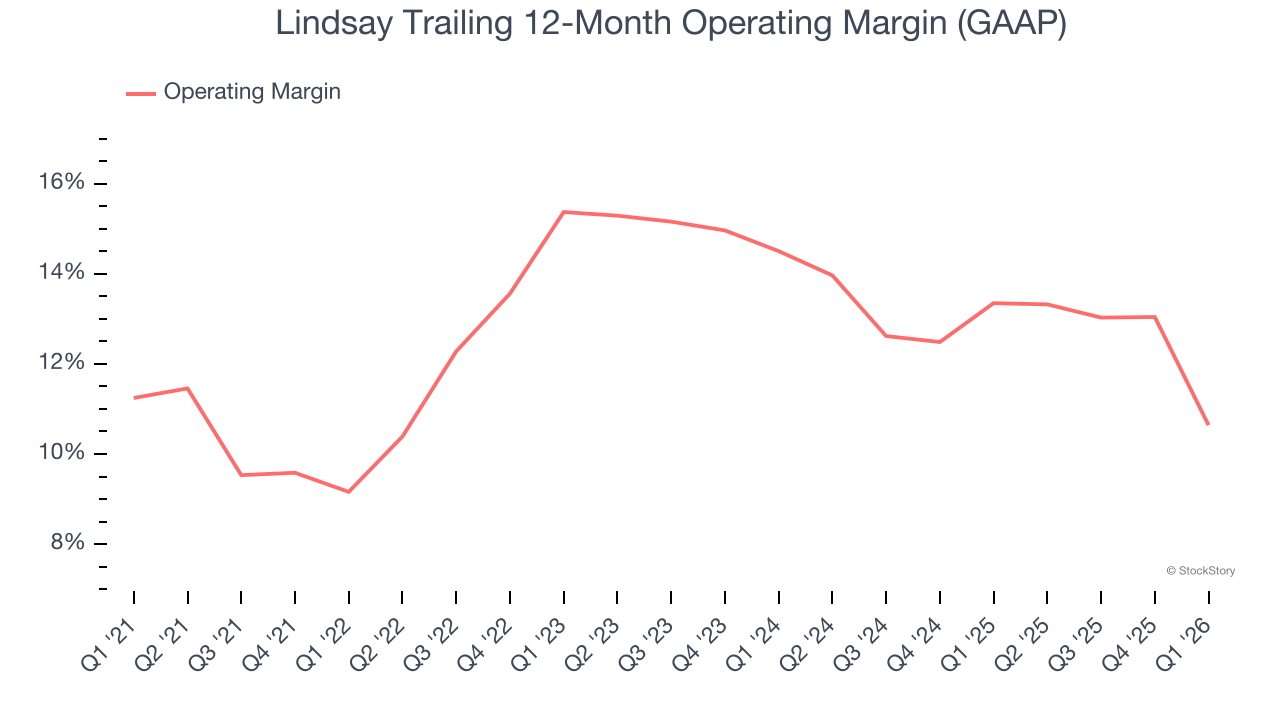
This quarter, Lindsay generated an operating margin profit margin of 8.3%, down 8.9 percentage points year on year. Since Lindsay’s operating margin decreased more than its gross margin, we can assume it was less efficient because expenses such as marketing, R&D, and administrative overhead increased.
Earnings Per Share
We track the long-term change in earnings per share (EPS) for the same reason as long-term revenue growth. Compared to revenue, however, EPS highlights whether a company’s growth is profitable.
Lindsay’s unimpressive 6.4% annual EPS growth over the last five years aligns with its revenue performance. On the bright side, this tells us its incremental sales were profitable.
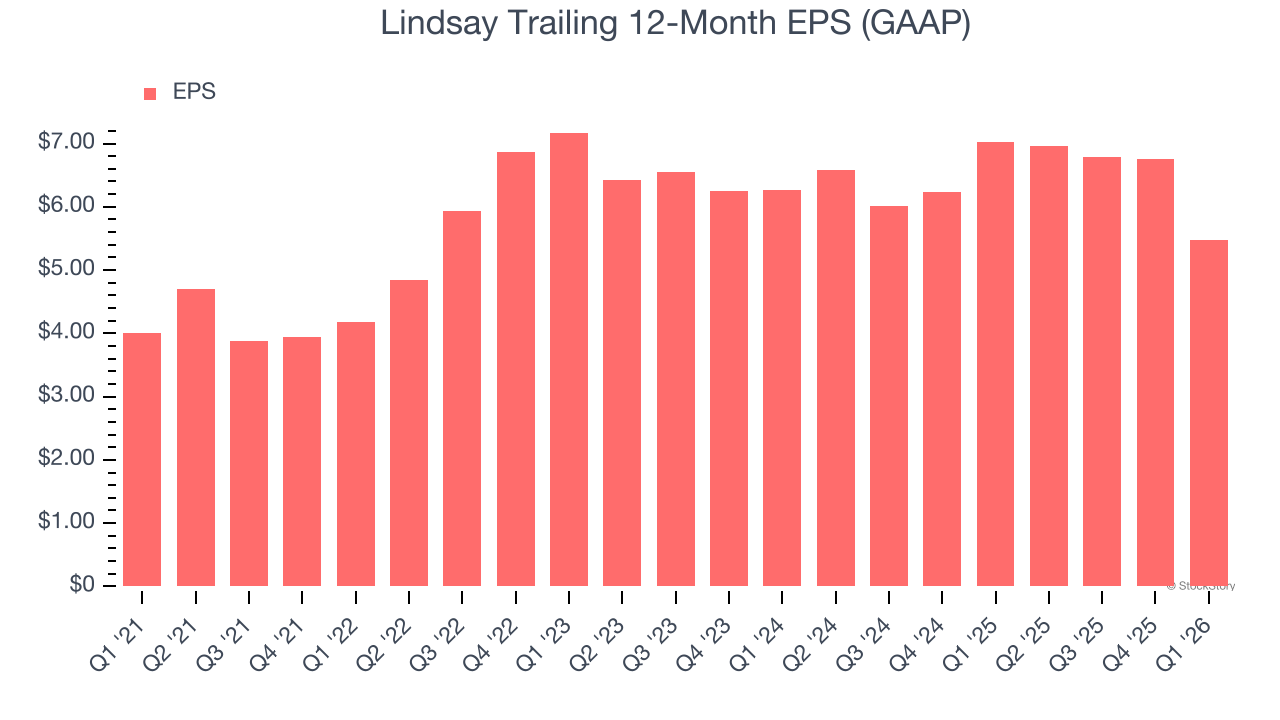
Like with revenue, we analyze EPS over a more recent period because it can provide insight into an emerging theme or development for the business.
Lindsay’s two-year annual EPS declines of 6.5% were bad and lower than its flat revenue.
Diving into the nuances of Lindsay’s earnings can give us a better understanding of its performance. Lindsay’s operating margin has declined over the last two years. This was the most relevant factor (aside from the revenue impact) behind its lower earnings; interest expenses and taxes can also affect EPS but don’t tell us as much about a company’s fundamentals.
In Q1, Lindsay reported EPS of $1.15, down from $2.44 in the same quarter last year. This print missed analysts’ estimates. Over the next 12 months, Wall Street expects Lindsay’s full-year EPS of $5.47 to grow 26.4%.
Key Takeaways from Lindsay’s Q1 Results
We struggled to find many positives in these results. Its revenue missed and its EBITDA fell short of Wall Street’s estimates. Overall, this quarter could have been better. The stock traded down 5.1% to $111.13 immediately following the results.
Lindsay’s latest earnings report disappointed. One quarter doesn’t define a company’s quality, so let’s explore whether the stock is a buy at the current price. What happened in the latest quarter matters, but not as much as longer-term business quality and valuation, when deciding whether to invest in this stock. We cover that in our actionable full research report which you can read here (it’s free).