
Coal mining company Peabody Energy (NYSE: BTU) beat Wall Street’s revenue expectations in Q1 CY2026, with sales up 3.9% year on year to $973.3 million. Its GAAP loss of $0.27 per share was significantly below analysts’ consensus estimates.
Is now the time to buy Peabody Energy? Find out by accessing our full research report, it’s free.
Peabody Energy (BTU) Q1 CY2026 Highlights:
- Revenue: $973.3 million vs analyst estimates of $964.4 million (3.9% year-on-year growth, 0.9% beat)
- EPS (GAAP): -$0.27 vs analyst estimates of $0.08 (significant miss)
- Adjusted EBITDA: $65.3 million vs analyst estimates of $129.5 million (6.7% margin, 49.6% miss)
- Operating Margin: -4.5%, down from 3.4% in the same quarter last year
- Free Cash Flow was -$55.4 million, down from $49.5 million in the same quarter last year
- Other production: down -26.6% year on year
- Market Capitalization: $3.23 billion
"Amid volatility in global energy markets, our thermal segments benefited from strong demand and higher realized pricing," said President and Chief Executive Officer Jim Grech.
Company Overview
Beginning with a single wagon hauling coal in Illinois back when Grover Cleveland was president, Peabody Energy (NYSE: BTU) mines coal used by electricity generators and steel manufacturers.
Revenue Growth
Cyclical industries such as Energy can make mediocre companies look great for a time, but a long-term view reveals which businesses can actually withstand and adapt to changing conditions. Regrettably, Peabody Energy’s sales grew at a tepid 7.7% compounded annual growth rate over the last five years. This fell short of our benchmark for the energy upstream and integrated energy sector and is a rough starting point for our analysis.
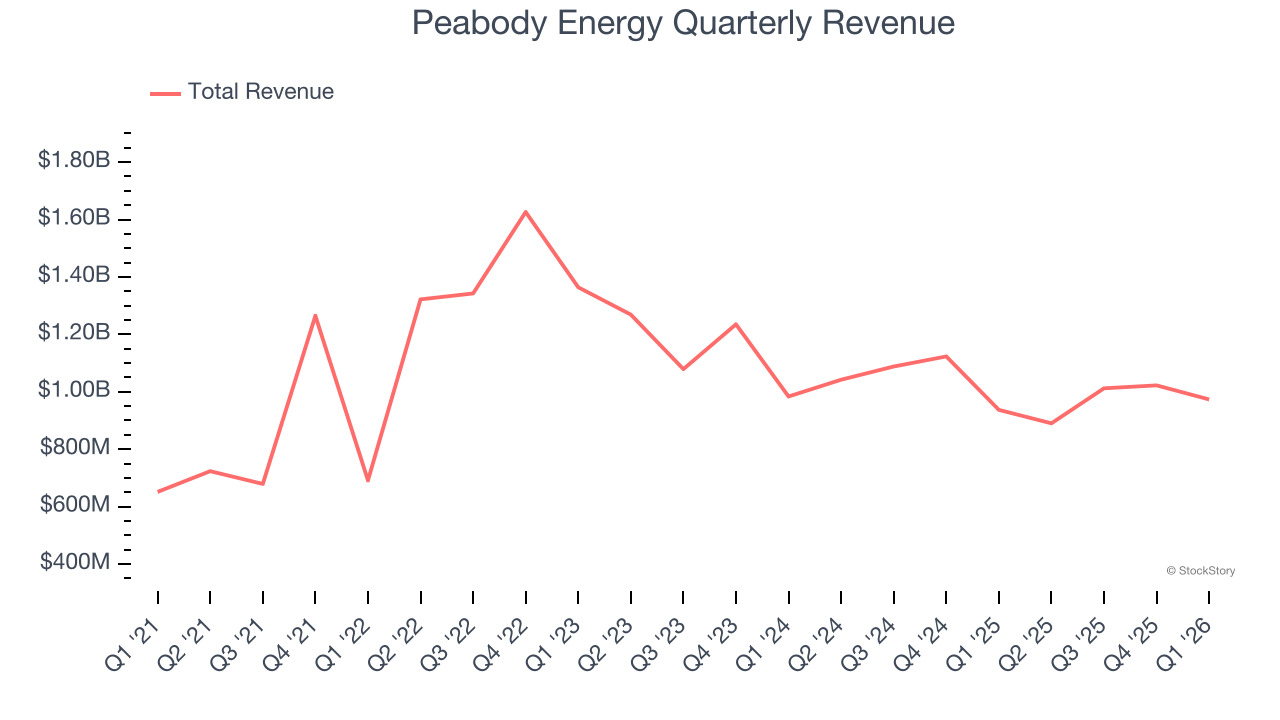
Even a long stretch in Energy can be shaped by a single commodity cycle, so extending the view to ten years adds another perspective and reveals which companies are built to grow regardless of the pricing regime. Peabody Energy’s performance shows it grew in the past five-year but relinquished its gains over the last ten years, as its revenue fell by 2.7% annually.
While looking at revenue is important, it can also introduce noise around commodity prices and M&A. Analyzing drivers of revenue, on the other hand, highlights what is happening inside the asset base and whether the economic footprint of a company is expanding. Over the last two years, Peabody Energy’s other production averaged 2.2% year-on-year declines. 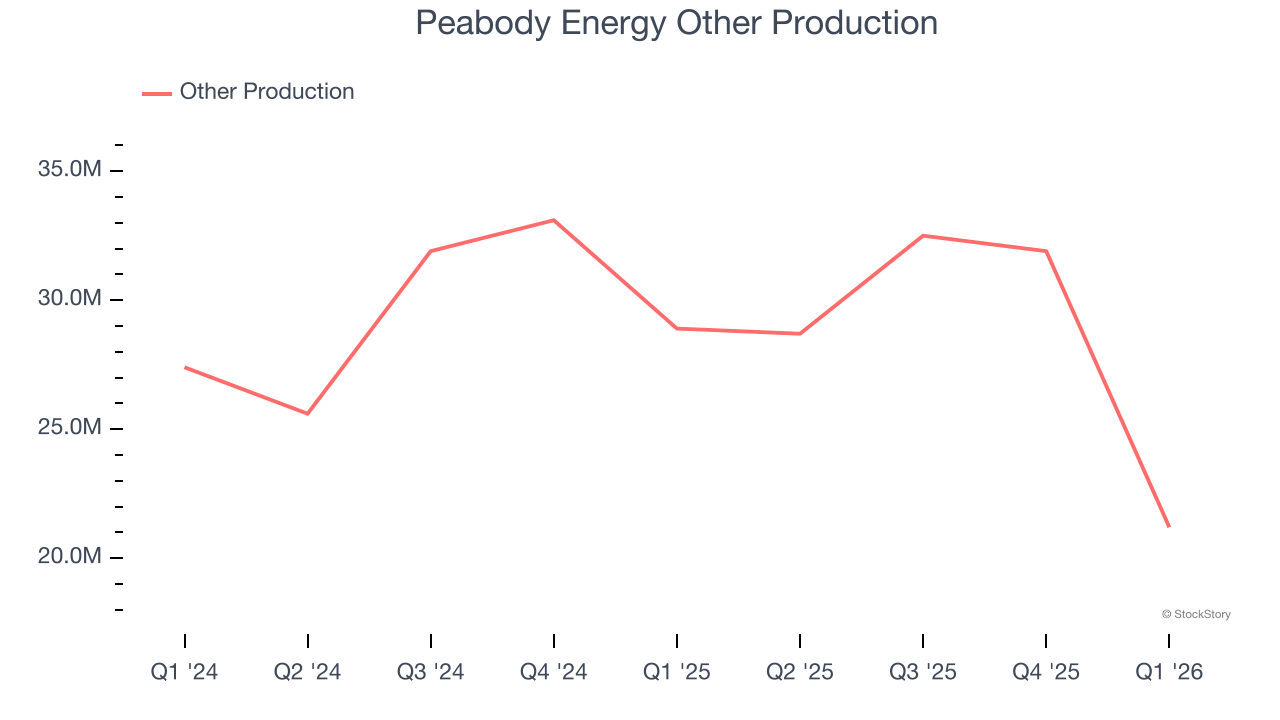
This quarter, Peabody Energy reported modest year-on-year revenue growth of 3.9% but beat Wall Street’s estimates by 0.9%. This quarter, Peabody Energy’s Other production fell by 26.6% year on year.
ALSO WORTH WATCHING: Nvidia’s Quiet Partner. Nvidia’s chips cost a hundred grand. The connectors that make them work cost even more. One company makes them all.
Every AI server needs specialized infrastructure the chip companies don’t make. High-speed cables. Power connectors. Thermal sensors. This 90-year-old company built a monopoly on it. The AI boom just started. This stock is still flying under the radar. Claim The Stock Ticker Here for FREE.
Adjusted EBITDA Margin
Adjusted EBITDA margin captures the true operating profitability of an energy producer by removing accounting noise around depletion and capitalized drilling costs. It reveals how much cash the asset base generates before capital structure and reinvestment requirements shape reported earnings.
Peabody Energy was profitable over the last five years but held back by its large cost base. Its average EBITDA margin of 25.2% was weak for an upstream and integrated energy business.
Looking at the trend in its profitability, Peabody Energy’s EBITDA margin decreased by 25.6 percentage points over the last year. Peabody Energy’s performance was poor no matter how you look at it - it shows that costs were rising and it couldn’t pass them onto its customers.
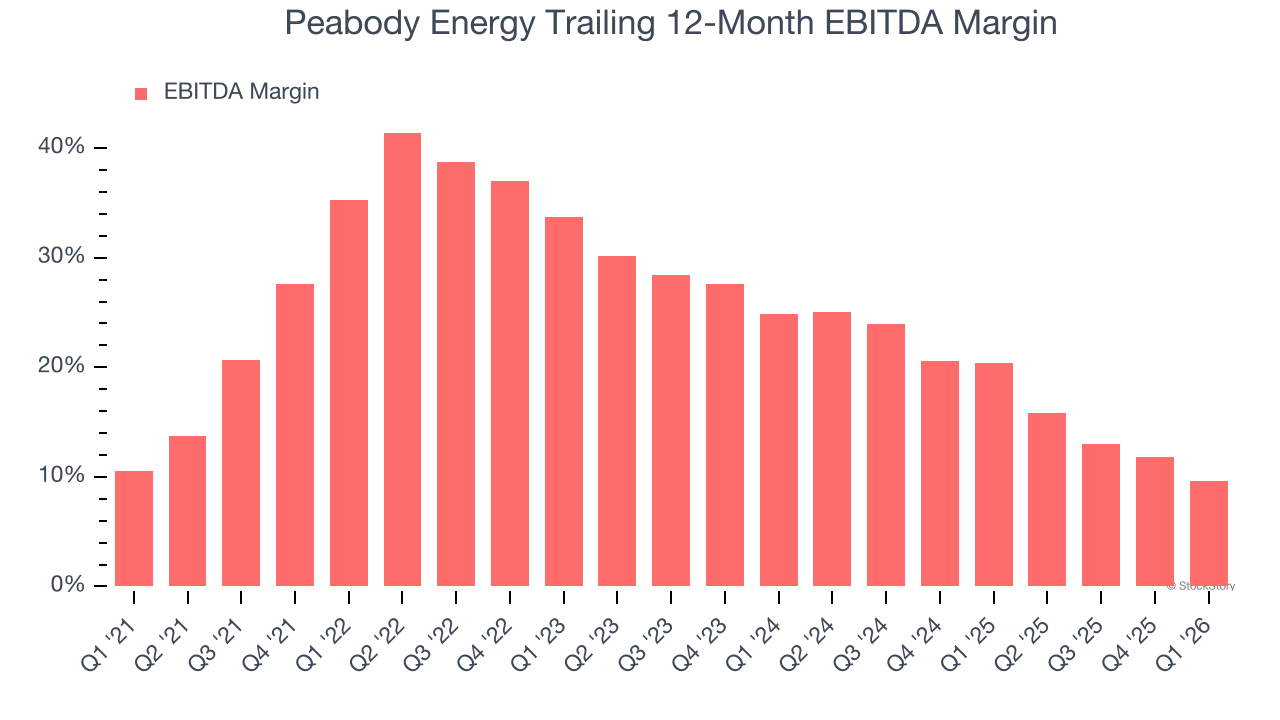
This quarter, Peabody Energy generated an EBITDA margin profit margin of 6.7%, down 8.7 percentage points year on year. This contraction shows it was less efficient because its expenses grew faster than its revenue. This adjusted EBITDA fell short of Wall Street’s estimates.
Cash Is King
As mentioned above, adjusted EBITDA ignores capital structure and drilling expenditure decisions. These are two huge aspects of an Energy producer, so in order to understand a comprehensive picture of business quality, an investor needs to account for these. Said differently, adjusted EBITDA margins could be solid but free cash flow is abysmal because decline rates of the asset are extreme and the drilling is expensive. Free cash flow tells you about not only the economics of the production that has happened but how much it costs to stay in business as well (further drilling or extraction).
Peabody Energy has shown decent cash profitability, giving it some flexibility to reinvest or return capital to investors. The company’s free cash flow margin averaged 8.9% over the last five years, slightly better than the broader energy upstream and integrated energy sector.
While the level of free cash flow margins is important, their consistency matters just as much.
Peabody Energy’s ratio of quarterly free cash flow volatility to WTI crude price volatility over the past five years was 15.5 (lower is better), indicating that its cash generation is far more sensitive to commodity-price swings than most peers. This elevated volatility limits its access to capital in downturns and makes it unlikely to act as a consolidator when weaker competitors come under pressure.
You may be asking why we wait until the free cash flow line to perform this stability analysis versus commodity prices. Why not compare revenue or EBITDA to WTI Crude prices in the case of Peabody Energy? Because what ultimately matters is not how much revenue or profit you earn when prices are high but how much cash you can generate when prices are low. Free cash flow is the superior metric because it includes everything from hedging prowess to growth and maintenance capex to management behavior during good times and bad.
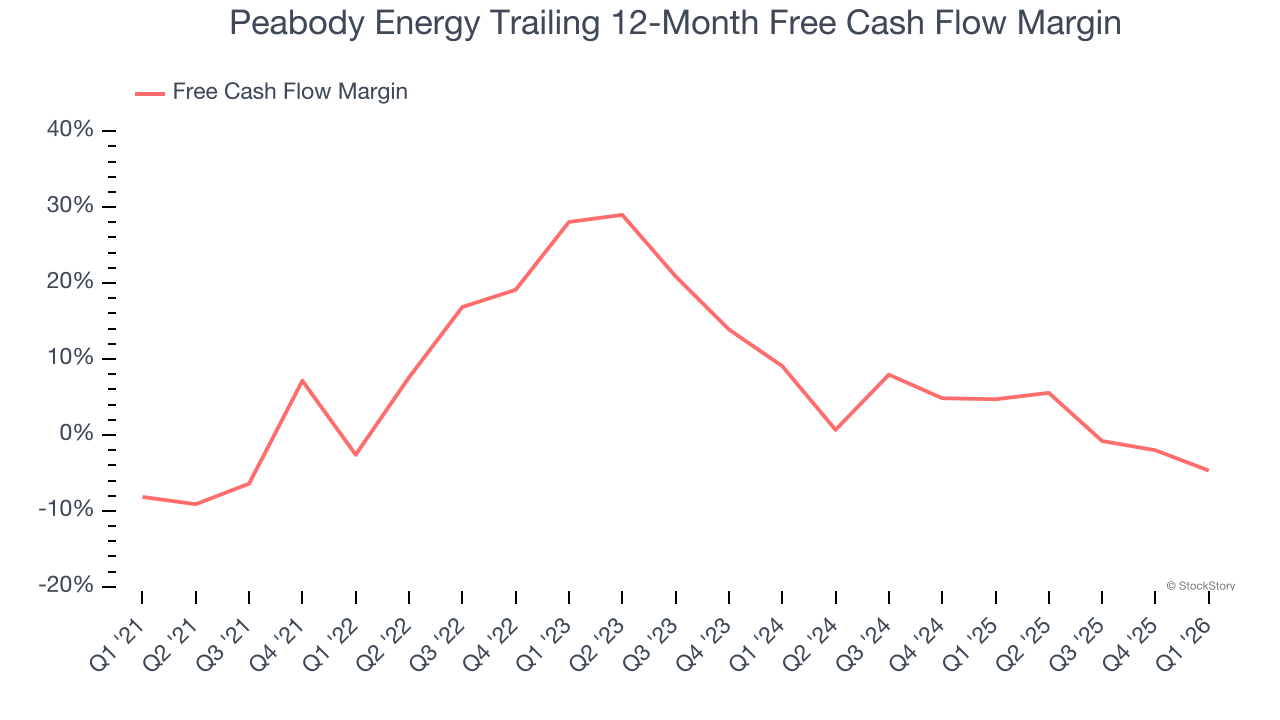
Peabody Energy burned through $55.4 million of cash in Q1, equivalent to a negative 5.7% margin. The company’s cash flow turned negative after being positive in the same quarter last year, suggesting its historical struggles have dragged on.
Key Takeaways from Peabody Energy’s Q1 Results
We struggled to find many positives in these results. Its EBITDA missed and its EPS fell short of Wall Street’s estimates. Overall, this was a softer quarter. The stock traded down 10% to $23.88 immediately after reporting.
Peabody Energy didn’t show it’s best hand this quarter, but does that create an opportunity to buy the stock right now? We think that the latest quarter is only one piece of the longer-term business quality puzzle. Quality, when combined with valuation, can help determine if the stock is a buy. We cover that in our actionable full research report which you can read here (it’s free).


