
Investment banking firm Jefferies Financial Group (NYSE: JEF) missed Wall Street’s revenue expectations in Q2 CY2026, but sales rose 35% year on year to $2.21 billion. Its GAAP profit of $1.02 per share was 2.8% above analysts’ consensus estimates.
Is now the time to buy Jefferies? Find out by accessing our full research report, it’s free.
Jefferies (JEF) Q2 CY2026 Highlights:
- Revenue: $2.21 billion vs analyst estimates of $2.28 billion (35% year-on-year growth, 3.1% miss)
- Pre-tax Profit: $315.5 million (14.3% margin)
- EPS (GAAP): $1.02 vs analyst estimates of $0.99 (2.8% beat)
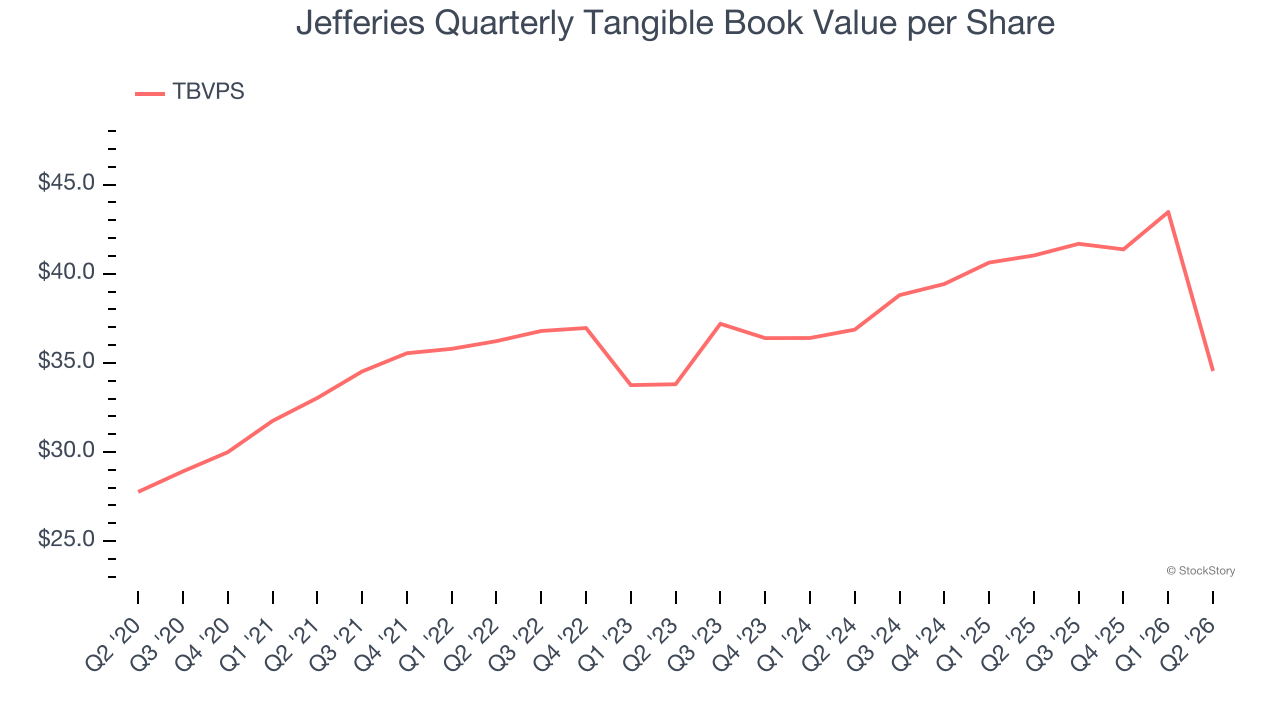
- Tangible Book Value per Share: $34.55 vs analyst estimates of $34.85 (15.8% year-on-year decline, 0.9% miss)
- Market Capitalization: $12.2 billion
Company Overview
Tracing its roots back to 1962 and rebranded from Leucadia National Corporation in 2018, Jefferies Financial Group (NYSE: JEF) is a global investment banking and capital markets firm that provides advisory services, securities trading, and asset management to corporations, institutions, and wealthy individuals.
Revenue Growth
Reviewing a company’s long-term sales performance reveals insights into its quality. Any business can put up a good quarter or two, but many enduring ones grow for years. Over the last five years, Jefferies grew its revenue at a weak 1.1% compounded annual growth rate. This was below our standards and is a poor baseline for our analysis.
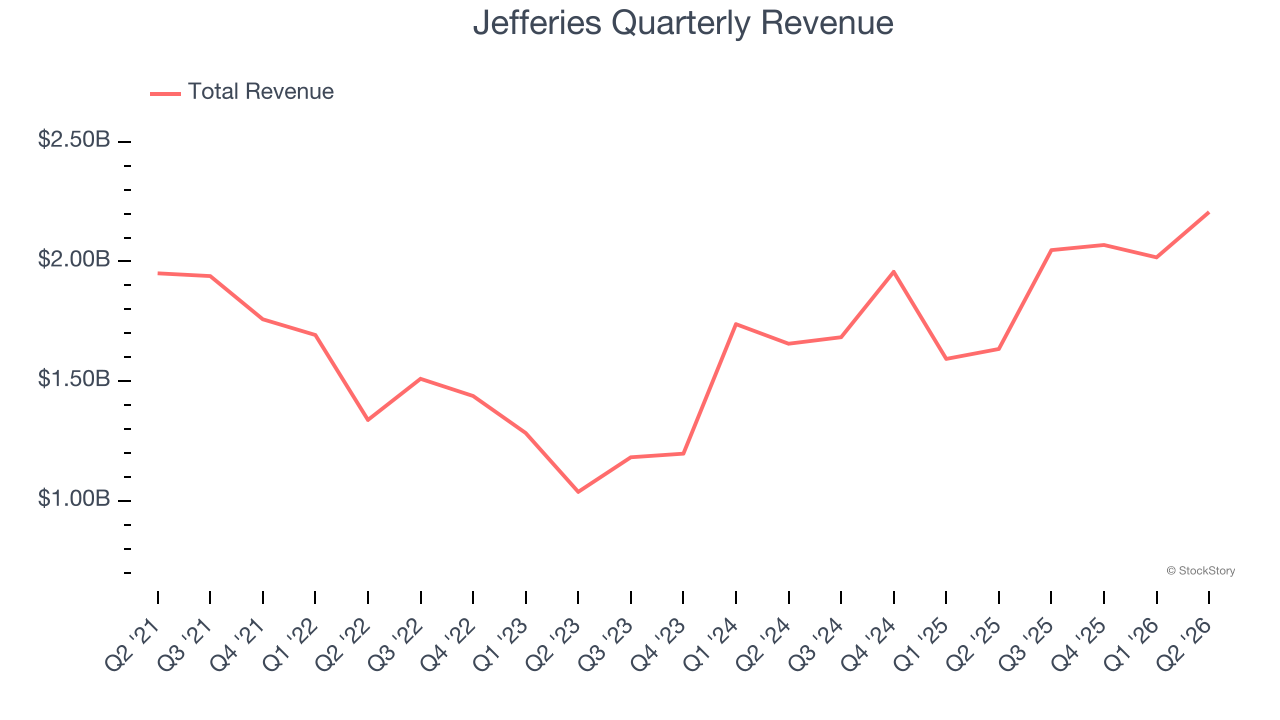
We at StockStory place the most emphasis on long-term growth, but within financials, a half-decade historical view may miss recent interest rate changes, market returns, and industry trends. Jefferies’s annualized revenue growth of 20.2% over the last two years is above its five-year trend, suggesting its demand recently accelerated. 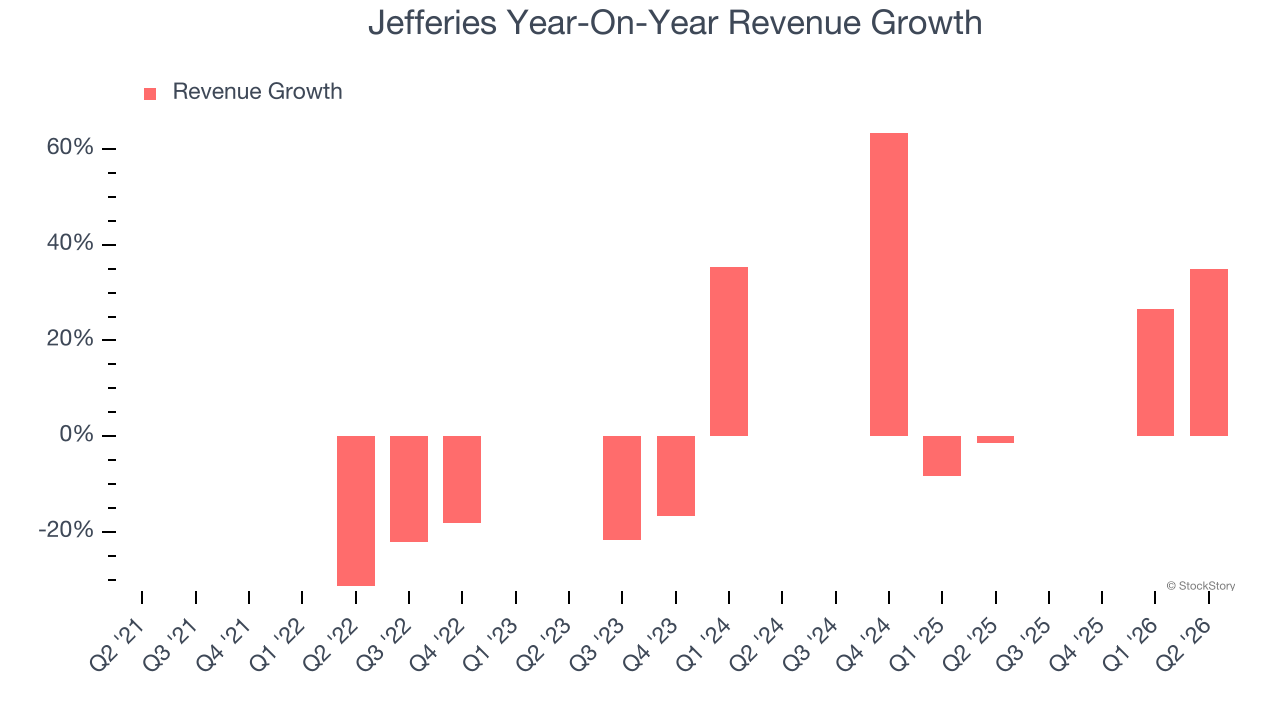 Note: Quarters not shown were determined to be outliers because they were impacted by outsized investment gains/losses that are not indicative of the recurring fundamentals of the business.
This quarter, Jefferies pulled off a wonderful 35% year-on-year revenue growth rate, but its $2.21 billion of revenue fell short of Wall Street’s rosy estimates.
WHILE YOU’RE HERE: The Next Palantir? One satellite company captures images of every point on Earth. Every single day. The Pentagon wants it. Hedge funds are using it to beat earnings. You’ve probably never heard of it.
This is what the early days of Palantir looked like before it became a $437 billion giant. Same playbook. Different technology. If you missed Palantir, you need to see this. Claim The Stock Ticker for Free HERE.
Tangible Book Value Per Share (TBVPS)
The balance sheet drives profitability for financial firms since earnings flow from managing diverse assets and liabilities across multiple business lines. As such, valuations for these companies concentrate on capital strength and sustainable equity accumulation potential across their varied operations.
When analyzing this sector, tangible book value per share (TBVPS) takes precedence over many other metrics. This measure isolates genuine per-share value and provides insight into the institution’s capital position across diverse operations. Other (and more commonly known) per-share metrics like EPS can sometimes be murky due to the complexity of multiple business lines, M&A activity, or accounting rules that vary across different financial services segments.
Jefferies’s TBVPS was flat over the last five years. A turnaround doesn’t seem to be in sight as its TBVPS also dropped by 3.2% annually over the last two years ($36.87 to $34.55 per share).

Tangible Book Value Per Share (TBVPS)
Financial institutions manage complex balance sheets spanning various financial activities. Valuations reflect this complexity, emphasizing balance sheet quality and long-term book value compounding across multiple revenue streams.
This explains why tangible book value per share (TBVPS) is a premier metric for the sector. TBVPS provides concrete per-share net worth that investors can trust when evaluating companies with complex, multi-faceted business models. Traditional metrics like EPS are helpful but face distortion from the complexity of diversified operations, M&A activity, and various accounting rules that can obscure true performance across multiple business lines.
Jefferies’s TBVPS was flat over the last five years. A turnaround doesn’t seem to be in sight as its TBVPS also dropped by 3.2% annually over the last two years ($36.87 to $34.55 per share).
Key Takeaways from Jefferies’s Q2 Results
It was good to see Jefferies beat analysts’ EPS expectations this quarter. On the other hand, its revenue missed. Overall, this quarter could have been better. The stock traded down 2.9% to $56.38 immediately following the results.
Jefferies didn’t show it’s best hand this quarter, but does that create an opportunity to buy the stock right now? What happened in the latest quarter matters, but not as much as longer-term business quality and valuation, when deciding whether to invest in this stock. We cover that in our actionable full research report which you can read here (it’s free).