Property casualty insurer W. R. Berkley (NYSE: WRB) fell short of the market’s revenue expectations in Q2 CY2026 as sales only rose 1.2% year on year to $3.72 billion. Its non-GAAP profit of $1.27 per share was 17.3% above analysts’ consensus estimates.
Is now the time to buy W. R. Berkley? Find out by accessing our full research report, it’s free.
W. R. Berkley (WRB) Q2 CY2026 Highlights:
- Net Premiums Earned: $3.19 billion vs analyst estimates of $3.20 billion (2.9% year-on-year growth, in line)
- Revenue: $3.72 billion vs analyst estimates of $3.77 billion (1.2% year-on-year growth, 1.4% miss)
- Combined Ratio: 90% vs analyst estimates of 91.4% (141.2 basis point beat)
- Adjusted EPS: $1.27 vs analyst estimates of $1.08 (17.3% beat)
- Book Value per Share: $26.50 vs analyst estimates of $28.71 (13.2% year-on-year growth, 7.7% miss)
- Market Capitalization: $27.9 billion
Company Overview
Founded in 1967 and operating through more than 50 specialized insurance units across the globe, W. R. Berkley (NYSE: WRB) underwrites commercial insurance and reinsurance through specialized subsidiaries serving industries from healthcare to construction to transportation.
Revenue Growth
In general, insurance companies earn revenue from three primary sources. The first is the core insurance business itself, often called underwriting and represented in the income statement as premiums earned. The second source is investment income from investing the “float” (premiums collected upfront not yet paid out as claims) in assets such as fixed-income assets and equities. The third is fees from various sources such as policy administration, annuities, or other value-added services. Thankfully, W. R. Berkley’s 11.1% annualized revenue growth over the last five years was impressive. Its growth beat the average insurance company and shows its offerings resonate with customers, a helpful starting point for our analysis.
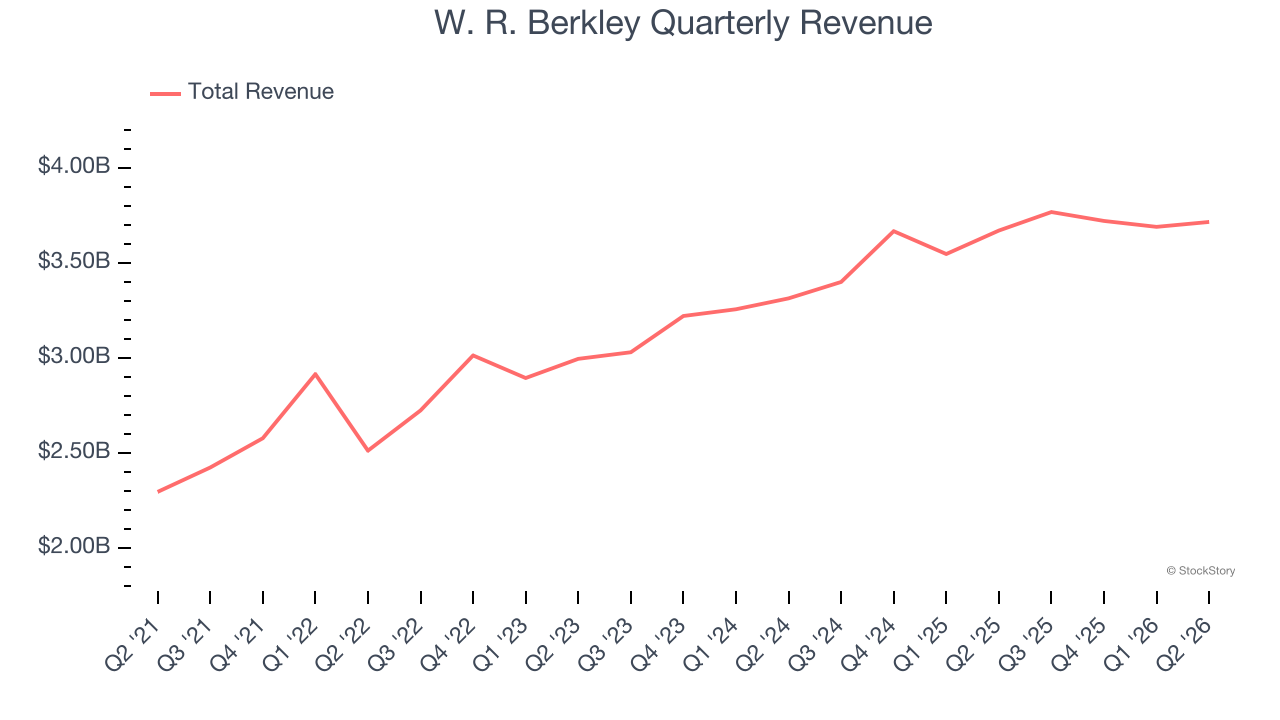
We at StockStory place the most emphasis on long-term growth, but within financials, a half-decade historical view may miss recent interest rate changes, market returns, and industry trends. W. R. Berkley’s annualized revenue growth of 7.8% over the last two years is below its five-year trend, but we still think the results were respectable. 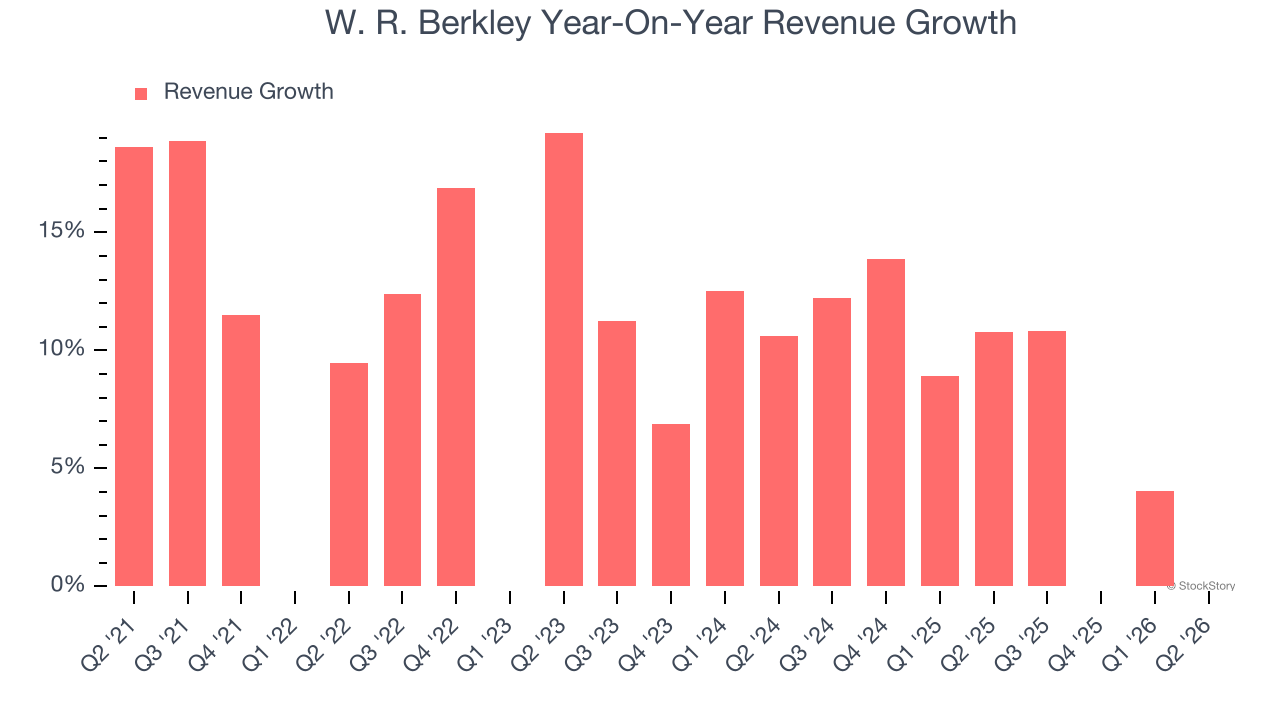 Note: Quarters not shown were determined to be outliers because they were impacted by outsized investment gains/losses that are not indicative of the recurring fundamentals of the business.
This quarter, W. R. Berkley’s revenue grew by 1.2% year on year to $3.72 billion, falling short of Wall Street’s estimates.
Net premiums earned made up 85.1% of the company’s total revenue during the last five years, meaning W. R. Berkley barely relies on non-insurance activities to drive its overall growth.
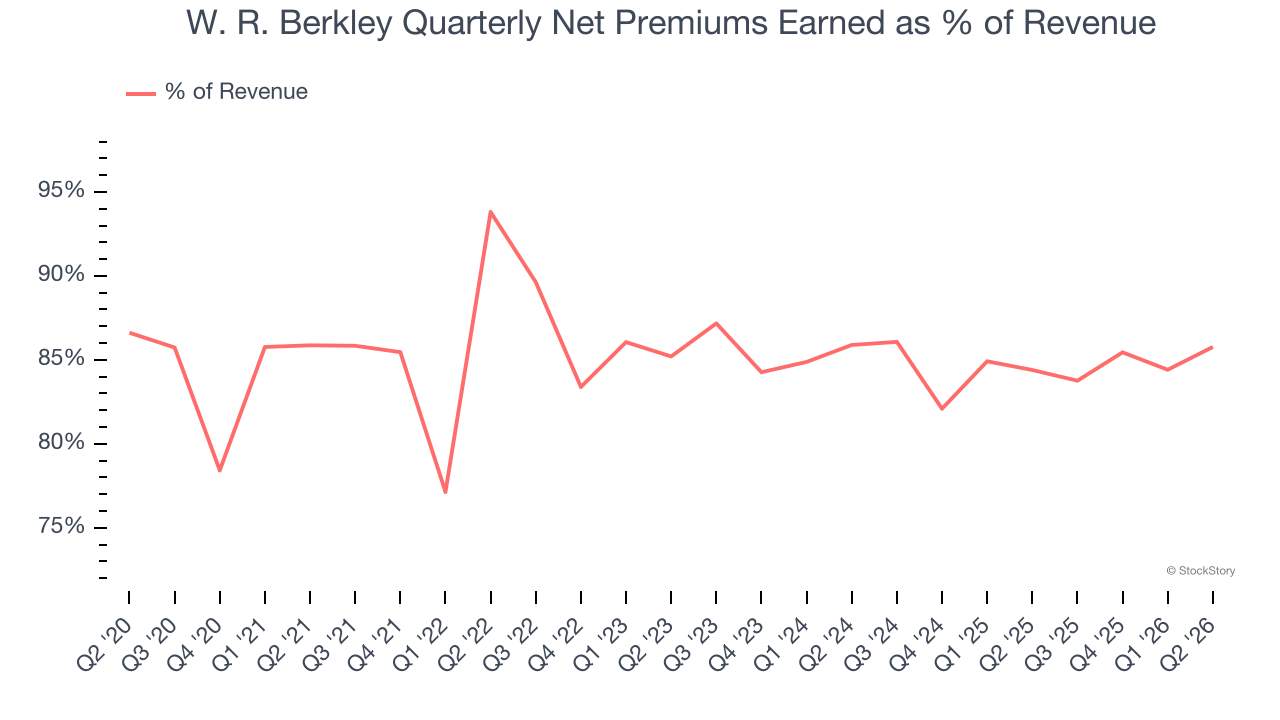
Markets consistently prioritize net premiums earned growth over investment and fee income, recognizing its superior quality as a core indicator of the company’s underwriting success and market penetration.
ONE MORE THING: The $21 AI Application Stock Wall Street Forgot. While Wall Street obsesses over who’s building AI, one company is already using it to print money. And nobody’s paying attention.
AI chip stocks trade at ridiculous valuations. This company processes a trillion consumer signals monthly using AI and trades at a third of the price. The gap won’t last. The institutions will figure it out. You need to see this first. Read the FREE Report Before They Notice.
Book Value Per Share (BVPS)
Insurance companies are balance sheet businesses, collecting premiums upfront and paying out claims over time. The float (premiums collected but not yet paid out) is invested, creating an asset base supported by a liability structure. Book value per share (BVPS) captures this dynamic by measuring these assets (investment portfolio, cash, reinsurance recoverables) less liabilities (claim reserves, debt, future policy benefits). BVPS is essentially the residual value for shareholders.
We therefore consider BVPS very important to track for insurers and a metric that sheds light on business quality. While other (and more commonly known) per-share metrics like EPS can sometimes be lumpy due to reserve releases or one-time items and can be managed or skewed while still following accounting rules, BVPS reflects long-term capital growth and is harder to manipulate.
W. R. Berkley’s BVPS grew at an impressive 10.9% annual clip over the last five years. BVPS growth has also accelerated recently, growing by 16.5% annually over the last two years from $19.53 to $26.50 per share.
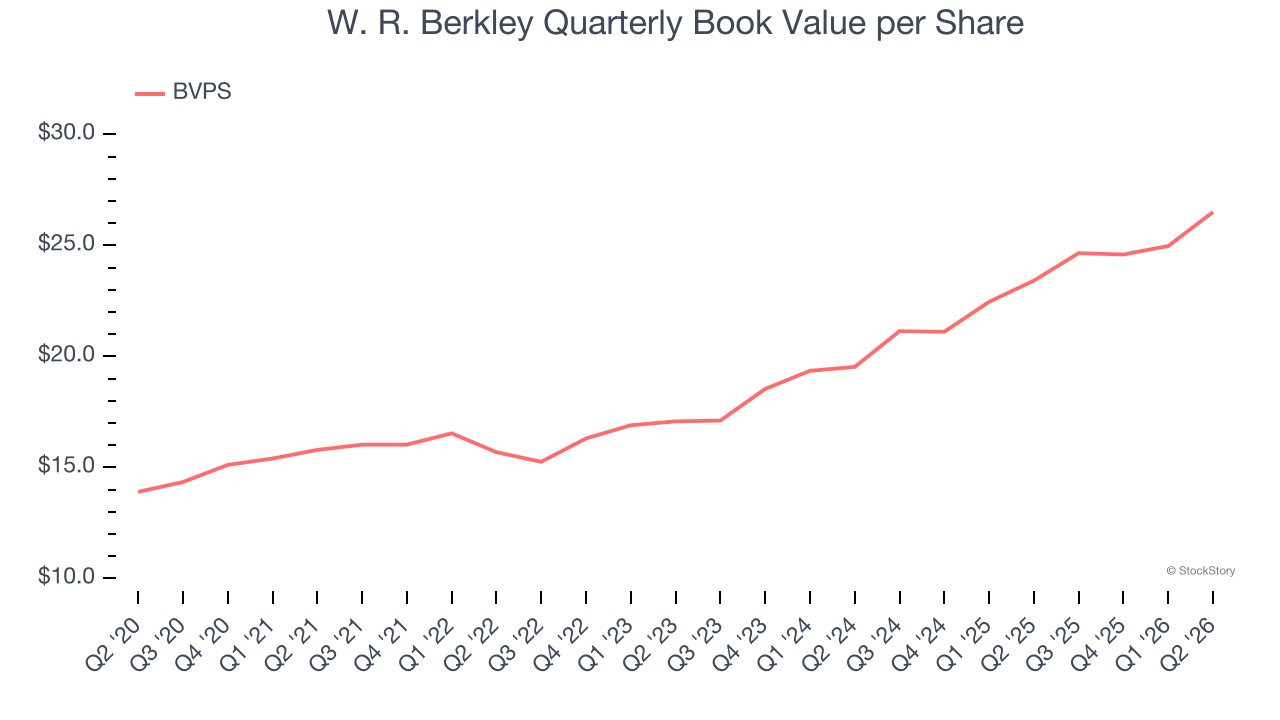
Over the next 12 months, Consensus estimates call for W. R. Berkley’s BVPS to grow by 21.2% to $28.71, elite growth rate.
Key Takeaways from W. R. Berkley’s Q2 Results
It was good to see W. R. Berkley beat analysts’ EPS expectations this quarter. On the other hand, its book value per share missed and its revenue fell slightly short of Wall Street’s estimates. Overall, this quarter could have been better. The stock remained flat at $72.30 immediately after reporting.
So do we think W. R. Berkley is an attractive buy at the current price? If you’re making that decision, you should consider the bigger picture of valuation, business qualities, as well as the latest earnings. We cover that in our actionable full research report which you can read here (it’s free).