
Regional banking company National Bank Holdings (NYSE: NBHC) fell short of the market’s revenue expectations in Q2 CY2026, but sales rose 25.4% year on year to $129.1 million. Its non-GAAP profit of $0.78 per share was 3.7% below analysts’ consensus estimates.
Is now the time to buy National Bank Holdings? Find out by accessing our full research report, it’s free.
National Bank Holdings (NBHC) Q2 CY2026 Highlights:
- Net Interest Income: $109.3 million vs analyst estimates of $117.3 million (25% year-on-year growth, 6.8% miss)
- Net Interest Margin: 3.9% vs analyst estimates of 4.1% (12.3 basis point miss)
- Revenue: $129.1 million vs analyst estimates of $131.9 million (25.4% year-on-year growth, 2.1% miss)
- Efficiency Ratio: 72.3% vs analyst estimates of 61.3% (1,098.7 basis point miss)
- Adjusted EPS: $0.78 vs analyst expectations of $0.81 (3.7% miss)
- Tangible Book Value per Share: $26.23 vs analyst estimates of $26.54 (flat year on year, 1.2% miss)
- Market Capitalization: $2.05 billion
Company Overview
Operating under familiar local brands like Community Banks of Colorado, Bank Midwest, and Bank of Jackson Hole, National Bank Holdings (NYSE: NBHC) operates regional banks across Colorado, Kansas, Missouri, Wyoming, Texas, and other western states, offering commercial, business, and consumer banking services.
Sales Growth
Net interest income and fee-based revenue are the two pillars supporting bank earnings. The former captures profit from the gap between lending rates and deposit costs, while the latter encompasses charges for banking services, credit products, wealth management, and trading activities. Over the last five years, National Bank Holdings grew its revenue at a tepid 7.6% compounded annual growth rate. This was below our standard for the banking sector and is a tough starting point for our analysis.
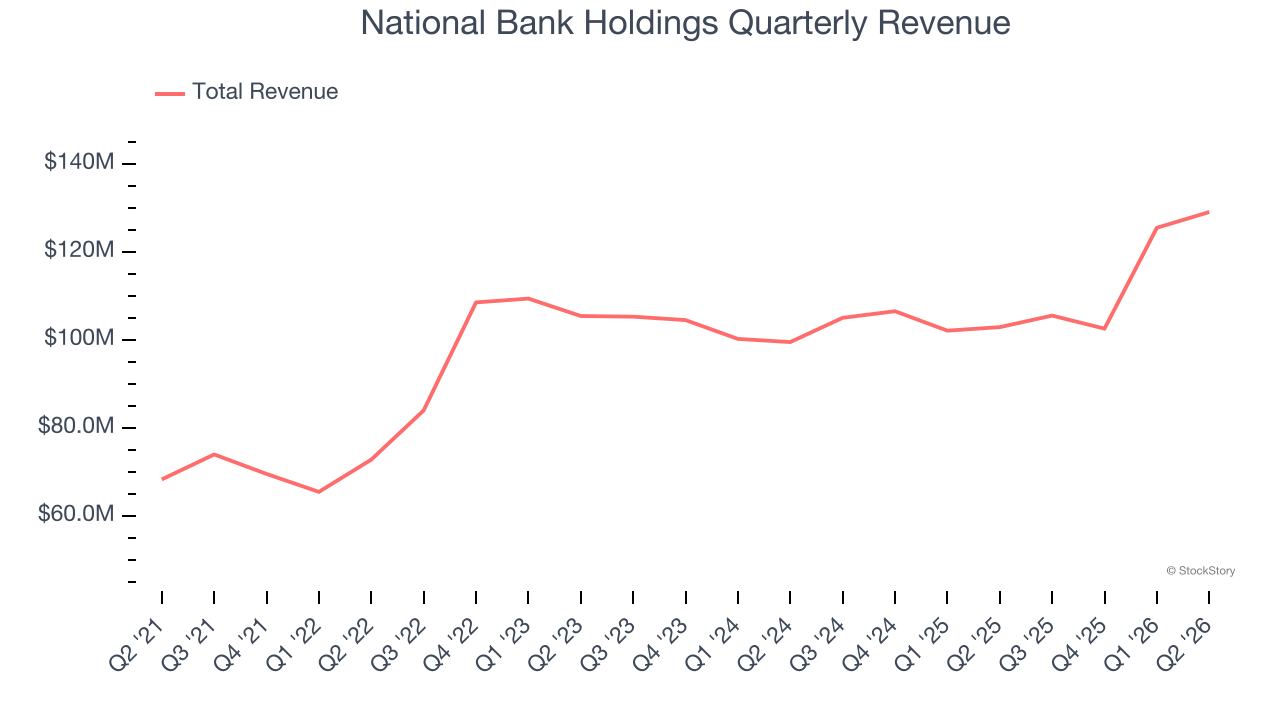
Long-term growth is the most important, but within financials, a half-decade historical view may miss recent interest rate changes and market returns. National Bank Holdings’s recent performance shows its demand has slowed as its annualized revenue growth of 6.3% over the last two years was below its five-year trend. We’re wary when companies in the sector see decelerations in revenue growth, as it could signal changing consumer tastes aided by low switching costs. 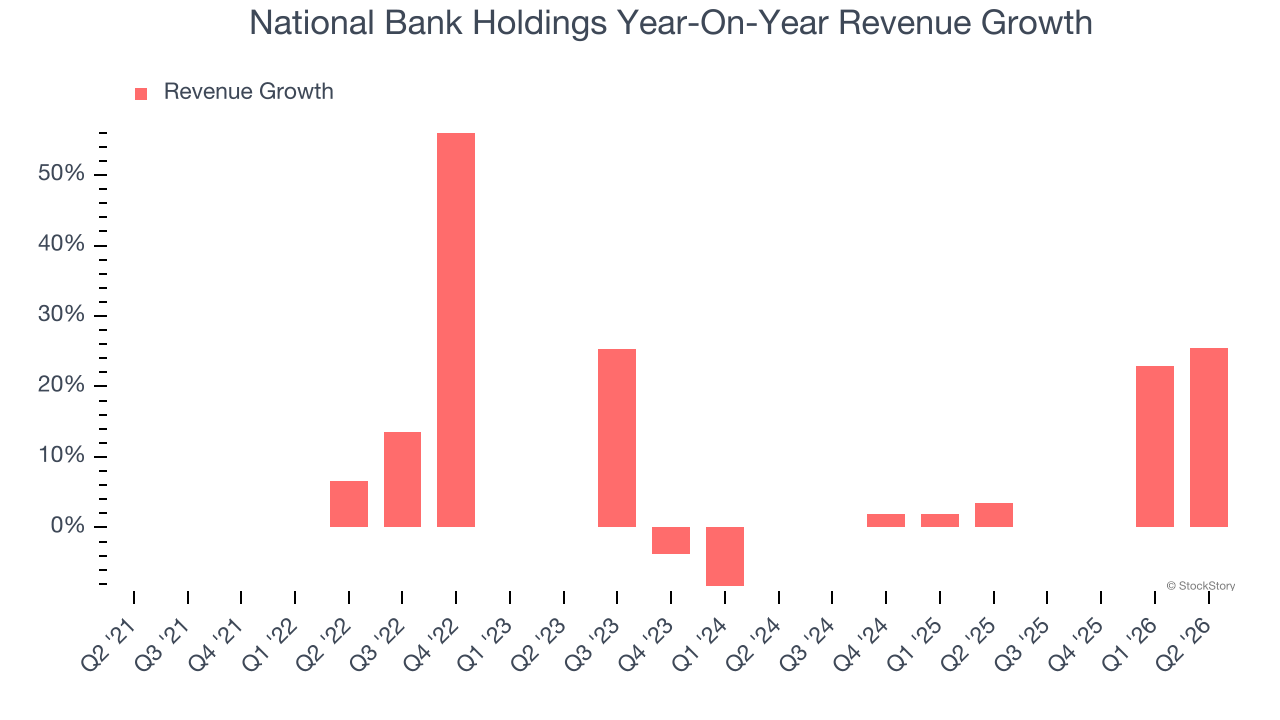 Note: Quarters not shown were determined to be outliers because they were impacted by outsized investment gains/losses that are not indicative of the recurring fundamentals of the business.
This quarter, National Bank Holdings generated an excellent 25.4% year-on-year revenue growth rate, but its $129.1 million of revenue fell short of Wall Street’s high expectations.
Net interest income made up 82% of the company’s total revenue during the last five years, meaning National Bank Holdings barely relies on non-interest income to drive its overall growth.
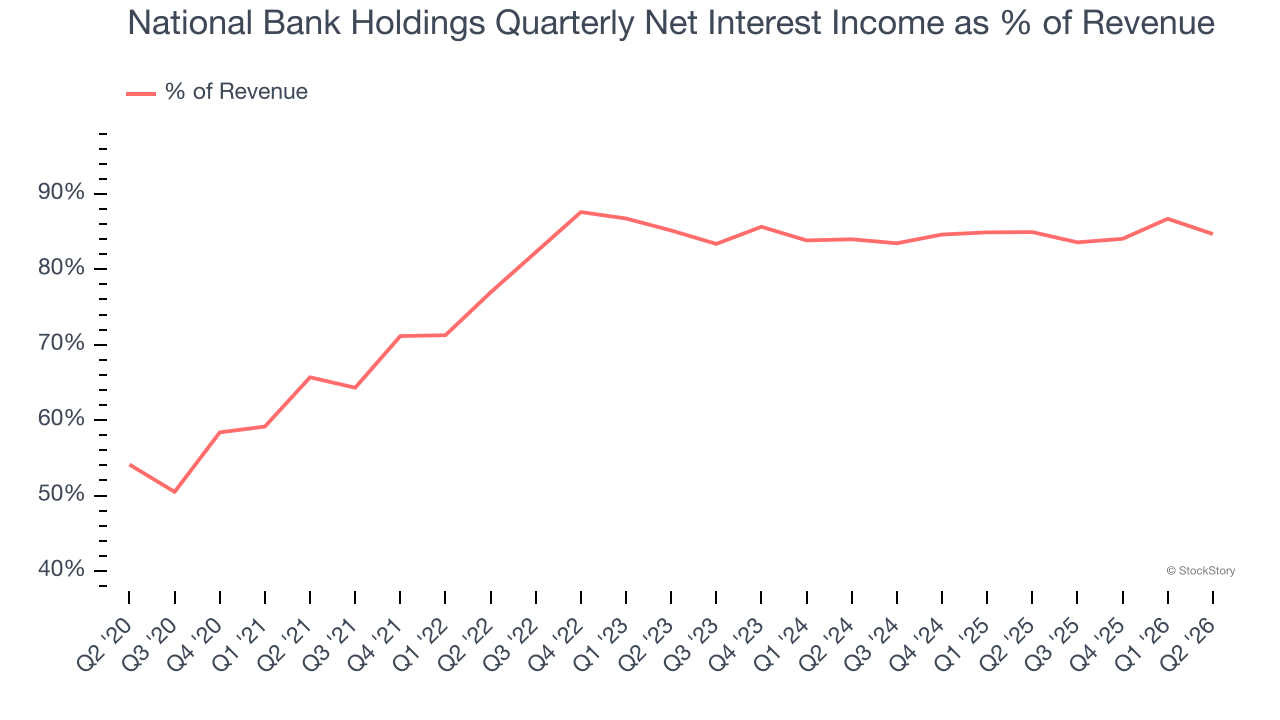
While banks generate revenue from multiple sources, investors view net interest income as the cornerstone - its predictable, recurring characteristics stand in sharp contrast to the volatility of non-interest income.
ALSO WORTH WATCHING: Nvidia’s Quiet Partner. Nvidia’s chips cost a hundred grand. The connectors that make them work cost even more. One company makes them all.
Every AI server needs specialized infrastructure the chip companies don’t make. High-speed cables. Power connectors. Thermal sensors. This 90-year-old company built a monopoly on it. The AI boom just started. This stock is still flying under the radar. Claim The Stock Ticker Here for FREE.
Tangible Book Value Per Share (TBVPS)
The balance sheet drives banking profitability since earnings flow from the spread between borrowing and lending rates. As such, valuations for these companies concentrate on capital strength and sustainable equity accumulation potential.
Because of this, tangible book value per share (TBVPS) emerges as the critical performance benchmark. By excluding intangible assets with uncertain liquidation values, this metric captures real, liquid net worth per share. On the other hand, EPS is often distorted by mergers and flexible loan loss accounting. TBVPS provides clearer performance insights.
National Bank Holdings’s TBVPS grew at a sluggish 2.1% annual clip over the last five years. However, TBVPS growth has accelerated recently, growing by 5.9% annually over the last two years from $23.40 to $26.23 per share.
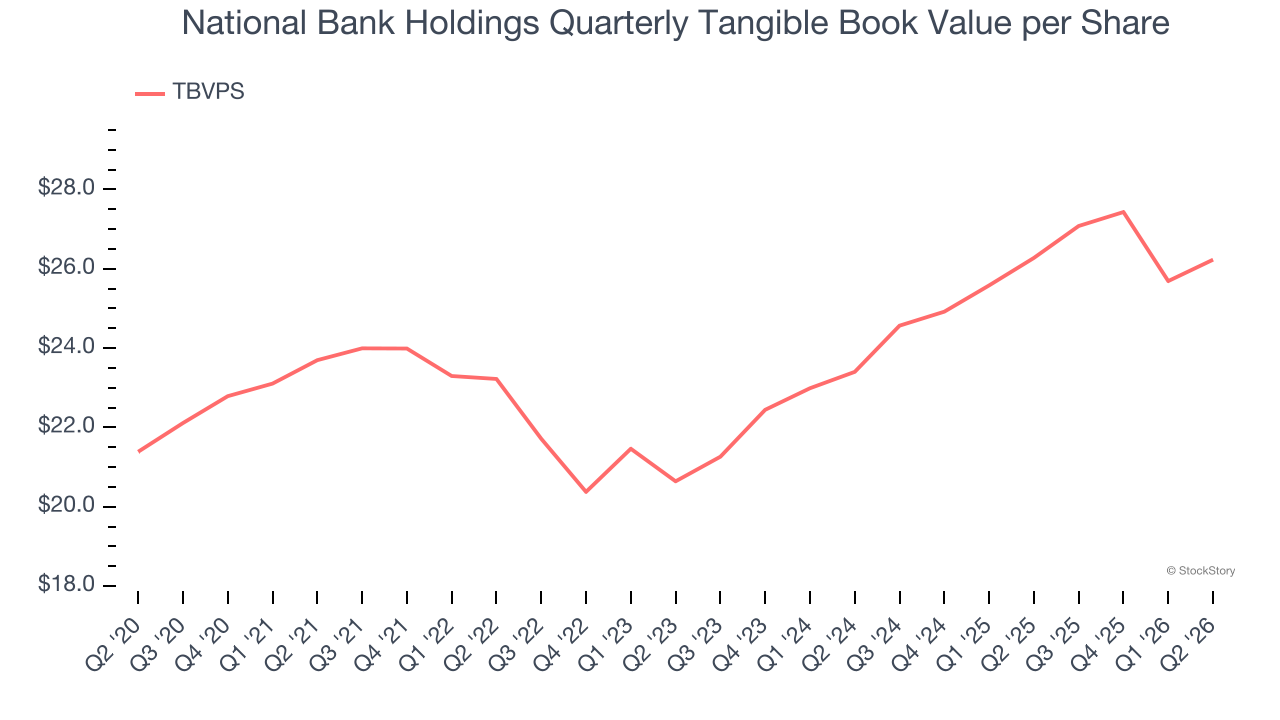
Over the next 12 months, Consensus estimates call for National Bank Holdings’s TBVPS to grow by 13.9% to $29.89, decent growth rate.
Key Takeaways from National Bank Holdings’s Q2 Results
We struggled to find many positives in these results. Its net interest income missed and its EPS fell short of Wall Street’s estimates. Overall, this quarter could have been better. The stock remained flat at $45.61 immediately following the results.
So do we think National Bank Holdings is an attractive buy at the current price? We think that the latest quarter is only one piece of the longer-term business quality puzzle. Quality, when combined with valuation, can help determine if the stock is a buy. We cover that in our actionable full research report which you can read here (it’s free).