
Specialty insurance company Markel Group (NYSE: MKL) beat Wall Street’s revenue expectations in Q2 CY2026, but sales were flat year on year at $4.02 billion. Its GAAP profit of $92.76 per share was 13.9% above analysts’ consensus estimates.
Is now the time to buy Markel Group? Find out by accessing our full research report, it’s free.
Markel Group (MKL) Q2 CY2026 Highlights:
- Net Premiums Earned: $2.07 billion vs analyst estimates of $2.03 billion (3.3% year-on-year decline, 2.3% beat)
- Revenue: $4.02 billion vs analyst estimates of $3.97 billion (flat year on year, 1.2% beat)
- Combined Ratio: 93% vs analyst estimates of 92.1% (93.3 basis point miss)
- EPS (GAAP): $92.76 vs analyst estimates of $81.43 (13.9% beat)
- Market Capitalization: $25.22 billion
"In the first half of 2026, our insurance underwriting improved, our businesses generated strong cash flow, and we continued to allocate capital with discipline, including ongoing share repurchases funded from net earnings," said Tom Gayner, Chief Executive Officer.
Company Overview
Often referred to as a "mini Berkshire Hathaway" for its three-engine business model of insurance, investments, and wholly-owned businesses, Markel Group (NYSE: MKL) is a specialty insurance company that underwrites complex risks, manages investment portfolios, and owns a diverse collection of operating businesses.
Revenue Growth
In general, insurance companies earn revenue from three primary sources. The first is the core insurance business itself, often called underwriting and represented in the income statement as premiums earned. The second source is investment income from investing the “float” (premiums collected upfront not yet paid out as claims) in assets such as fixed-income assets and equities. The third is fees from various sources such as policy administration, annuities, or other value-added services. Over the last five years, Markel Group grew its revenue at a solid 9% compounded annual growth rate. Its growth beat the average insurance company and shows its offerings resonate with customers.
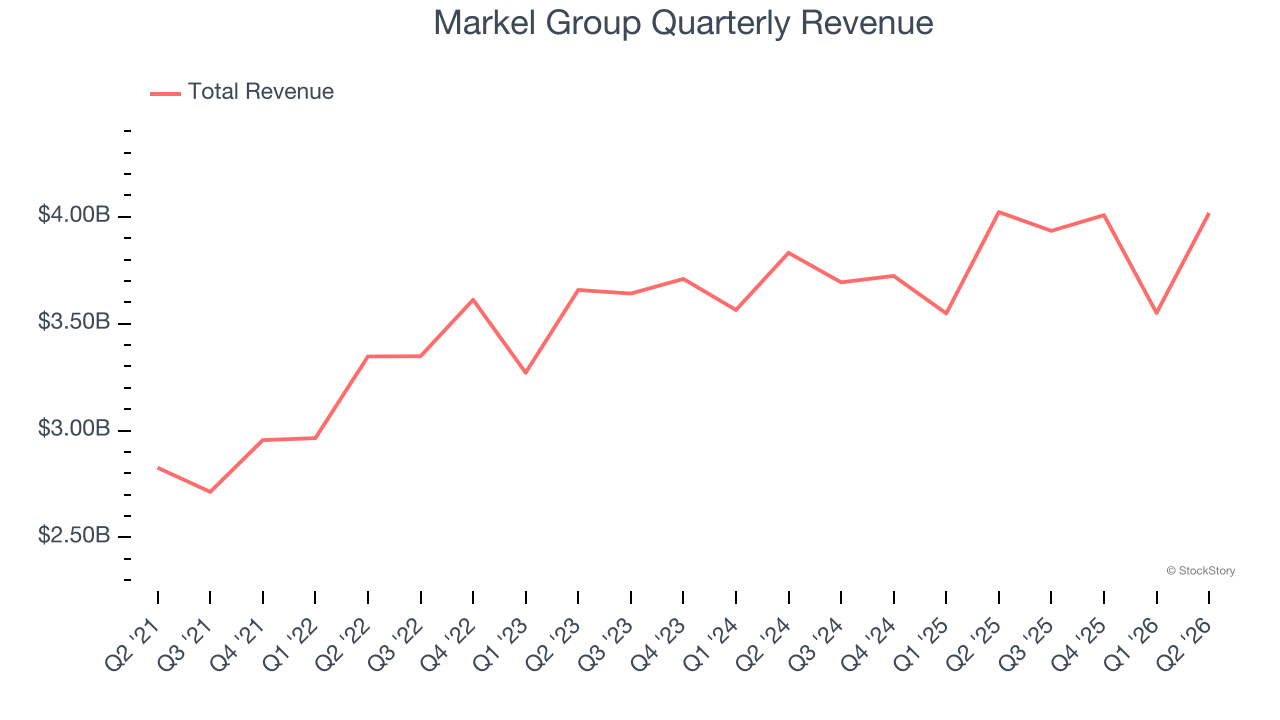
Long-term growth is the most important, but within financials, a half-decade historical view may miss recent interest rate changes and market returns. Markel Group’s recent performance shows its demand has slowed as its annualized revenue growth of 2.6% over the last two years was below its five-year trend. We’re wary when companies in the sector see decelerations in revenue growth, as it could signal changing consumer tastes aided by low switching costs. 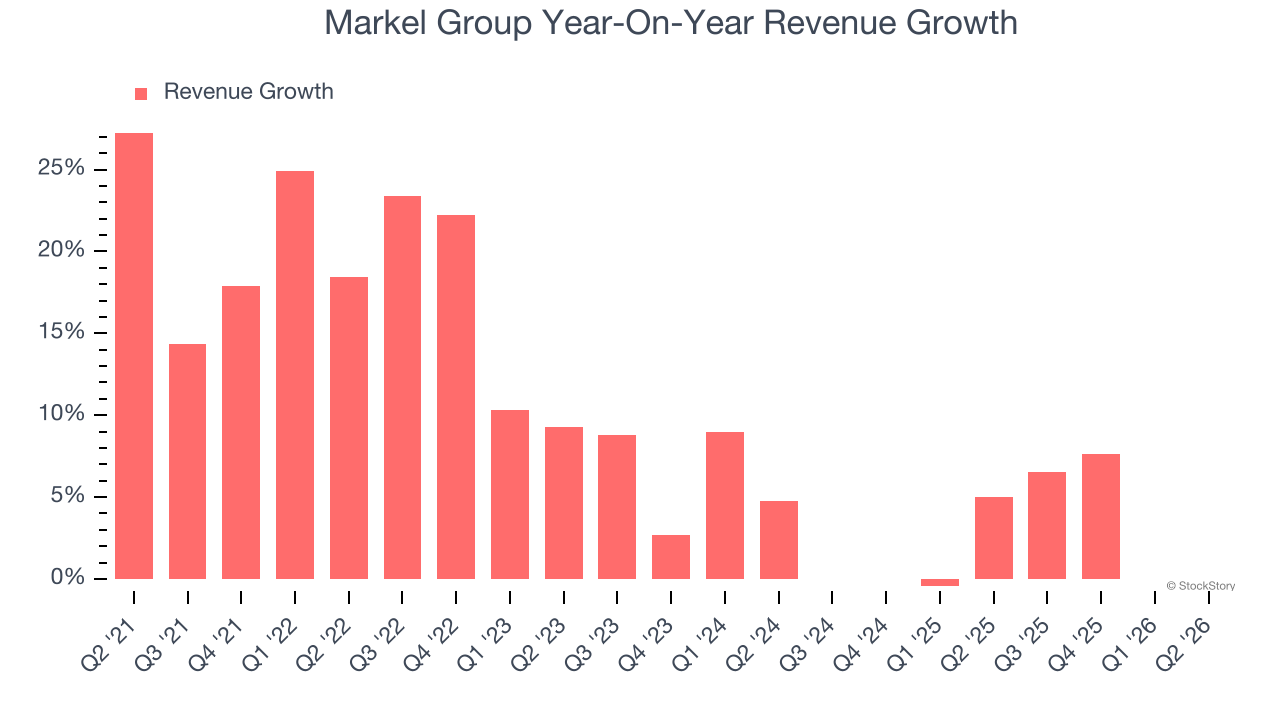 Note: Quarters not shown were determined to be outliers because they were impacted by outsized investment gains/losses that are not indicative of the recurring fundamentals of the business.
This quarter, Markel Group’s $4.02 billion of revenue was flat year on year but beat Wall Street’s estimates by 1.2%.
Net premiums earned made up 57.1% of the company’s total revenue during the last five years, meaning Markel Group’s growth drivers strike a balance between insurance and non-insurance activities.
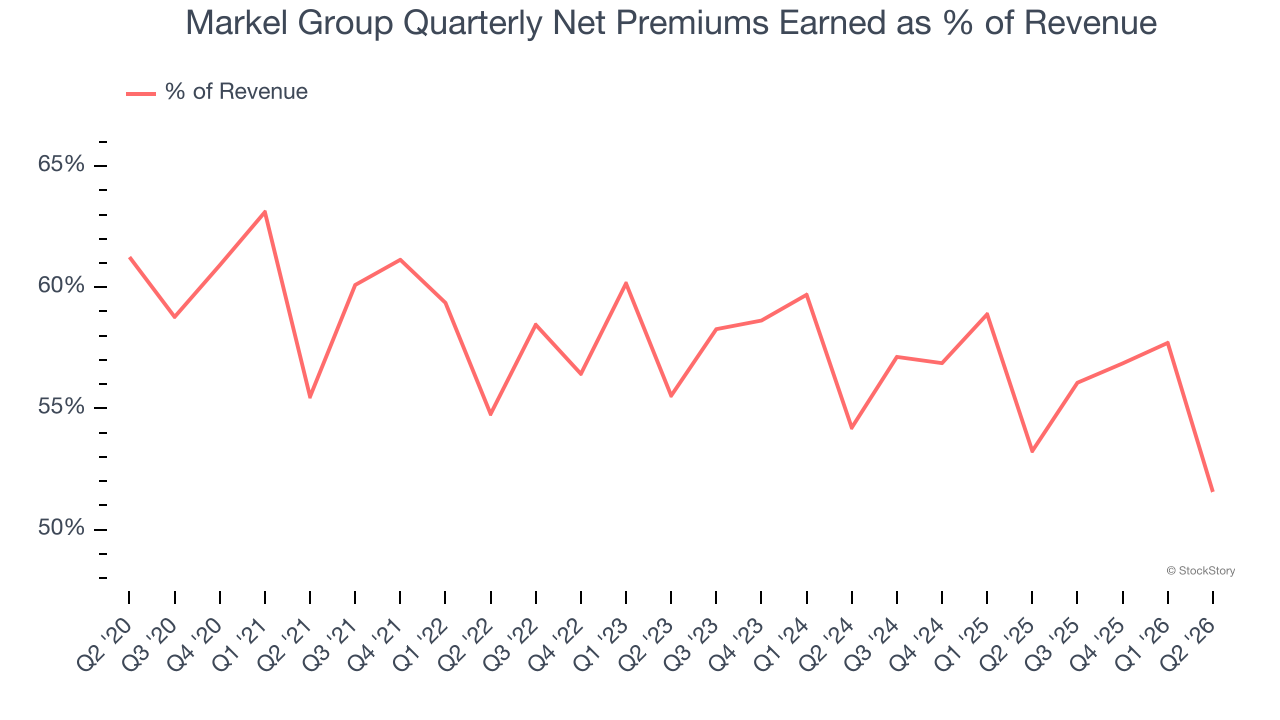
Net premiums earned command greater market attention due to their reliability and consistency, whereas investment and fee income are often seen as more volatile revenue streams that fluctuate with market conditions.
ALSO WORTH WATCHING: Nvidia’s Quiet Partner. Nvidia’s chips cost a hundred grand. The connectors that make them work cost even more. One company makes them all.
Every AI server needs specialized infrastructure the chip companies don’t make. High-speed cables. Power connectors. Thermal sensors. This 90-year-old company built a monopoly on it. The AI boom just started. This stock is still flying under the radar. Claim The Stock Ticker Here for FREE.
Net Premiums Earned
When insurers sell policies, they protect themselves from extremely large losses or an outsized accumulation of losses with reinsurance (insurance for insurance companies). Net premiums earned are therefore net of what’s ceded to reinsurers as a risk mitigation and transfer strategy.
Markel Group’s net premiums earned has grown at a 7.5% annualized rate over the last five years, slightly better than the broader insurance industry but slower than its total revenue.
When analyzing Markel Group’s net premiums earned over the last two years, we can see that growth halted as income was flat. Since two-year net premiums earned underperformed total revenue over this period, it’s implied that insurance policies were a detractor of consolidated growth.
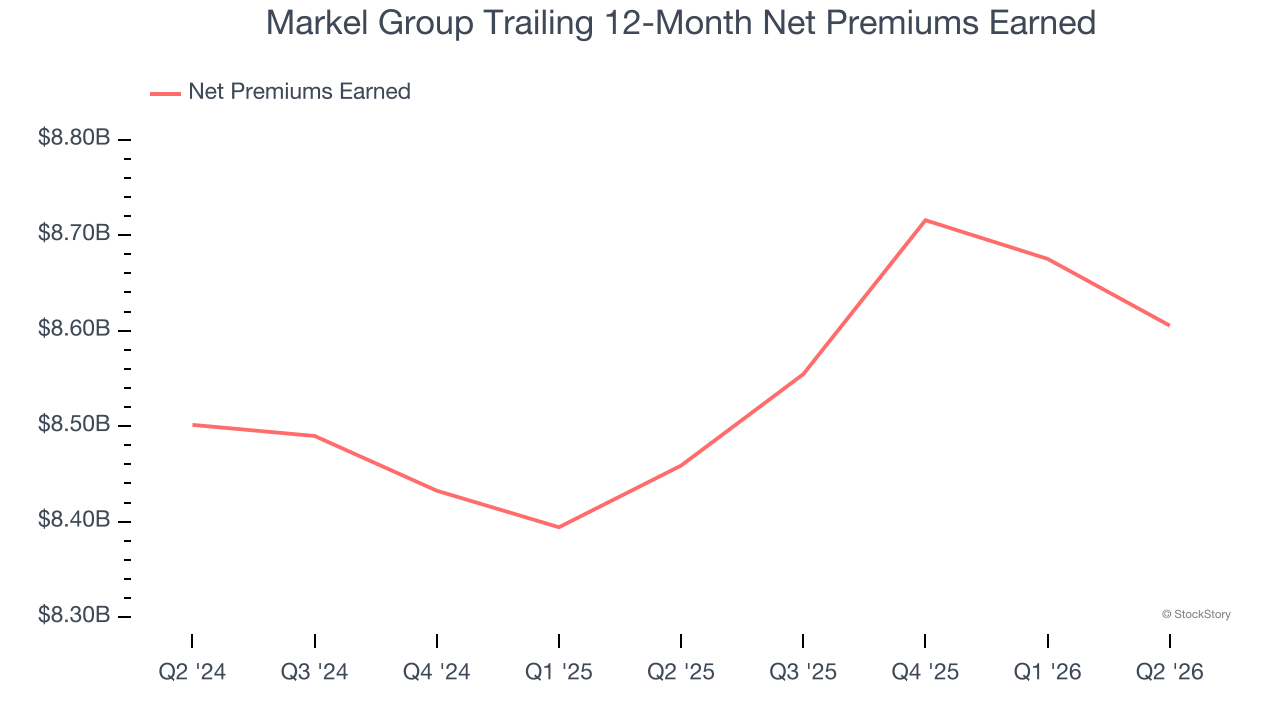
Markel Group produced $2.07 billion of net premiums earned in Q2, down 3.3% year on year. But this was still enough to top Wall Street Consensus estimates by 2.3%.
Key Takeaways from Markel Group’s Q2 Results
We enjoyed seeing Markel Group beat analysts’ net premiums earned expectations this quarter. We were also glad its EPS outperformed Wall Street’s estimates. Zooming out, we think this was a good print with some key areas of upside. The market seemed to be hoping for more, and the stock traded down 1.2% to $1,990 immediately following the results.
So should you invest in Markel Group right now? We think that the latest quarter is only one piece of the longer-term business quality puzzle. Quality, when combined with valuation, can help determine if the stock is a buy. We cover that in our actionable full research report which you can read here (it’s free).